The Bureau of Mines conducted research on the flotation hydrodynamics of fine particle flotation to improve the flotation efficiency in our domestic minerals industry. The turbulent fluid velocity profile was measured in various flotation cells at different levels of dissipation energy. The importance of dissipation energy and bubble size within the flotation cells for the flotation response of a chalcopyrite ore was evaluated. Both increased turbulent fluid flow and fine size bubbles improved the flotation rate of fine size chalcopyrite particles.
The importance of surface chemistry in the flotation process has long been recognized as recorded by Fuerstenau (1962, 1976). Research to improve the chemistry of the flotation process is continuing. Arbiter (1988) commented that the flotation machine for carrying out flotation has changed little in the last 50 years. Bigger cells have been produced but the basic concept remained the same. Considerable research into the use of column flotation device has been conducted and column flotation has found a place in the mineral processing industry. However, the bulk of minerals recovered by flotation is done in standard flotation machines. The hydrodynamic effects in these cells have received little attention. Early pioneers, like Arbiter (1969), recognized that the hydrodynamic effects during flotation needed to be studied and quantified. Research activities on the flotation hydrodynamics have accelerated, starting with Schubert and Bischofberger (1978, 1979) in the late 70’s and continuing to the present with Nonaka (1982), Weib (1988), and Jordan (1988). As part of the recent hydrodynamic research, several models have been developed to explain various aspects of the flotation process by Nonaka (1982), Dobby (1987), and Jordan (1989).
The problem of recovering fine particles from present day ores is receiving attention also. Conventional froth flotation for many ore systems is very effective for particles between 300 and 20 pm in size, but the flotation efficiency commonly drops off as the particle size decreases below 20 µm. Flotation kinetics has been used by Sutherland (1955) and subsequent researchers to explain this inefficiency. The rate of flotation of a particle by a bubble was expressed by Kelley (1982), as the product of the probability of collision (Pc) between the particle and bubble, the probability of
K = Pc · Pa · Pf · Ps……………………………………………………………………(1)
attachment (Pa) between the bubble and particle, the probability of the bubble with particle attached entering the froth (Pf), and the probability of the bubble and particle remaining attached throughout the flotation process (Ps).
For the most part, the probability of attachment depends upon the surface characteristics of the mineral and the degree of collector absorption on the mineral surface. Philippoff (1952) and Scheludko (1967) showed that induction time for attachment decreased as the particle size decreased. Because of the shorter induction time, fine particles should float faster, which does not explain the observed decline in flotation efficiency for fine size particles.
The probability of a particle remaining attached to a bubble depends upon the degree of turbulence found in the system. The same forces that brought the particle and bubble together are available to separate them. Woodburn (1971) showed that

where dp is the particle diameter and dmax p is the maximum particle size that will remain attached under the prevailing turbulent conditions. The probability is lowest for coarse size particles and approaches unity for fine size particles. Once attached, the probability of remaining attached is very high for fine size particles.
Based on these considerations, it appears for fine particles that the poor probability of collision is the main reason for poor flotation. This means that the hydrodynamic forces are very important for flotation of fine particles.
Procedure Results and Discussion
The probability of collision depends upon the number and size of the particles and the bubbles and the hydrodynamics of the flotation pulp. This probability is directly related to the number of collisions per unit time and unit volume. Schubert and Bischofberger (Nonaka, 1982) presented the following formula for the number of collisions in a flotation system:
![]()
where Np is the number of particles,
Nb is the number of bubbles,
rpb is the sum of particles and bubble radii, and
Vp² and Vb² are the mean squares of the effective relative velocity between the particle and bubble. From the equation it can be seen that by increasing the number of bubbles and the relative velocities of the bubbles and particles, the number of collisions can be increased for a given ore pulp. The problem with the model solution is the fact that researchers use the mean square fluid velocity for the entire cell. A single velocity does not represent the hydrodynamic forces throughout a flotation cell. In the vicinity of the impeller, turbulence is very high, but away from that region in the cell a wide spread range of possibilities exist. To measure the velocity profile in the flotation cell, an electrochemical technique adopted from Mizushina (1971) can be used. A small electrochemical probe was constructed with a small platinum wire cathode sealed at the tip of a 3~mm-diam glass tube. A larger platinum anode was formed by wrapping wire around the glass tube about 3 mm from the cathode and near the tip of the glass tube. When -300 mV potential was applied to the cathode in a 0.001 molar solution of ferric and ferrous cyanide, the current was limited by the small cathode surface area (0.001 mm). The diffusion rate of the ferric ions controlled the current through the system. In a flotation cell, the fluid velocity moving past the small cathode surface was directly related to the apparent ferric ion diffusion rate. Therefore, current measurements of the electrode probe instantaneously measured the fluid velocity at the 0.001 mm² surface of the cathode. The electrode was calibrated by pumping known volumes of the electrolyte through a 3-mm-diam tube directed at the small cathode surface of the probe. The probe measured the limiting current at each known fluid flow. The corresponding fluid velocity was calculated from the flow rate and the cross-sectional area of the tube. An analog to digital converter was linked to a computer to measure and record the current through the electrode. To ensure accuracy, the electrode was calibrated before and after the velocity measurements. Figure 1 shows a typical calibration curve. Changes in the electrolyte
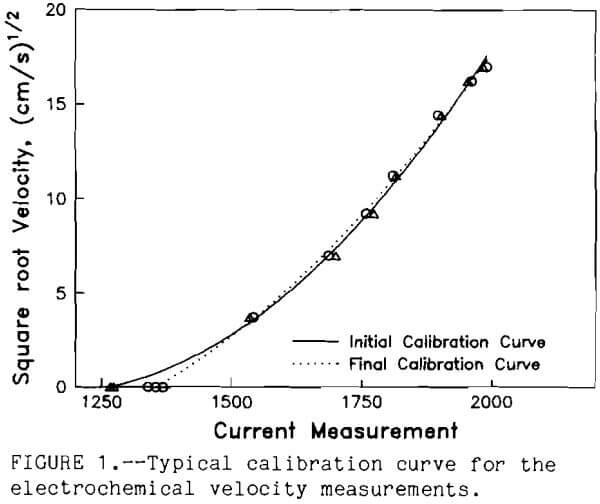
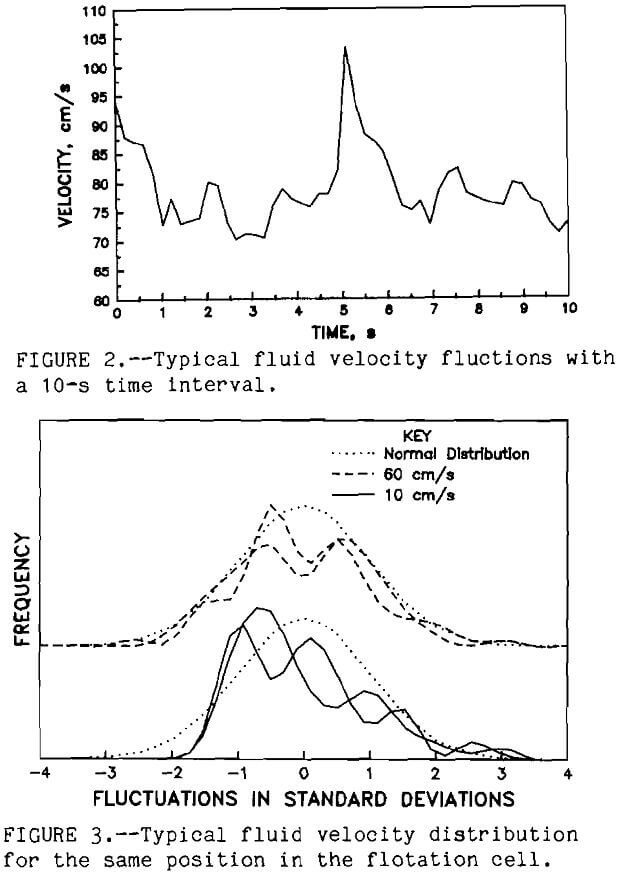
could be detected by comparing the pre- and post- calibration curves. Velocity measurements were taken only for about 1 h to minimize the changes in the electrolyte. The computer system measured the electrode current once every 100 ms. At least 200 measurements were made at each selected position throughout the flotation cell. These experiments were conducted in a standard flotation cell Denver DR1 at 1 ,000 rpm. The measurements were conducted with electrolyte solution in the cell. Figure 2 shows the typical velocity fluctuations for 10 s. The mean fluid velocity with time (Uf) for each selected position was calculated along with the standard deviation (TUf) of the turbulent velocity fluctuations. The fluid velocity distribution was formed by grouping the fluid velocities into 21 equal intervals between the plus or minus 5 times TUf. The frequency of the fluid velocity within each fluid velocity interval determined its probability (Pt). A typical fluid velocity distribution is shown in figure 3.
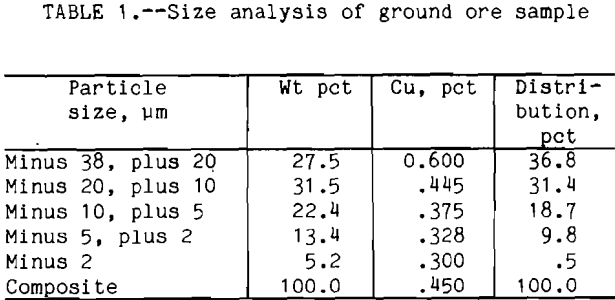
Flotation tests were conducted using a western porphyry copper ore from Arizona. The major sulfide mineral was chalcopyrite with smaller amounts of pyrite. The gangue was mostly plagioclase feldspar with small amounts of biotite and magnetite. The chalcopyrite was widely disseminated throughout the ore pieces, and the
liberation size was around 210 µm. The procedure for the flotation tests was as follows: the ore sample was ground with clear saturated lime water for 1 h in a laboratory rod mill at 65 pct solids and screened at 38 µm size. The plus 38 µm fraction was reground for another hour. The ore sample was over ground to obtain enough minus 20 µm particles for this research. The size distribution and analysis are shown in table 1 .
The ground ore pulp was thickened to 50 pct solids, followed by flotation conditioning in a high-speed blender (1,700 rpm) to ensure complete coverage with the flotation collector. Clear saturated lime water was used to keep the pH at 12.4 to 12.5. Potassium amyl xanthate at a dosage of 0.025 g/kg was used for the chalcopyrite collector. After conditioning for 5 min, the sample was ready for flotation.
The slurry was placed in a conventional 500-g Denver DR flotation cell. The pulp was diluted to 25 pct solids with clear saturated lime water, and Dowfroth 400 frother was added to raise the frother concentration to 25 ppm (0.075 g/kg). The sample was floated for 1, 2, or 5 min at 1,000 r/min with 2.25 L/min of air. The three different flotation times were used so that the flotation rate could be measured. The flotation rate constant for first order kinetics was calculated from the slope of the natural logarithm of the fraction of copper still in the flotation cell versus time. The flotation rate constant with units, min-¹, becomes a direct measure of the flotation rate. Saturated lime water was used to maintain the pH and froth height. After each flotation test, the concentrate and tailings were dried and analyzed for copper. The above procedure was called “conventional” flotation and formed the baseline characteristics for comparison with the alternative flotation, defined as high-speed conventional flotation, which used the same procedure as the conventional flotation method except the impeller speed was increased to 2,400 r/min for the flotation stage.
Fine-bubble flotation was conducted in a modified 500 g MS flotation cell. A 6-cm-diam by 2-mm-thick disk was used to replace the flotation impeller. Sebba (1985) showed that at high rotation speed, the spinning disk sheared air in the pulp and formed fine-sized bubbles. Flotation tests conducted with this cell were called “spinning disk” flotation. The cell was tested at 2,800 r/min, 4,450 r/min, and 7,000 r/min. For these tests, the laboratory procedure, reagent levels, and airflow rate were identical to those of the conventional flotation method. The size distribution of the flotation bubbles was measured for each flotation test without the ore sample but including the water, reagents, and air. A sample of the bubble slurry was continuously drawn through a small tube to an observation cell under a microscope. A peristaltic pump was used to draw the bubble slurry through a microscope observation stage and return it to the flotation cell. Periodically the pump was stopped and a photograph of the bubble slurry was quickly made through the microscope. These bubble photographs were evaluated with an image analyzer to determine the bubble sizes and the frequency distribution of each size bubble. During these measurements, the air content of the bubble slurry was measured by pumping the bubble slurry to a small graduated cylinder. After the froth coalesces, the water content of the bubble slurry was measured.
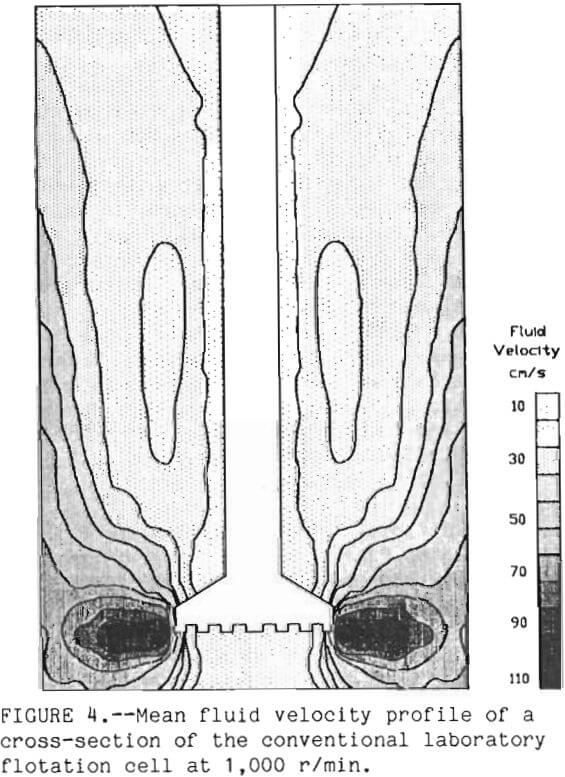
Complete velocity profiles were measured in the conventional laboratory flotation cell at 1,000 r/min and 2,400 r/min and in the fine bubble flotation cell at 2,500, 4,200, and 7,000 r/min using the electrolyte solution. In each case the magnitude of the mean fluid velocity decreased quickly as the distance from the impeller increased, as shown in figure 4. The turbulent fluctuations still showed a standard deviation around 60 pct of the mean fluid velocity. The procedure was repeated using ground chalcopyrite at 25 pct solids. The velocity measurement showed a dampening effect the velocity by a factor of 5 to 10 pct. This observation is consistent with the findings of Wieb (1988).
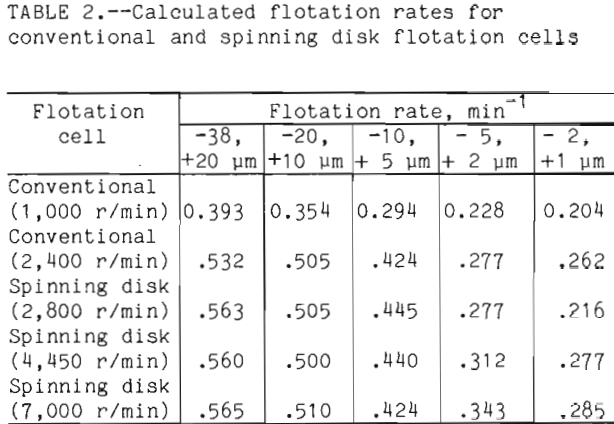
The flotation rates for the various flotation tests on chalcopyrite were calculated and shown in table 2. For every experiment with a given cell the flotation rate decreased as the particle size decreased. This is an indication of the difficulty observed by the minerals industry when flotation of fine particles is practiced. A comparison of conventional cells operating at 1,000 r/min and 2,400 r/min shows that an increase in turbulence increased the flotation rate by 35.4 pct for minus 38, plus 20 µm fraction, and 28.4 pct for the minus 2, plus 1 µm fraction. A similar comparison for the spinning disk shows that as the disk is spun at 2,800 r/min versus 7,000 r/min, the flotation rate remained the same for the minus 38, plus 20 µm and increased 32 pct for the minus 2, plus 1 µm.
To determine the reason for these observations, information on bubble size and power consumption (degree of turbulence) was required. The power consumption was measured by linking a torque meter to the impeller shaft. To account for the bearing friction, the power consumption of the impeller spinning freely in air was subtracted from the flotation pulp power measurements. Dividing the power consumption by the volume of the flotation cell produced mean dissipation energy (E). Table 3 shows the power consumption and the mean dissipation energy for the conventional and spinning disk flotation tests. The power requirements were greatest for the spinning disk cell at 7,000 r/min and the lowest for the conventional cell. The bubble size distribution for the five cells was determined and shown in table 4.

Although the air flow remained constant, it should be noted that the volume of air suspended in the cell increases from 10 pct for the conventional to 35 pct for the spinning disk at 7,000 r/min.
A summary of bubble size, power requirements, and flotation rate constant for the minus 2, plus 1 µm is given in table 5. A comparison of
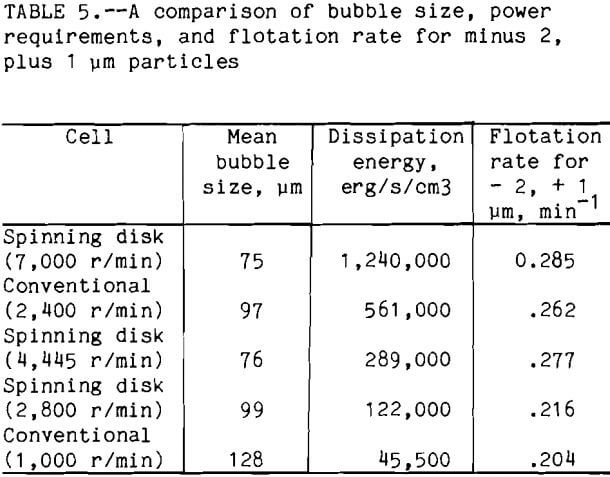
the flotation rate with the dissipation energy shows that the flotation rate increased with increased dissipation energy. This trend is followed except for the conventional at 2,400 r/min and the spinning disk at 4,445 r/min. For these two cells, if only the power requirement is compared, then the conventional at 2,400 r/min should have a higher flotation rate than the spinning disk at 4,445 r/min, but the reverse is true. This means that the power increase alone can not explain the observed flotation rate. If the bubble size is compared to the flotation rate, then the highest flotation rates are obtained where the smallest mean bubble size is used. This is observed for all 5 cells. So, the difference between flotation at 2,400 r/min and spinning disk at 4,445 r/min can be explained by considering both bubble size and power together. Both cells have the same air volume of 25 pct, but the spinning disk cell at 4,445 r/min had a smaller mean bubble size. So, for the minus 2, plus 1 µm particles, the bubble size is more important than the dissipation energy.
If the analogy just discussed is true, for cells where the bubble size is the same, the flotation rate should also increase if the dissipation energy is increased. A comparison of the conventional cell at 2,400 r/min and the cell using the spinning disk at 2,800 r/min shows that both have approximately the same mean bubble size, 97 and 99 µm respectively. But the conventional cell at 2,400 r/min has a much larger dissipation energy when compared to that of the spinning disk at 2,800 r/min. For the minus 2, plus 1 µm particle the flotation rate for the conventional cell at 2,400 r/min is greater than for that of the spinning disk at 2,800 r/min, 0.262 and 0.216 respectively. The number of bubbles must also be included in the comparison of the conventional cell at 2,400 r/min and the spinning disk cell at 2,800 r/min. For the latter, the air volume was 15 pct as compared to 25 pct for the conventional cell at 2,400 r/min. From equation 3, the number of bubbles is important in the number of collisions that occur. For the conventional cell at 2,400 r/min there are more bubbles, this may explain, along with the difference in dissipation energy, the large difference in flotation rate.
The factors of power input, bubble size, and the number of bubbles have been shown to dictate the flotation response for the minus 2, plus 1 µm particles. As the particle size increases the importance of these factors relative to each other varies. The flotation rate for all five cells increases as the particle size increases and the conventional cell at 1,000 r/min always had the lowest flotation rate for a given size particle. The other four cells produced significantly faster flotation rates than the 1,000 r/min conventional flotation cell. Among these four cells very little difference in the flotation rates was observed for the size fractions between 38 µm and 5 µm. Only the minus 5 µm size fractions showed the enhanced flotation rates with increased agitation and smaller bubble size.
Conclusions
Fine particle flotation is improved with increased agitation by increasing the collision probability of the fine particles and bubbles. Fine bubbles also improve the flotation of fine particles. At constant air flow, smaller bubble size increases the bubble concentration and the suspended air volume in the flotation cell. This results in more collisions between these bubbles and the fine particles. Increased turbulent agitation also generates fine size bubbles which unites these factors for improved flotation of fine particles.
