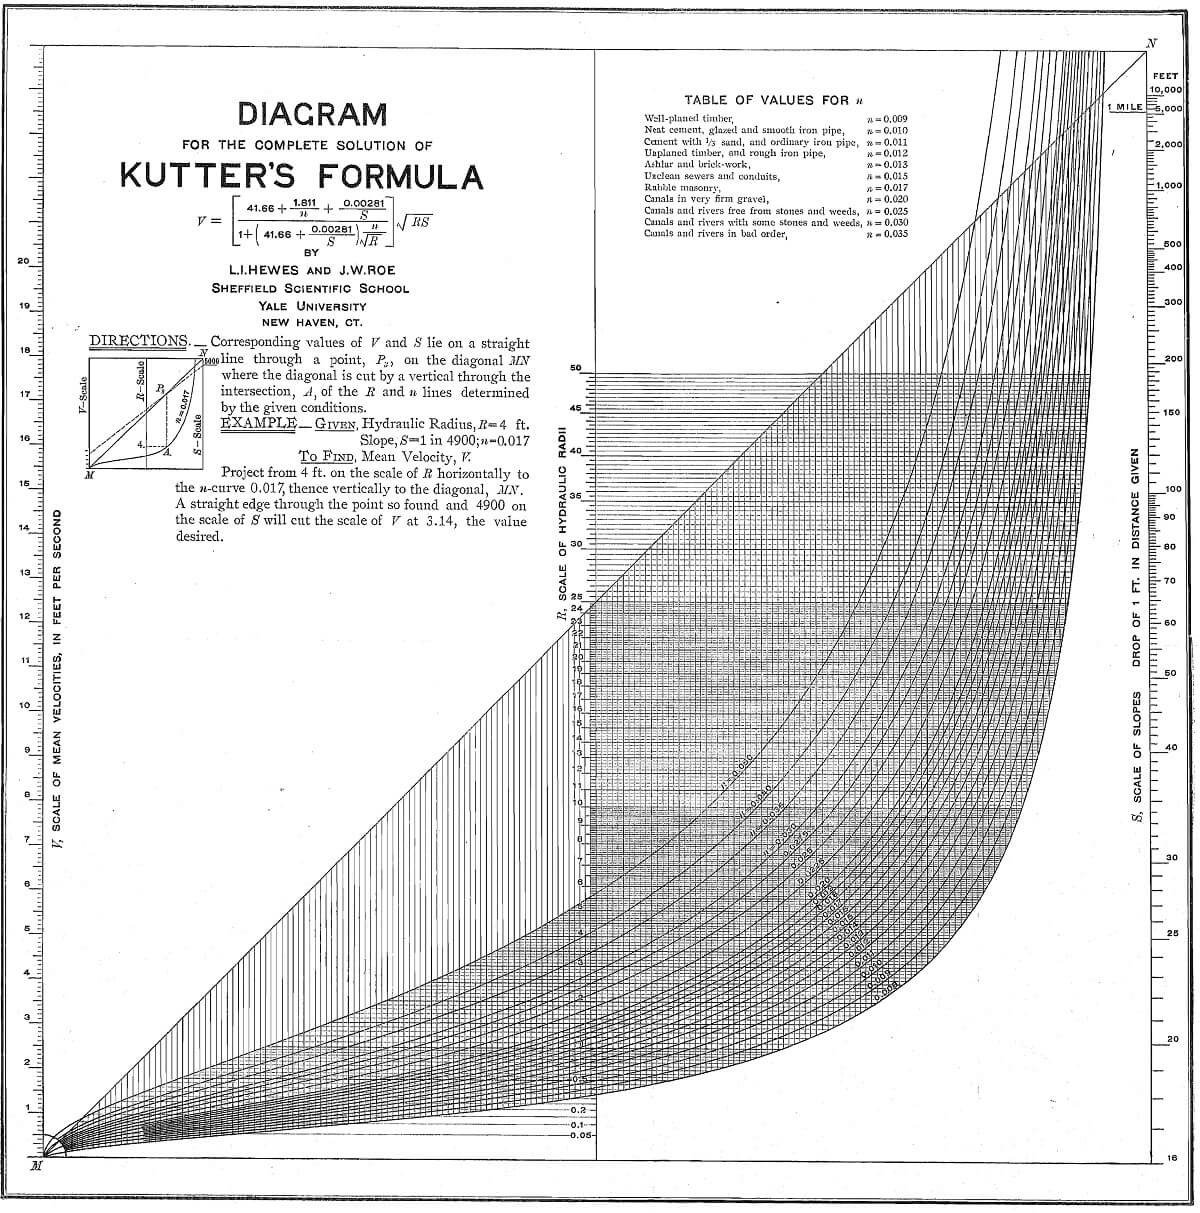
A Graphic solution of Kutter’s formula for the flow of water has been worked out by Dr. L. I. Hewes in connection with his course in Graphic Computations, given in the Sheffield Scientific School, Yale University, which may be of interest to those who deal with canals, flumes and streams is probably the most accurate of those proposed determining the flow of water. But it is extremely cumbersome, and if many calculations are to be made their solution becomes drudgery. The purpose of this chart, Fig. 1, is to furnish a rapid solution, sufficiently accurate to be well within the limits of the observed data.
The chart consists essentially of three parallel scales, one for the mean velocity, V, one for the hydraulic radius, R, and one for the slope ; a diagonal line, not graduated; and a set of curves for the various values of n, the factor which involves the nature and condition of the bottom. Usually, R and S have been determined, n assumed, and it is desired to calculate V. In this case the diagram is read as follows: From the given value of R on the middle scale project horizontally to the curve of the n-value assumed; thence project vertically to the diagonal. A straight-edge through the point on the diagonal so found and the point on the S-scale determined by the given conditions will cut the V-scale at the required mean velocity. The chart furnishes a means of determining any one of the four factors, the other three being known. This would be useful where it is desired to find a coefficient, n, corresponding to a given set of conditions, as the solution of Kutter’s formula for this factor is especially troublesome.
The range of values covers all but the most extraordinary conditions. The graduations on the V-scale range from 0 to 25, far beyond any velocity encountered in practice; the scale of hydraulic radii ranges from 0 to 50 ft.; the slopes range from 1 ft. in 16 ft. to 1 ft. in two miles; and the n-curves cover all the values given in any of the books of reference.
The accuracy of the chart is about uniform for the various conditions encountered. Where the n-curves are acute to the R-scale the scale itself is very coarse, thus compensating for any error due to the obliquity of the curves. Opposite the upper end of the R-scale, where its graduations are finer, the n-curves have turned and are nearly parallel to it, so that an error in reading the ill-scale has but little effect on the location of the pivot-point on the diagonal. Each of the curves has been checked by calculations, and the mean error of the total readings was only 0.53 per cent. The V-scale, on which the results are usually sought, with reasonable care in reading, will give results correct to within two or three units in the third significant figure, an accuracy well within that of the original data. The selection of n, for instance, is an element which introduces an uncertainty largely in excess of this.
Other graphic solutions of this formula have been worked out, but they nearly all involve a set of diagrams, one for each value of n. So far as we know, there have been none where the entire range of all factors has been included as conveniently in one diagram.


