Table of Contents
This paper presents a theory for estimating the rate of gravity drainage of a liquid out of a sand column. Account is taken of the variation in permeability to the liquid as the saturation in the upper part of the sand becomes less than 100 pct.
Differential Equations of Capillary Flow
The flow of liquids in partially saturated porous media has been studied by many investigators. Richards presented derivations of fundamental differential equations governing two-phase capillary flow; and used simplified forms of those equations in solving a steady-state problem. Muskat and Meres presented and used equations different from those of Richards. Their equations did not explicitly involve capillary pressure gradients; but included, on the other hand, terms expressing the effects of the evolution of gas from the liquid phase during flow.
Leverett stated in 1940 that “previous work on the flow of fluid mixtures in porous solids [had] failed adequately to account for all of the three influences that cause motion of the fluids: capillarity, gravity, and impressed external pressure differentials.” Leverett’s basic equations, however, were specialized forms of the general equations of Richards, which had actually taken account of the three influences mentioned by Leverett, but had not been used in a problem involving all three.

Theory
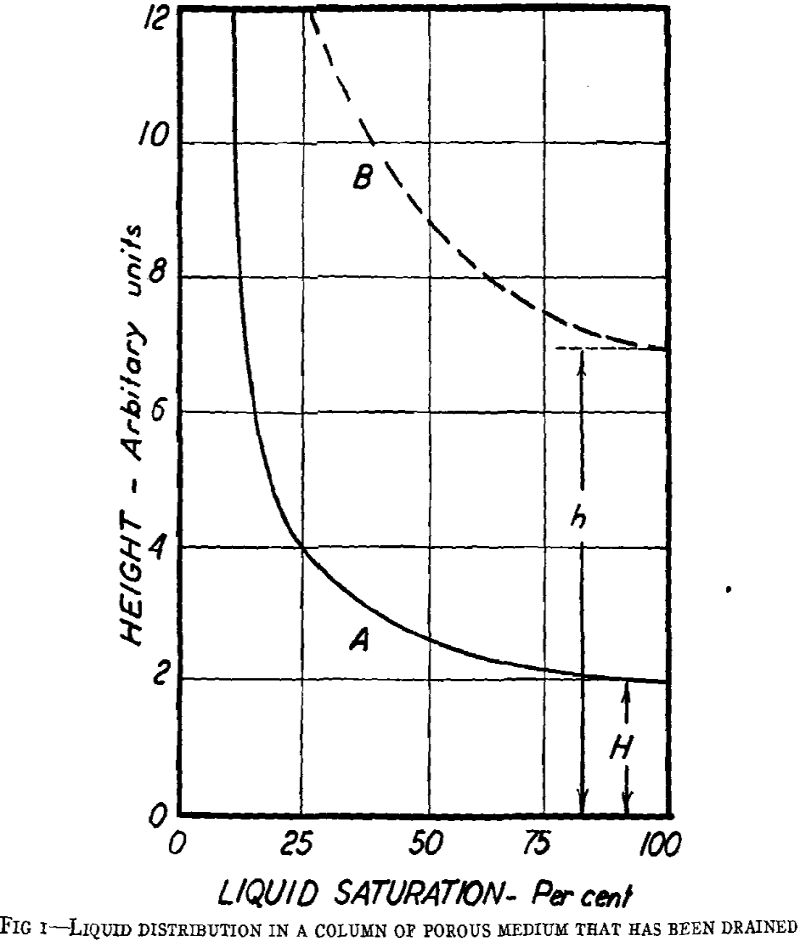
Curve A, represents the type of liquid distribution that results when a vertical column of porous medium, open at the top and bottom, is saturated with liquid and then allowed to drain. At the lower end of the column there is a region of 100 pct saturation, analogous to the region of 100 pct saturation in a vertical glass capillary that has been filled with liquid and then allowed to drain. Above the 100 pct region is a transitional region of gradually decreasing saturation, which has no analogue in simple tubular drainage. Above this transitional region the saturation decrease per unit height becomes so small that finally there is a region of practically constant saturation.
The distribution represented by curve B must approach that of curve A through the relative motion of parts of the liquid body; and there are two fundamental laws that this motion must obey. In the first place, it must obey Darcy’s law, which for present purposes may be expressed as follows:

where:
v = the macroscopic fluid velocity in the 2-direction (downward).
k = the permeability of the medium to the fluid (a function of the fluid saturation).
H = the viscosity of the fluid,
p = the density of the fluid.
g = the acceleration of gravity.
p = the pressure in the fluid.
Eq 1 has several implicit complications when applied to the present problem. The permeability, k, is a variable that depends on the fluid saturation, decreasing as the saturation decreases. The variation of this quantity is not, however, an unfamiliar one. The more confusing quantity in the present problem is the pressure, p, which seems to have two different types of variation, one in the partially saturated region of the column, and another in the 100 pct saturated region.
In the partially saturated region (above 7 units on curve B of Fig 1) the fluid pressure is a function of the saturation, decreasing as the saturation decreases. If the part of pore spaces not filled by liquid is considered filled with gas having a negligible vertical pressure gradient, the pressure gradient in the liquid is a function of the saturation gradient only. This is in accordance with familiar laws of capillary behavior.
In the 100 pct saturated region, there is, by definition, no saturation gradient, and, therefore, no pressure gradient because of that factor. Neither is there any externally applied pressure gradient, for if the column is open at the top and the bottom, and the gas surrounding the column has a negligible vertical pressure gradient, the externally applied pressure must be the same at the top and bottom of the column. In spite of these considerations, however, we know that there must be a pressure gradient in the 100 pct saturated region. This must be true because if it were not there could be no retention of that region after equilibrium had been reached. The pressure gradient in the completely saturated region of the equilibrium distribution must be calculable from Eq 1, by setting the velocity equal to zero:

Laboratory determinations of capillary pressures at low saturations are of doubtful meaning because of the predominating effect of low permeabilities. Leverett, for instance, has said that “the nearly vertical trend of the drainage data [the height-saturation relationship] at low water saturations represents a relatively poor approach to equilibrium, caused by the low permeability to water in this region.”
Calculations
Assume, for simplicity, that a vertical column of unconsolidated sand is initially completely saturated with water, and then allowed to drain, both the top and the bottom of the column being open to the atmosphere.
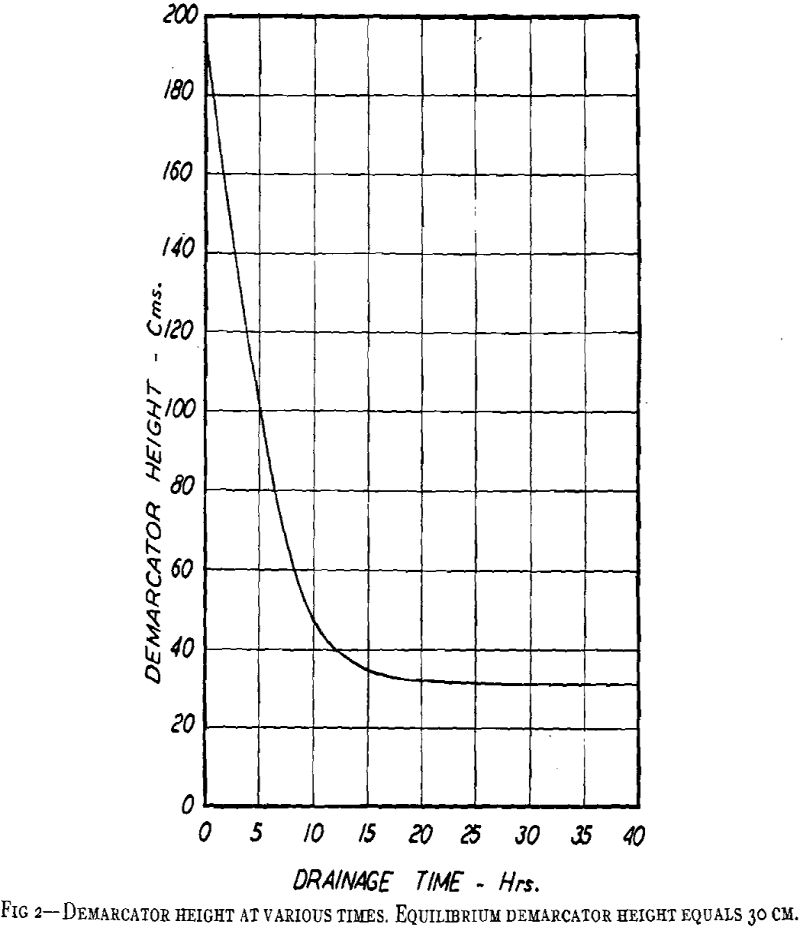
Although it has no direct bearing on subsequent calculations, it is interesting to note that the saturation calculated as indicated above is the saturation for which the downward velocity of the demarcator is a maximum.
If the downward velocity of the demarcator is maximized, it follows that the initial rate of drainage is also maximized. The instantaneous adjustment of the saturation at the top of the column, in order that this may occur, seems analogous to the familiar process in which water running down a hill chooses the steepest path.


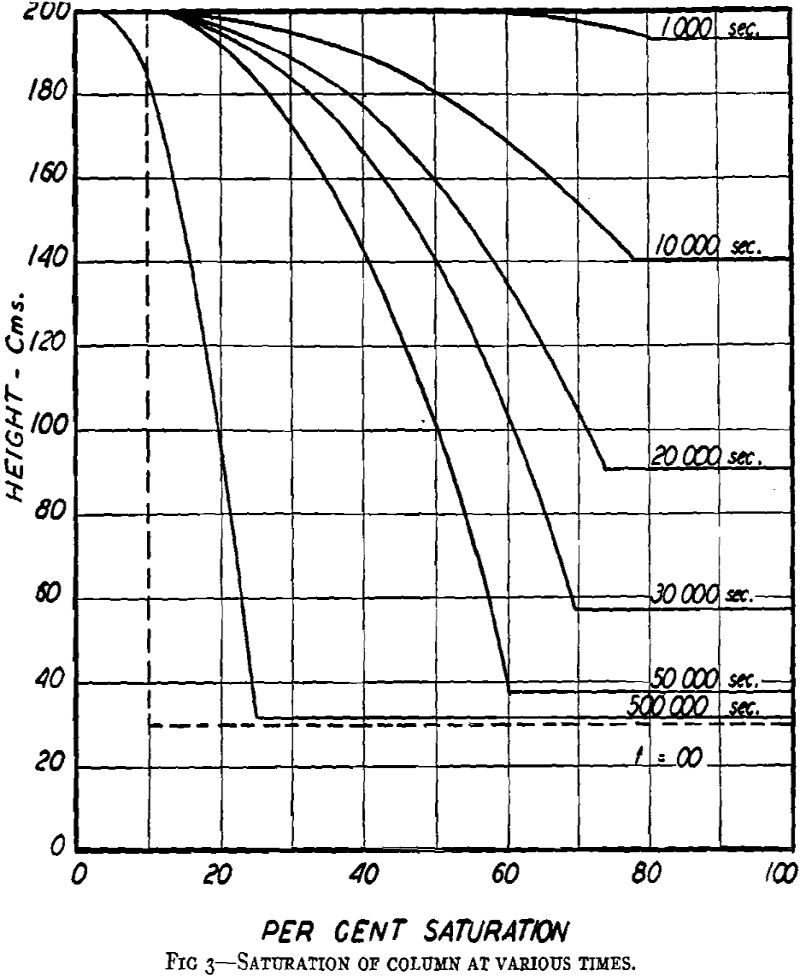
It seems appropriate to discuss Fig 3 thoroughly, for the reason that its curves are different from those usually seen describing saturation distributions. The usual curves are of the general shape shown in Fig 1. The different shape shown in Fig 3 is due to the neglect of capillary pressure gradients arising from gradients in the saturation, as discussed previously. The shape in Fig 3 arises purely from the retardation of flow by diminished permeabilities due to diminished saturations. Although it is convex where it may seem that it should be concave, and its demarcator branch is impossibly horizontal, its general placement is essentially correct.
A Check on the Theory
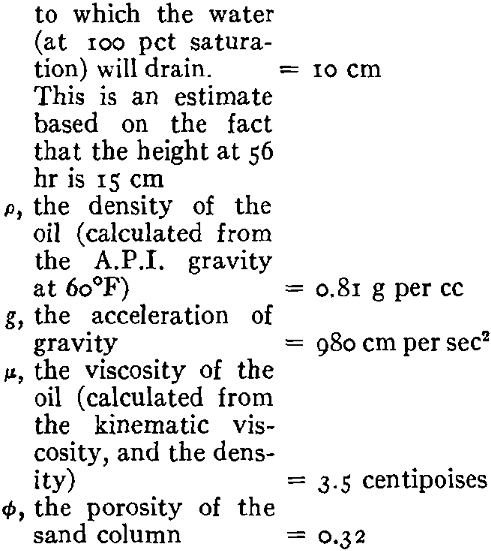
The data of Stahl, Martin, and Huntington are the most suitable data in the literature with which to check the theory. We know of no other published drainage data obtained under such well-controlled conditions. For present purposes the data of Stahl and coworkers for Wilcox crude at 130°F are complete. The physical constants of this system are as follows:


Discussion of Results
The simple theory given in the preceding pages accounts for the variation of permeability in the unsaturated region at the top of a draining column. It does not account for capillary pressure gradients in this region. However, for unconsolidated sands having permeabilities of the order of a darcy, this does not seem to be necessary. It may be concluded, therefore, that for all oil-bearing formations whose permeabilities are high enough to make gravity drainage important, the simple theory is adequate.
In order to make predictions of oil-field recoveries it will be necessary to modify the simple theory in many ways. Oil fields must usually be represented as only slightly inclined columns, rather than vertical columns. Account must also be taken of the convergence of flow into the draining wells. The effects of these factors may be approximated by known methods.

