Table of Contents
Industrial precipitators utilizing negative corona operate at maximum voltage to attain highest efficiency in removing finely divided particles from gas streams. Usage, however, is limited to applications at temperatures to about 1,000° F. Therefore, in conjunction with other work for processing coal at high temperatures, the Bureau of Mines sought to extend the applicability of precipitators for cleaning ash-laden combustion gases to operation at much higher temperatures.
Earlier work with a bench-scale precipitator demonstrated that ash can be removed effectively from air at temperatures up to 1,200° F and pressures to 80 psig using negative corona,3 These tests, which showed upwards of 98 percent removal efficiency, were of short duration because the bench-scale unit was not equipped with a collecting tube rapping mechanism. Further investigation of current-voltage relationships for negative corona in bench- scale equipment, using relatively clean air in a dynamic system at temperatures to 1,500° F, show that the electrical field deteriorates at high temperature and 0.25 relative density. The voltage difference between corona onset and sparkover the operating range decreases with increasing temperature, and approaches zero at 1,500° F and atmospheric pressure. However, if sufficient pressure is supplied to increase the relative density to at least 1.25, the electrical characteristics appear favorable to clean the gas at 1,500° F.
Results of the latter study demonstrate that effective mobility of the current carriers (negative ions) is a function of temperature, over and above the effect of temperature on gas density. These results agree with other findings and are interpreted to signify that thermal stress in addition to electrical stress causes instability in the negative ions. The ions shed their electrons, which causes the space charge to be dissipated, and a power arc (sparkover) occurs.
Conversely, tests with positive corona using clean air over the same temperature and density ranges show the current carriers (positive ions) are much more stable under the combined electrical and thermal stress positive ions are not subject to the dual role of temperature. Thus, at high temperature and a given density, higher voltage can be utilized with positive corona before sparkover occurs. Positive corona is therefore indicated as preferable to attain highest efficiency in the removal of solids from gases at high temperature.
Based on results of the bench-scale tests, a pilot-scale, semicommercial high-temperature precipitator was designed, fabricated, and operated. This report presents results of tests with the pilot-scale unit.
Equipment
Equipment used in this investigation, shown schematically in figure 1, consisted of a natural gas-air combustor, ash feeder, gas flow control valve, electrostatic precipitator, sampler for ash-laden gas, and dual pressure-control valves.
The combustor was a modified version of an atmospheric unit, the pressure shell comprising the prime alteration to the original design. The flow of primary and secondary air into the unit is directed radially to cool and protect the shell of the entire unit; combustion is controlled in the central zone. The unit is equipped with a single orifice and an electronic flame detector. If the flame is forced outside the detectable zone, the control device automatically shuts off flow of natural gas to the combustor. For example, at low gas rate and high pressure the flame is compressed so that it does not reach the control point. Conversely, at high gas rate and low pressure the flame is blown too far downstream, and ignition does not occur at the control point. Therefore, operating conditions were limited to the range 600° to 1,500° F and 35 to 80 psig.
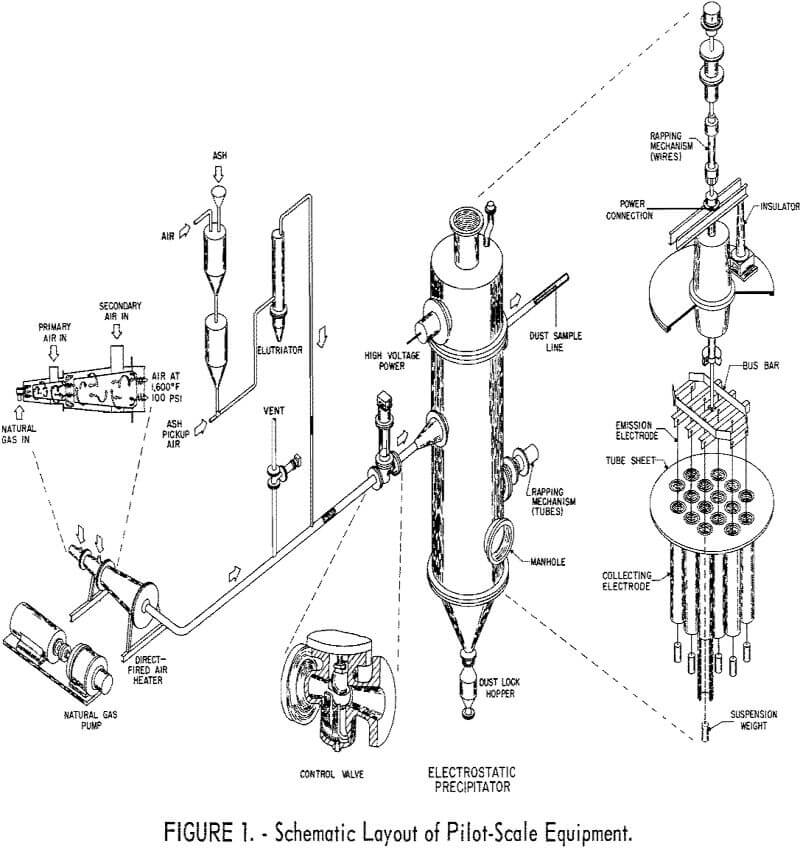
The precipitator, designed and fabricated under contract with Research- Cottrell, Inc. is a 5-foot-diameter by 30-foot-high carbon steel shell that is lined with 9 inches of Plibrico insulating cement to prevent heat loss. All internal metal parts, including the emission electrodes and weights, collecting pipes, tube sheet, bus bar, and collecting electrode rapping mechanism, are made of type 310 stainless steel. Gas inlet and outlet piping is type 316 stainless steel, and the internal structure of the precipitator consists of 16 collecting electrodes (pipes), 6 inches ID by 6 feet long, mounted vertically in a horizontal tube sheet and provided with concentric emission electrodes (wires). The tube sheet is equipped with four radial expansion slots 90° apart, and it rests on a retaining collar equipped with studs which fitted into the slots. (As received, however, position of slots and studs did not coincide, so some enlargement of the slots was required to allow installation of the equipment.) Provision was made to add 3-foot extensions to the pipes (and wires) to increase the length of the precipitating field. A metal liner, also made of type 310 stainless steel, is located in the bottom of the precipitator to facilitate removal of dust which is shaken from the collecting tubes during the rapping operation. The smooth surface of the liner eliminates the tendency for dust to hang or bridge in the bottom of the precipitator. Wire utilized as emission electrodes is 0.083 inch in diameter.
The precipitator is designed to process 1,000 scfm of combustion products plus excess air at 1,500° F and 80 psig. These products enter the shell under the tube sheet, flow down on the outside of the pipes, then up through the pipes and out the exit port. Gas velocity through the pipes normally is 3 fps, but higher velocities may be attained by blocking individual pipes at the gas entry.
The high voltage (HV) power supply is a full-wave bridge rectifier operating through a step-up transformer from input line voltages up to 400 volts and currents to 40 amperes. It is capable of delivering 45 kv unfiltered pulsating dc voltage with 70 kv peak and 250 ma dc current. Voltage output is controlled by a variable motor-driven autotransformer. Current is limited by means of surge resistors in the primary circuit of the HV transformer. A saturable reactor in the primary provides additional current regulation and control. The polarity of the output is altered by changing the internal connections of the rectifier, and thus it allows study of both positive and negative coronas.
An X-Y plotter simultaneously records precipitator HV dc on one axis and average current on the other axis. Input to the voltage axis is obtained from two cascaded voltage dividers. Current axis input is developed across a precision resistor and converted from a linear to a logarithmic voltage. The full scale ranges of the X-Y recorder are 0 to 62 kv dc and 100 ma to 400 ma dc logarithmic. To obtain an X-Y plot of the precipitator voltage-current characteristics, the input voltage to the primary winding of the HV trans¬former is run up at an essentially constant rate of 9.5 v per sec with the motor-driven autotransformer mentioned above. Other electrical instrumentation includes HV peak and rms indicating voltmeters, a linear multirange mameter to indicate average precipitator current, and an ac voltmeter and ammeter on the primary side of the HV transformer.
Procedure
In addition to the pressure control valve the vent line upstream of the precipitator is equipped with a rupture disk (fig. 1). At the start of operations the flow control valve is closed, and all products are exhausted through the vent line. After desired temperature-pressure relationships are established at ε specified product gas rate, flow is directed through the precipitator by manipulating the flow and pressure control valves. Pressure in the precipitator is controlled by a second valve, identical to that utilized in the vent line. When temperature reaches equilibrium in the precipitator, the system is ready for determining current-voltage characteristics or dust-removal efficiency. This mode of operation eases the problem of adjusting flow of gas and air to the combustor at desired flow conditions of temperature, pressure, and volume in the gaseous products.
Powerplant fly ash screened through 60 mesh was used to produce the dust-laden process gas. The particles were fed to the system at process pressure by a Thermal Arc solids feeder.
A Stairmand disk is utilized in the precipitator outlet duct to disperse the solids uniformly throughout the effluent gas at the sampling point. Representative samples of dust-laden effluent withdrawn from the duct by iso-kinetic procedures were filtered to remove the solids, and the dust concentration was calculated. Dust concentration in the inlet stream was calculated from the weight of ash fed. Removal efficiency of the precipitator was calculated using the following equation:
(Inlet concentration – Outlet concentration) x 100/Inlet concentration
During some of the tests for determining removal efficiency, an automatic rapper was utilized to remove ash from the collecting pipes. The rapper operated in a sequence of one second on and 49 seconds off.
Operations
After the precipitator had been brought to design conditions, precipitator checkout showed that thermal expansion caused the tube sheet to twist in the horizontal plane with one stud appearing to act as an anchor. This twisting action resulted in a 2¼-inch off-center spacing, as determined by test blocks placed on the tube sheet and by actual measurement of wire-tube spacing. Apparently the twisting action was possible because of the enlarged slots in the tube sheet.
After electrical checkout the tube sheet was restored to its original position, and current-voltage characteristics were determined at various temperatures and pressures. Analysis of these electrical characteristics showed that the tube sheet’s thermal expansion was a problem only when gas temperature exceeded 1,350° F. Repeated measurements revealed that the reduced wire-tube spacing at higher temperature was almost identical each time.
Prior to the test series on dust removal efficiency the tube sheet was restored to its original position. After the tests, inspection again showed movement had occurred. Therefore, data on electrical characteristics at 1,450° F and the results of the efficiency tests must be considered on the basis of a 2¼-inch spacing between the electrodes.
Combustor effectiveness diminished gradually during the experimental program, so adequate flame control was possible only at reduced gas and air flow rates. Therefore, during the dust removal efficiency tests, half of the tubes were capped at the lower end. With this limitation the flow capacity from the combustor (34,000 scfh) was sufficient to provide gas velocity of 3.5 fps in the remaining eight tubes. Under these conditions low heat input to the precipitator made 1,470° F the maximum temperature that could be attained. Temperature in the precipitator was determined as the average between thermocouples located at the entry and exit ports to the equipment.
Additional tests on removal efficiency showed that maximum applicable voltage continually decreased with a concomitant decrease in efficiency. Inspection showed that continuous operation of the tube rapper had caused the yoke (which connects to all tubes) to ride upward on the tubes principally at a radial angle of 120° from the connection to the rapper. This angular position apparently caused misalinement in the connection, and excess stress then caused a radial shift of the yoke. The yoke was frozen to the tubes in the new position. The combined action caused gross misalinement of the wires and tubes, so the unit was shut down.
Results
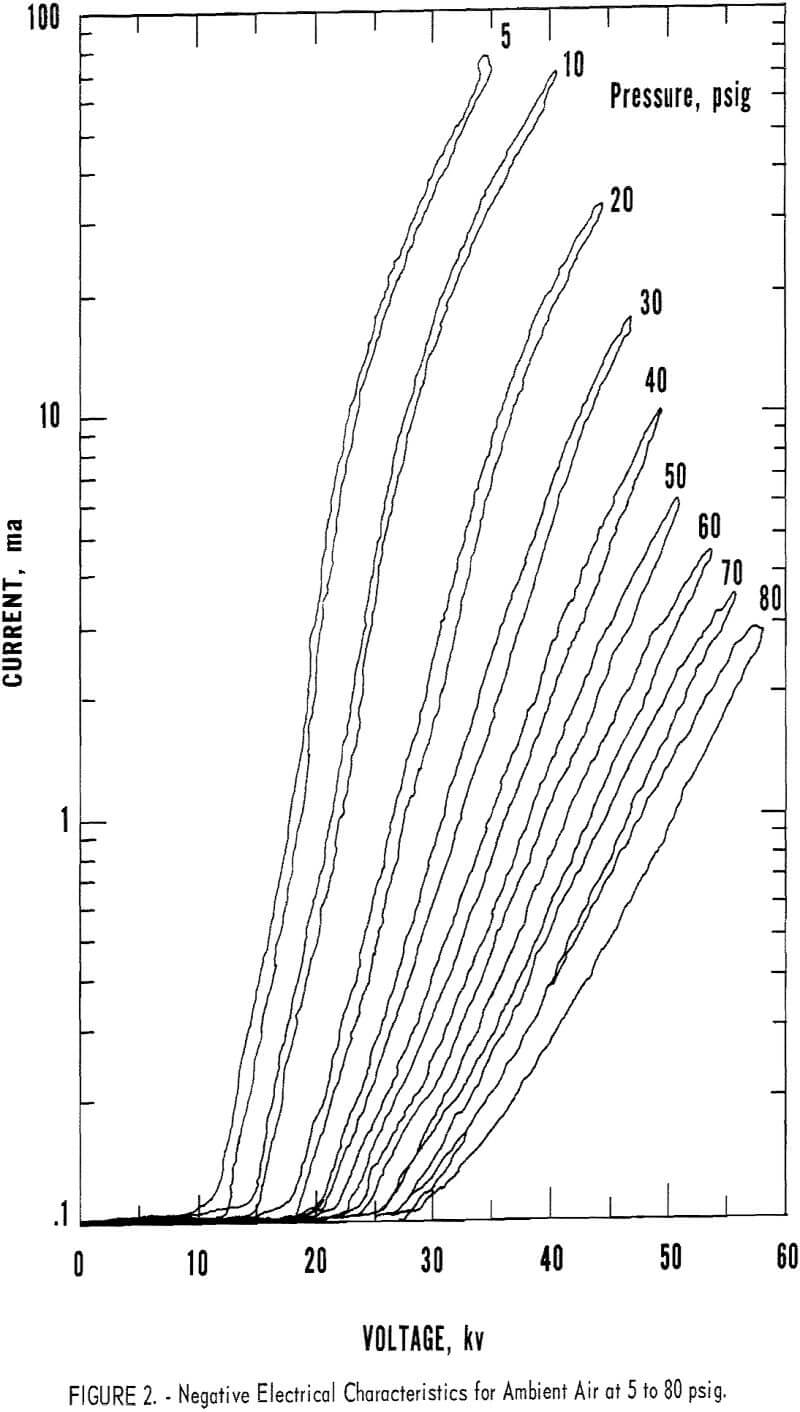
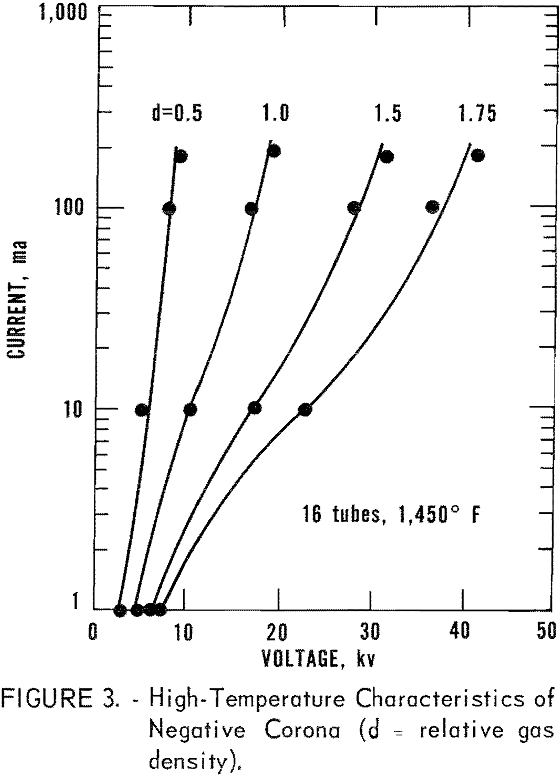
Current-voltage characteristics of the negative corona were determined at ambient temperature and pressures over the range 0 to 80 psig to establish a datum line for the precipitator and the voltage divider. Characteristics of negative polarity were determined also at various levels of temperature and pressure from 600° to 1,500° F and 35 to 80 psig. Relationships at ambient temperature are given in figure 2. Typical relationships at high temperature are shown in figure 3 for data obtained at 1,450° F over the range 40 to 80 psig while using all 16 tubes in the precipitator. These characteristics were determined before any ash was fed into the precipitator the wires and collecting pipes were free of ash deposits.
Figure 4 compares data for both coronas at 900° F. These relationships were determined after the solids feeder had been calibrated. Therefore, ash
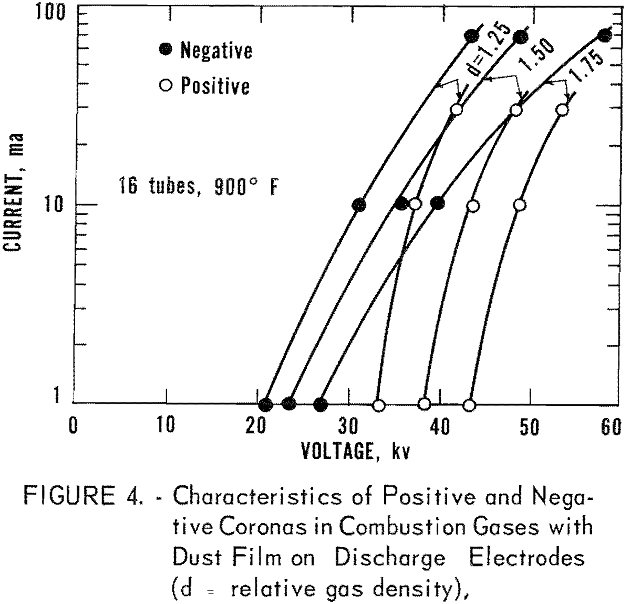
deposits were present on both electrodes at the time of these tests, but no ash was added during the tests.
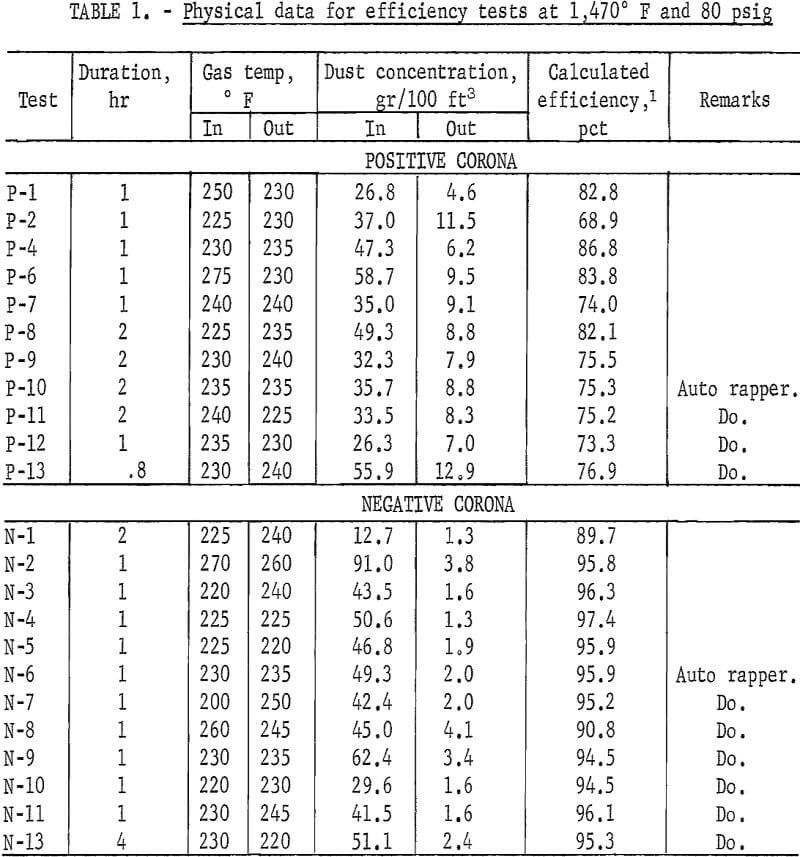
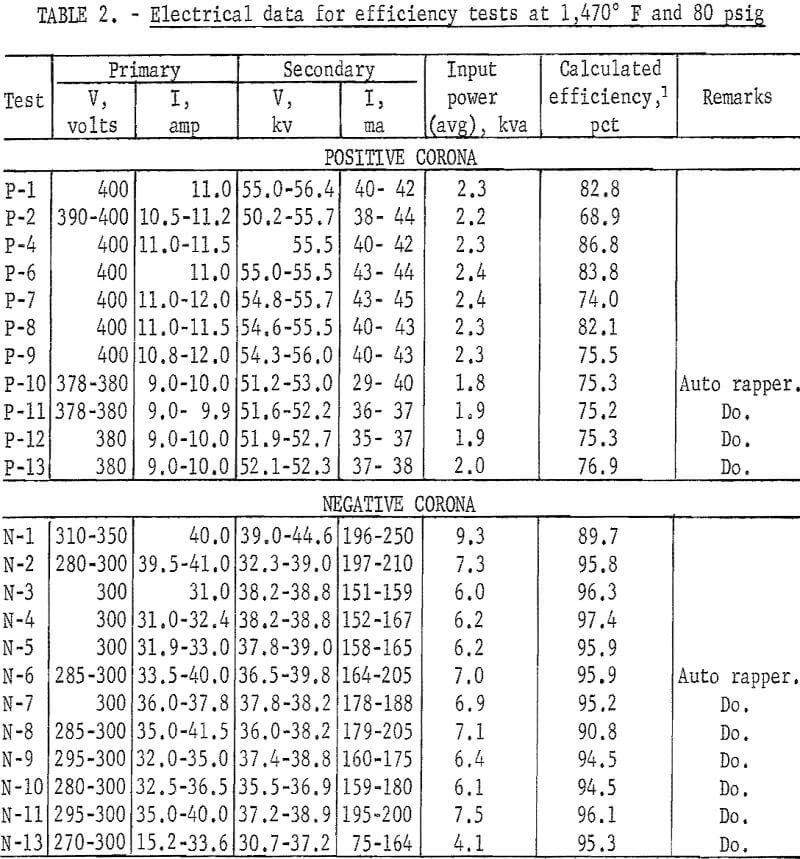
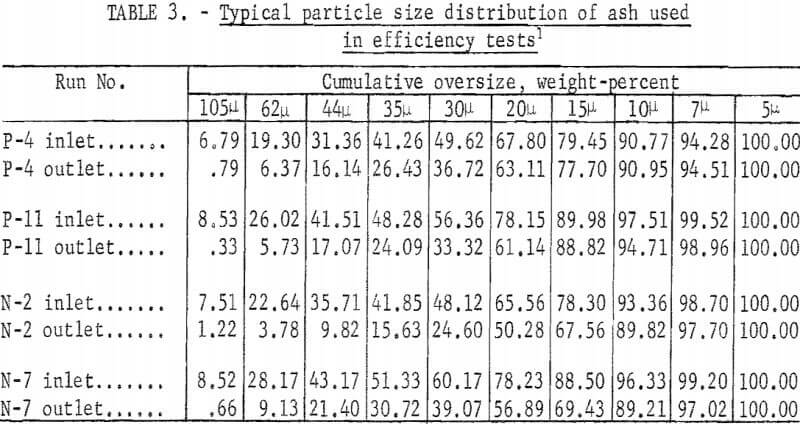
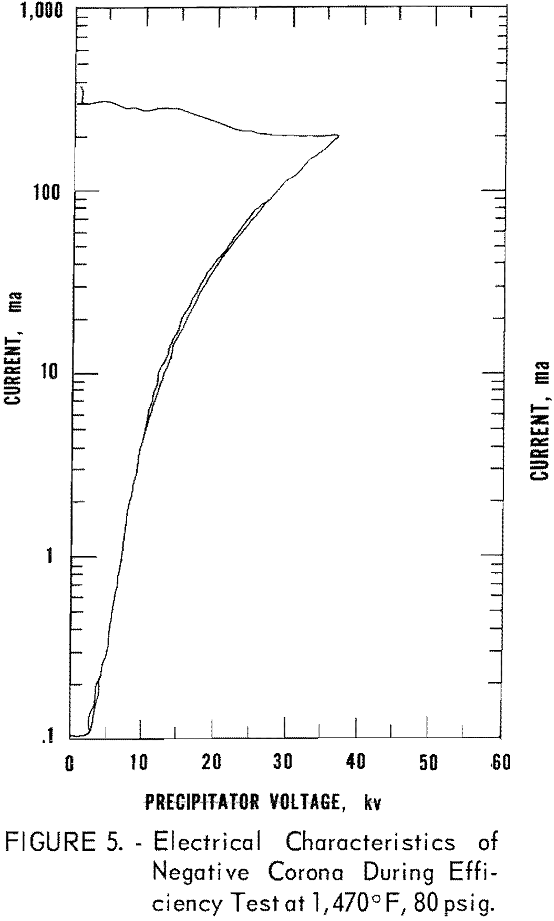
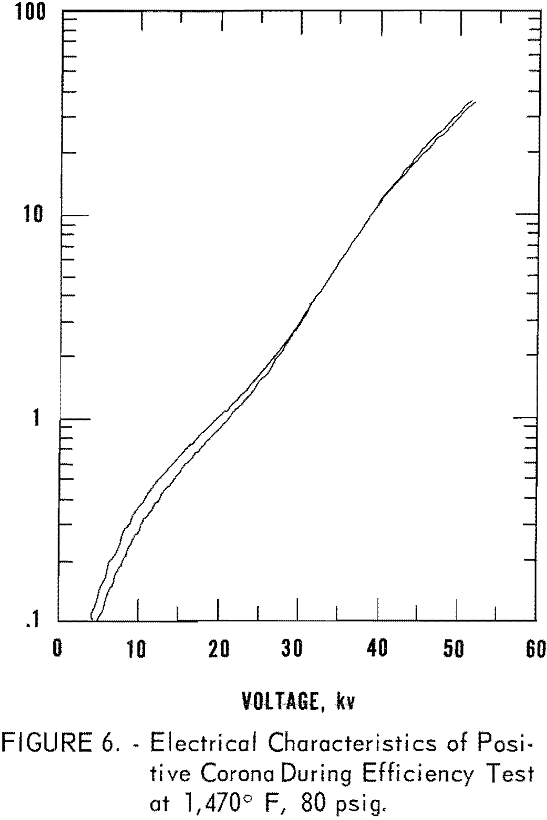
Results of efficiency-tests at 1,470° F and 80 psig for both positive and negative polarity are summarized in tables 1 and 2. Table 1 lists physical data for these tests in which the sampled gas was cooled to the temperatures shown to prevent searing of the extraction thimbles used in the samplers; table 2 lists electrical data. Particle size distribution of the dust for selected tests in the series are given in table 3. Typical current-voltage relationships of the solids-bearing combustion gases are shown in figure 5 for negative corona and figure 6 for positive corona.
Discussion
The current-voltage characteristics given in figure 2 show that corona onset voltages, Vo are related as anticipated from the Peek equation,
Vo = (30 ad + 9√ad) ln b/a……………………………………………………………..(1)
where a is wire radius, b is pipe radius, and d is relative gas (air) density (at 77° F, 14.7 psia , d=1). Thus, as pressure increases, gas density also increases, and higher voltage is required to produce corona. Moreover, at the higher densities more energy is required to maintain a constant rate of flow of ions through a more compact mass of molecules between electrodes, because of reduced mean free path and reduced time to accelerate electrons to ionization potential. Therefore, as density increases, relatively higher voltage is required to produce a given flow of current.
Curves given in figure 3 relate directly to the high-temperature characteristics found previously for negative corona in bench-scale equipment at similar gas conditions. At voltages required to produce current levels from corona onset (0.1 ma) up to about 10 ma, the curves maintain a parabolic contour as predictable from existing theory. At higher voltage however, the curves pass through a transition point wherein further small increases in voltage result in rapid increases in current flow, especially at potentials just below the breakdown value of the gas.
Previous work has shown that the transition occurs because of a change in the electronic control mechanism at field strength-to-pressure ratios above that required to reach the transition point, electrical stress in the current carriers (presumably 0- ions) is sufficiently high to cause instability in the carriers. At these high ratios the negative ions shed their electrons and cause a shift in the equilibrium of attachment and detachment from those attached most of the time to those free most of the time. High temperature is also a factor in the shedding process. Therefore, any means for effecting an increase in the mean energy of the negative ions (electrical and/or thermal effects) will cause instability in the ions and will result in a rapid increase in the apparent mobility of the carriers and the flow of current. This factor could be the source of free-electron current in a precipitator as described by White, although at development, White’s theory involved time delay prior to attachment rather than time spent after detachment. Thus, high-temperature electrical characteristics for negative corona in a bundle of 6-inch tubes in the pilot-scale equipment are shown to parallel those found (1) at similar conditions in a nominal 2-inch tube in a bench-scale unit and (2) at low to intermediate temperature and high voltage in an industrial precipitator.
Further analysis of figure 3 shows that the current-voltage curves approach a vertical line at maximum voltage, especially the curve for 0.5 relative density. Thus, a small increase in voltage above that shown for current flow at 100 ma will result in further instability of the negative ions, further increase in current flow, and finally a power arc (sparkover). At the higher densities, slightly larger voltage increases appear tolerable prior to breakdown. The highest voltages shown at each density, however, approach the maximum that can be applied.
Figure 4 gives the characteristics of positive and negative coronas at 900° F for three different densities. Each curve is defined by three points, but in every case actual corona onset values (0.1 ma) were somewhat erratic. Maximum current values correspond to maximum applied voltage in the primary circuit.
For negative corona at d=1.25, where d is relative gas density, only about 350 volts could be utilized in the primary circuit prior to arcing; at higher densities the maximum value increased to 400 volts (maximum available). At d = 2.0, however, application of maximum available voltage resulted in a current rate of only about one-half the value obtained at lower density. This reduction in current is indicative that even higher voltage may be utilized when d ≥ 2.0.
By contrast, only 300 volts could be utilized before arcing occurred in the positive corona at the lower densities. At higher density, up to 350 volts could be applied in the primary circuit, but current flow decreased markedly until, at d > 2.0, maximum current was only about 10 percent of the highest value obtained at the lower densities, even though maximum voltage (400 volts) was used in the primary circuit. Again, as in the negative corona, potential utilization of higher voltage at higher density is indicated.
White describes metamorphosis as an inherent property of positive corona in dust-laden gases at ambient temperature which causes the corona to be spasmodic and undesirable for precipitation of solids from gases. Localized flares develop to cause sporadic and premature sparking when the emission electrodes (wires) are not dust-free. This instability does not occur in the negative corona, and its absence allows application of higher voltage prior to sparking when the wires are not clean. For this reason negative polarity is used in all industrial precipitators.
Cooperman’s investigation of the relative characteristics of positive and negative polarity using room air in concentric cylindrical electrodes shows that “sparking voltages in each mode of operation are extremely sensitive to the presence of dust on the anode but much less sensitive to the dust on the cathode. Moreover, using selected electrode geometry this work shows that with dust on both electrodes sparkover voltage for positive polarity may be higher than that attainable with negative polarity. Also, Sproull shows that sparking voltage with positive corona in an industrial precipitator reaches the same value as that obtained with negative corona at 600° F. Therefore, through use of selected electrode geometry and/or operation at high temperature, positive corona may be superior to negative in the removal of entrained solids from process gases.
Previous data for clean air in a 2-inch tube show a higher sparking voltage for positive corona than that which can be impressed with negative potential at atmospheric pressure and temperatures greater than 375° F. In spite of this fact, the data in figure 4 indicate that the erratic nature of the electronic mechanisms with dirty wires in the positive corona still exists at 900° F. This is evidenced by the fact that sparking in the positive corona occurs at voltages below those which produce sparking in the negative corona at the densities tested.
Before considering the summary of removal e£efficiency data (tables 1 and 2), a brief review of precipitator theory is advisable. Theory states that removal efficiency, η, can be calculated using the equation,
![]()
where A is area of the collecting electrodes, is gas flow rate, and w is particle migration velocity. The latter term is evaluated by substituting electrostatic units into the relationship,

where K is a constant, a1 is particle radius, Ec is the charging field, Ep is the precipitating field, and µ1 is gas viscosity. In a single-stage precipitator which utilizes a single source of power in each section, Ec is proportional to Ep. Since the field strength is also proportional to the applied voltage, particle migration velocity is proportional to the square of the applied voltage. Consequently, industrial, precipitators are operated at the highest possible voltage to provide highest particle migration velocity, which in turn provides highest removal efficiency.
Analysis of the data in tables 1 and 2 discloses that for tests with automatic rapping removal efficiency in the negative corona ranged from about 91 to 96 percent, while that attainable with the positive corona was much lower, from about 75 to 77 percent, despite the fact that precipitator voltage was almost 50 percent higher in the positive corona. White states, “In all cases the very rapid increase of both corona current and corona power with peak voltage is evident. For example, a 1 percent change in peak voltage produces approximately a 5 percent change in corona power, which is a result that emphasizes the importance of even relatively small changes in peak operating voltages on precipitators.” This reference deals with application of negative polarity in a precipitator, and the obvious irregularity for higher voltage in the positive corona providing lower efficiency must be considered from another aspect.
This apparent anomaly is explainable on the basis of corona power. As indicated in table 1, for these later tests input power in the positive corona was less than 2.0 kva as compared with about 6.4 kva in the negative corona. Thus, high voltage alone does not suffice to provide high efficiency in a precipitator. More effective removal for the negative corona can be reasoned on the basis of greater power consumption. This controlling feature was demonstrated for negative corona in an experimental precipitator by Lagarias.
In this latter work which was conducted in a bench-scale unit (in which a film of water was maintained on the collecting electrode) precipitator efficiency was 93.5 percent at a power input of 10 watt-seconds per cubic foot of gas, and efficiency increased to 99 percent when power input was increased to 25 watt-seconds per cubic foot of gas treated. Corresponding data for an industrial precipitator in a cement plant showed 76 percent efficiency at 5.8 watt-seconds of power; when power input was increased to 25 watt-seconds per cubic foot of gas, efficiency increased to 96.6 percent.
The beneficial aspects of current (as a function of power) which are not accounted for in equation 3 appear to be threefoId: (1) The rain of ions keeps the collected particles adhering to the walls of the collecting electrode and tends to suppress reentrainment, (2) high current somewhat insures saturated charging of the particles, and (3) velocity of the electric wind (which is created by the corona) is proportional to the square root of the current. This wind is very likely beneficial to the precipitation process.
Furthermore, this characteristic of negative corona power in a precipitator applies only when the number of available ions (for charging particles) is well in excess of the number required to completely charge all the particles that are suspended in the gas under treatment. Under these conditions the excess ions register as flow of current, and the quantity of current is directly proportional to some power of the applied voltage. Thus, corona power normally increases very rapidly with increasing potential.
In the absence of excess ions current is reduced to about 1 percent (or less) of the normal rate, and a phenomenon known as corona quenching exists in the precipitator. When this occurs, corona power approaches zero; the resultant effect is a severe reduction in removal, efficiency. At some intermediate point between the limits described for flow of current, precipitator efficiency will be reduced proportionately because of reduction in corona power. Referring back to the example cited from table 2, the low value of input power for the positive corona at high voltage is the apparent cause for reduced efficiency.
Further analysis of the data listed in table 2 discloses that the positive corona is limited by available voltage in the primary circuit of the power supply (400 volts), while the negative corona is controlled by available current in the power supply (40 amp). Precipitator operating voltage for negative corona at the listed conditions of 1,470° F and 80 psig (d = 1.75) is very close to the sparkover value as demonstrated by the high rate of current flow. This means that the power supply is adequate for the negative corona in the 6-inch tubes at the conditions cited, and this adequacy is demonstrated by the data recorded during one of the tests (test N-2) and presented in figure 5. The ragged line at the top of the figure results from a continuous arc (sparkover), at which time voltage to the precipitator decreased to zero with a concomitant surge in current flow. Maximum voltage prior to sparkover in the negative corona was 36.5 kv which produced current flow at 200 ma; corona power was 7.3 kva at the instant sparkover occurred.
Expressed in other terms, input power was 12.9 watt-seconds per cubic foot of gas, which provided an efficiency of 95.8 percent in the test described. Thus, power input-removal efficiency relationships in this experimental precipitator at 1,470° F compare favorably with those found at temperatures slightly above ambient in an industrial precipitator.
Figure 6 shows typical current-voltage relationships in the positive corona during the previously described efficiency tests. The highest value of voltage shown is 54 kv (avg) at 37 ma using maximum available voltage (400 volts) in the primary circuit. Since sparking did not occur, it is logical to assume that higher voltage could be utilized on the system for the density (d = 1.75) at which these tests were conducted. Power input at the time of this particular test was essentially 2.0 kva.
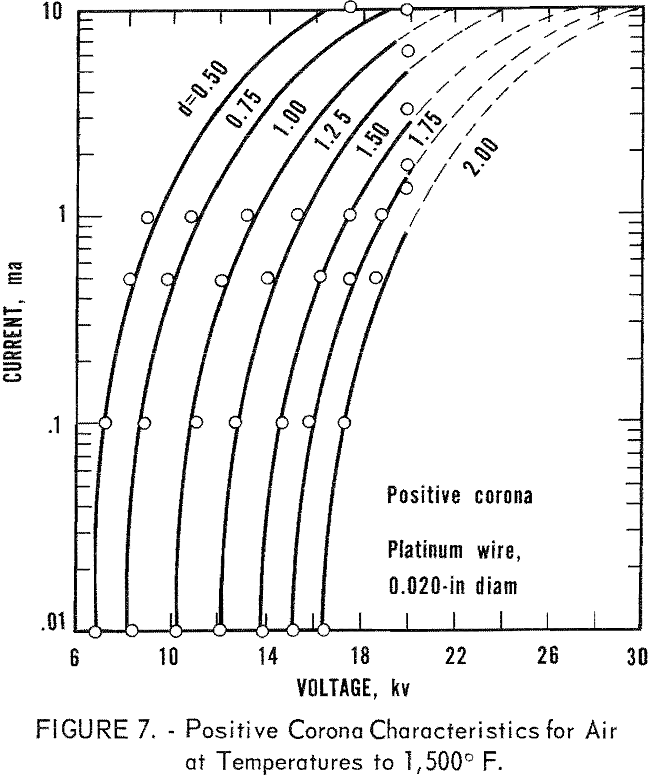
In the previous bench-scale study on positive corona, sparkover could be attained only at relative density up to 0.5 (17.6 kv avg) with a current flow of 10 ma because of voltage limitation in the power supply utilized (20 kv avg). Since the current-voltage relationships for the positive corona at all densities are a series of essentially equidistant at all points, parabolic curves, as shown in figure 7, it appears reasonable that sparkover voltage for the higher densities can be estimated by extrapolation using, as limitations , corona onset voltage and applied voltage corresponding to a current rate of about 10 ma, On this basis, sparkover at 1.75 relative density in the 2-inch tube may be predicted at about 26 kv (avg). Further extrapolation of this value for the 2-inch tube up to a value for a 6-inch tube indicates that about 78 kv (avg) would produce sparking at this density. Thus, available voltage in the power supply used in the pilot-scale study (70 kv peak) appears grossly inadequate to allow sound testing on the relative merits of the positive corona at the conditions cited.
In figure 4, maximum power in the negative corona at d = 1.75 is about 4 kva for data at 900° F, while that available in the positive corona is only about 1.6 kva, which represents the maximum power tolerable prior to arcing. This limitation in power input at 900° F could be caused by the creation of flares as previously described for lower temperature.
At 1,500° F localized flares may occur along with sporadic and premature sparking. The maximum tolerable voltage in positive corona may be higher than that used in the efficiency tests described, but at the same time it may be well below a predictable sparking voltage as determined by the method described. At the available voltage (54 kv avg) detrimental effects imposed by localized flares are not detectable, if they are generated.
In a theoretical study, Cooperman predicts that positive polarity will be required for operation of an electrical precipitator at temperatures above about 1,500° F. The analysis shows that (1) thermal ionization will occur at slightly higher temperature and (2) electrons from thermal ionization will be swept out of the interelectrode space more rapidly than ions, and the space charge in the electric field will consist of positive ions. Hence, at some intervening temperature between about 900° F and 1,500° F the sporadic nature of the positive corona must cease to allow use of a precipitator at the higher temperatures.
Analysis of data in table 3 for particle size of ash used in the efficiency tests is inconclusive. From all indications, both coronas are relatively effective in removing ash particles of all sizes from a gas containing a mixture of sizes.
Conclusions
Results of tests in the first semi-commercial electrostatic precipitator ever designed for operation at high temperature and pressure show;
- The high-temperature electrical characteristics of negative corona in a bundle of 6-inch tubes are shown to be similar to those found previously for a single 2-inch tube.
- Although the negative electrical field in a precipitator almost completely deteriorates at high temperature (1,500° F) and low density (0.25), high gas density (>=1.25) provides an adequate field to accomplish effective gas cleanup in a precipitator at this high temperature.
- Dust removal efficiency in the negative corona at 1,470° F and 80 psig (d = 1.75) ranged 91 to 96 percent using maximum tolerable voltage (36.5 kv) prior to sparking; power input averaged 6.4 kva.
- Removal efficiency in the positive corona at the same conditions was only 75 to 77 percent even though operating voltage (54 kv, the maximum available) was almost 50 percent higher than the maximum utilized in the negative corona; power input was less than 2.0 kva.
- Since power input may be used as a parameter for predicting precipitator efficiency, this parameter must be utilized to explain the higher efficiency for the negative corona at the conditions tested.
- Input power-removal efficiency relationships at high temperature (1,470° F) compare favorably with those found in industrial precipitators operating at much lower temperatures.
- Sparkover voltage in the positive corona at 1,470° F and 80 psig is higher than the maximum voltage (54 kv avg) available for this investigation.
- Voltages well above the maximum utilized might be used at these operating conditions to improve the relative effectiveness of positive corona for cleaning solids-laden gases.
- Use of positive polarity in a precipitator for cleaning hot gases appears to be limited to the voltage at which localized flares are generated under given operating conditions.
- No apparent insurmountable electronic problems are encountered in operation of an electrostatic precipitator at 1,470° F and 80 psig (d = 1.75).
- Thermal misalinement of the tube sheet in addition to difficulties with the yoke and the tube rapper appear to be mechanical problems. Modified design of future equipment should provide an adequate solution to these problems.
