Table of Contents
The process of froth flotation as a means of upgrading the quality of coal by removing ash/pyrite and of separating selected mineral(s) from undesired gangue materials is certainly one of the most common unit engineering operations in use today. Flotation has been successfully practiced at the industrial scale for well over 50 years, and if anything, its use is increasing due to the ever decreasing feed grades of the coals and minerals being processed. Flotation, as a process, has also shown itself to be an extremely flexible process that lends itself well to a wide variety of solid/solid separations. Thus separations can involve very different particle sizes, particle densities, relative weight ratios of materials to be separated, etc., with surprisingly little modification in equipment and operating philosophy required.
Why is it so difficult to fine tune the froth flotation process? There are some obvious reasons plus maybe a few not so obvious factors. In the obvious category would certainly be the tendency of natural feed materials (i.e., ores and raw coals) to have variable physical, metallurgical, surface properties, etc., even when special care is taken to minimize such differences with blending. Another obvious reason for difficulty is the inherent broadness of the feed particle size range to flotation that results from using any of the common industrial scale fine grinding devices, e.g., ball, rod, or autogeneous mills. Research into both the chemical reagent and equipment aspects of flotation , especially in the past decade has shown very strong interactions (limitations) of chemical reagents and equipment on both larger and smaller particles. Again, the definitions of large and small are relative to a given system but the point is that current flotation practice works best on “average” or “medium sized” feed particles. The greater the amount of large or small particles or especially of both large and small, the more difficult it is to achieve excellent flotation results
Quantitative Methods of Describing Flotation Data
It is this author’s opinion based on the comprehensive lab to plant testing program alluded to earlier that laboratory flotation cell data is useful if certain caveats or assumptions are followed.
Briefly stated these caveats are: 1) that complete time-recovery profiles (e.g. 3 to 5 time cuts) are measured with the laboratory device using appropriate conditioning time(s) before froth removal and then maintaining approximately constant pulp level during the time of flotation; 2) that the froth not be removed by hand but rather by some type of automated paddle(s); 3) that appropriate mathematical models coupled with statistical confidence tests be utilized; 4) that sufficient time be spent to find the time equivalence relating the laboratory to plant; and 5) that it is accepted that the level of agitation (i.e. the hydrodynamics) in a small laboratory cell is sufficiently different than an industrial cell so that accurate scaling of the behavior of relatively fine particles is very limited.
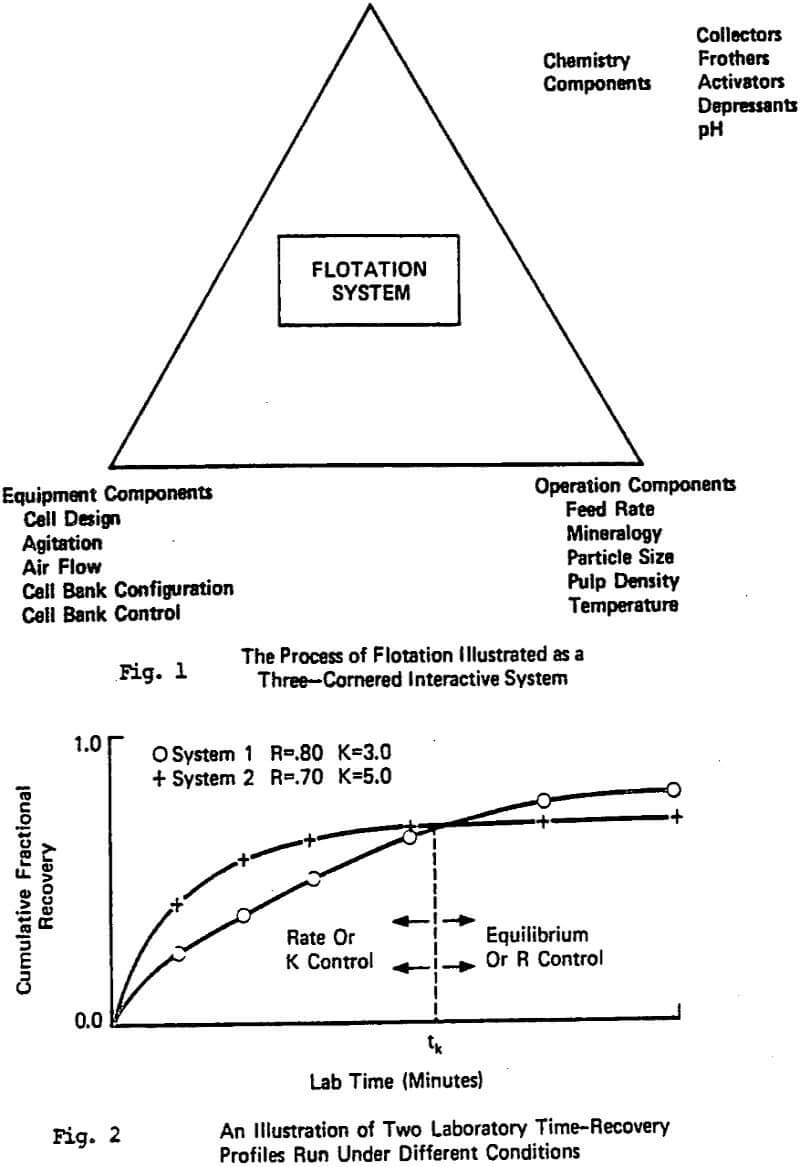
Figure 2 illustrates another related observation from the overall testing program, that is, as the equilibrium recovery (R) at long flotation increases, it does not always follow that the first order rate constant of recovery, K (time ) will also increase. It is not uncommon to find flotation researchers and plant personnel who assume that R and K are always positively correlated, i.e. they always move in the same direction.
When both R and K increase or decrease simultaneously, the trends are simple to translate from lab to plant, however, very often the time-recovery profiles cross with a factor change. This then implies that for that particular factor change, an optimum effect exists depending on the time scale relationship between the lab and plant, e.g. Klimpel (1980). Therefore, when R and K move in opposite directions one has a much more complicated situation. It is on this subject that most of the remainder of this paper will deal.
In the case of batch laboratory time-recovery flotation tests (with or without a paddle) having one addition of collector it was conclusively shown that only one rate constant is necessary. The simple one rate parameter model may not be as technically appealing as a more complex model, but the information contained in the rate parameter of the simple model after curve-fitting will contain the maximum amount of information possible from the data available. The
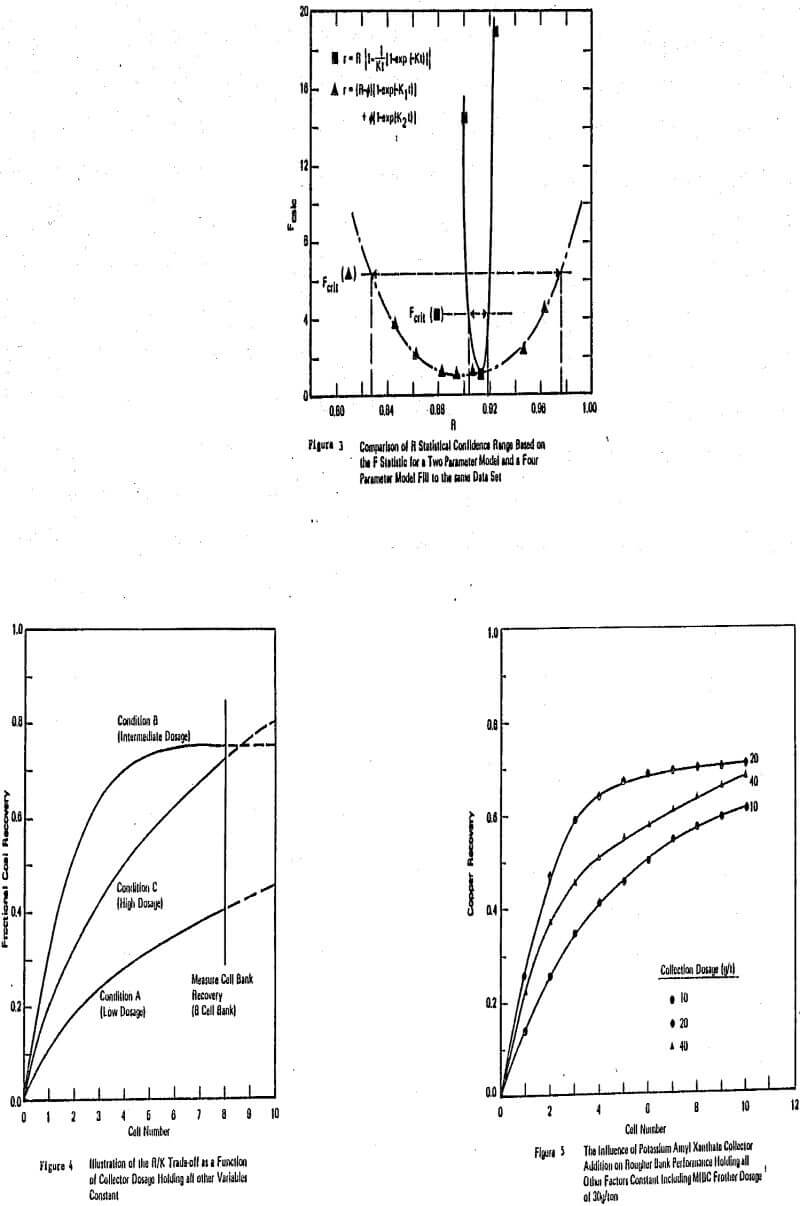
particular model advocated and widely published by this author and his coworkers, e.g. Klimpel (1980) is:
r = R{l-(l-exp(-Kt))/(Kt)}
where r is the cumulative recovery at time t of either a valuable component or of a gangue component, R and K are the curve fitting parameters representing the equilibrium recovery at long flotation time and the rate of mass removal, respectively. If a flotation test is run where two or more size fractions are measured, then, of course, there can be one model (one rate parameter) for each size fraction. Also, where a number of stage-wise collector or other reagent additions are made during a single time-recovery profile, more complex models (one K for each addition stage) can be used. In particular, the author recommends in these cases, a model that is essentially fitting a function that is a sum of the single model repeated for each addition stage. In this situation, the R for the second stage is taken to be R2-R1 etc. where R1 is the R for the first stage.
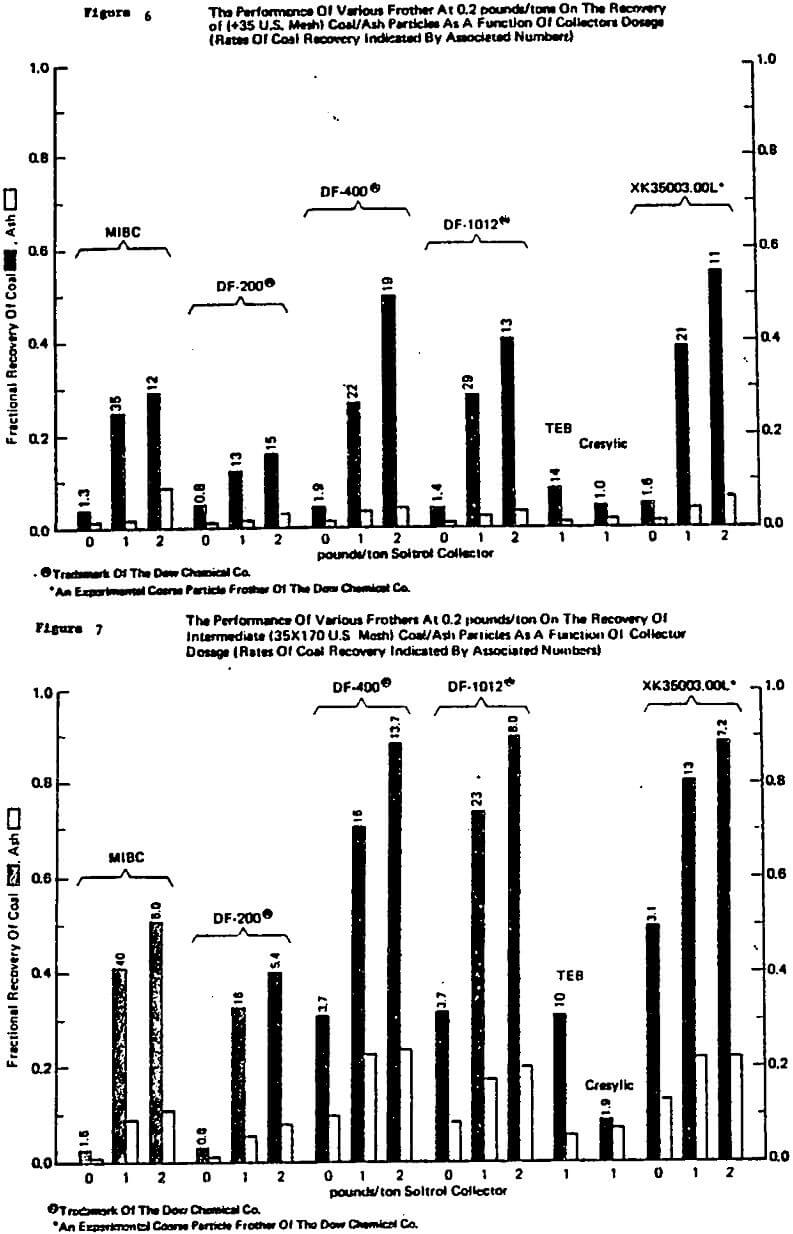
The Effects of Chemical Reagent Dosage
Without question, the single greatest surprise of the entire test program to this author was the dramatic influence of excessive reagent dosages in plant operations. The magnitude and directions of influence of excessive reagent dosage are not generally obvious or predictable from existing published flotation theory. Yet, without a doubt, the influence of dosage with just a single reagent (especially a collector or frother) can clearly dominate almost any industrial circuit response achieved by making other changes such as changing collector or frother type, feed rates within reasonable limits, aeration or rpm, etc. What this really means in practice is that one can prove or disprove the influence of almost any single factor change by suitable changing the dosage setting of one of the other reagents, usually the collector, frother, or activator. Possibly, the magnitude of this effect was known to other people in flotation but certainly was not obvious to this researcher prior to 1979, e.g. Klimpel (1980, 1984a, 1984b, 1987b) and Klimpel and Hansen (1987a, 1987b).
Unfortunately, the results of the overall test program showed that for industrial scale plants to be operating near the optimal economic recovery level they are also near that dosage and recovery corresponding to the R/K trade-off. Even further, with many optimized plants, they have actually (through trial and error testing) “evolved” their way to the R/K trade-off dosage point. One can sometimes physically see the R/K trade-off in the increasing dosage in a plant (especially in the rougher section) by watching the change in froth mobility and “froth armoring” that is occurring. The problem is that the location of the R/K trade-off is different for different reagent types (and combinations of reagents). In those plants that are beyond that dosage(s) giving the optimum in K, the only plant changes that are effective will be those that increase the rate of flotation significantly.
This is why the statement was made earlier: the problem with the industrial flotation process is that it is relatively easy to get reasonable results and relatively difficult to get excellent results. The author, in his experience, has not seen an engineering process like flotation for which this is so true. Is investigating change worth it for a flotation plant? Experience has shown that sustainable increases of one to two percent in recovery and/or gangue are possible over almost any standard operation if the plant has the people, the time, and the money to stick with the improvement program. One thing is for sure, the chances that a single factor change in a plant will give immediately positive results is not very great. This is part of the reason why there is so much of a gap between basic flotation research and plant practice.
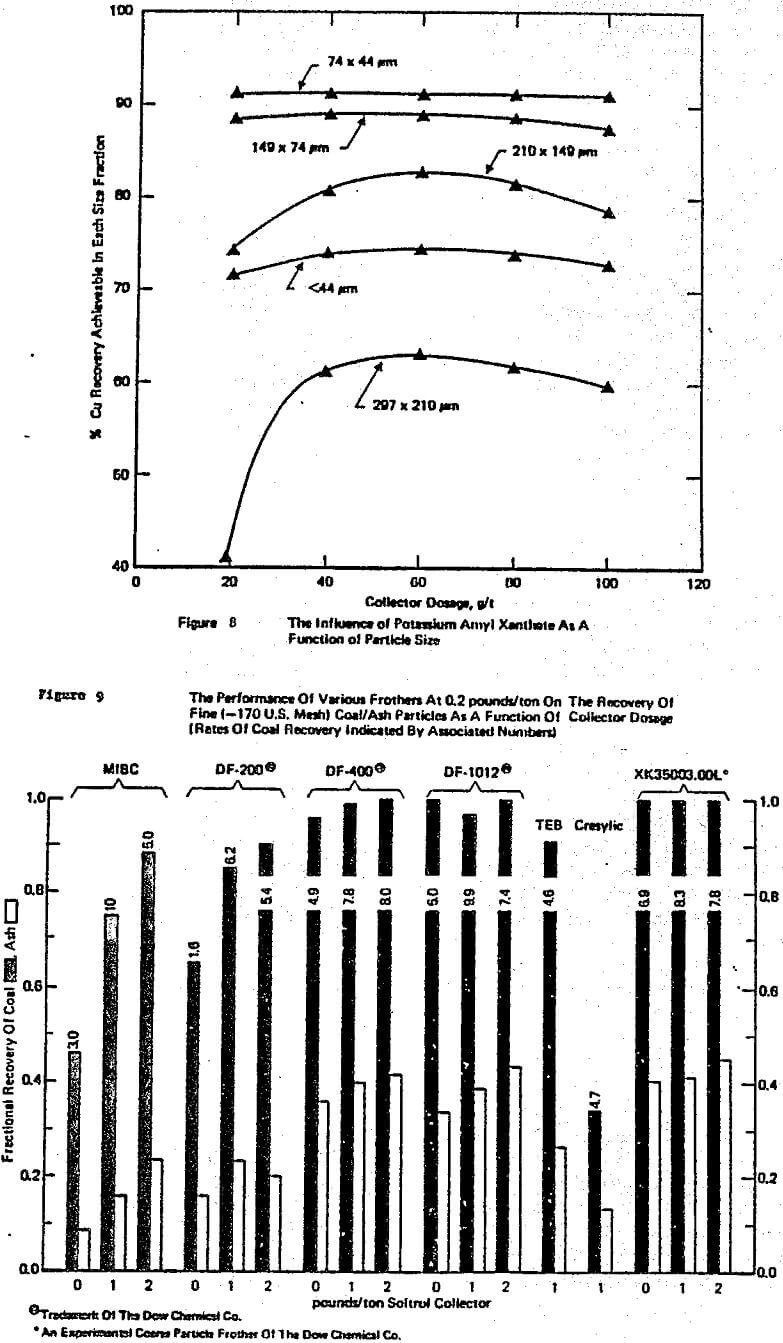
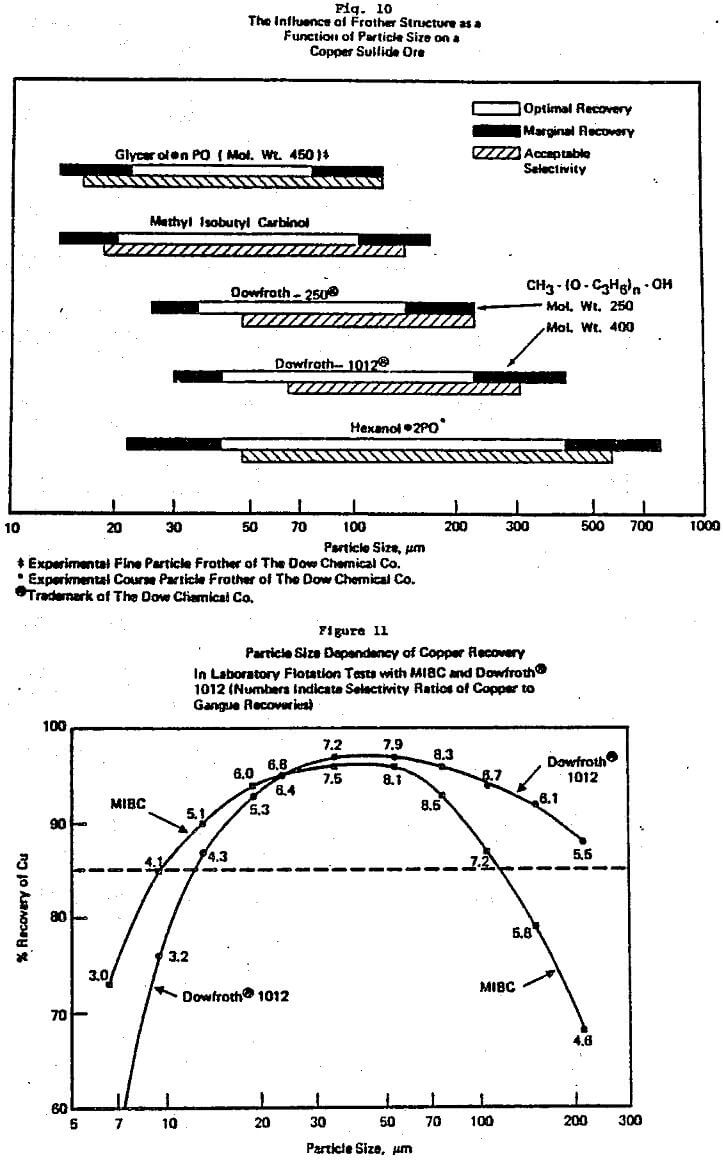
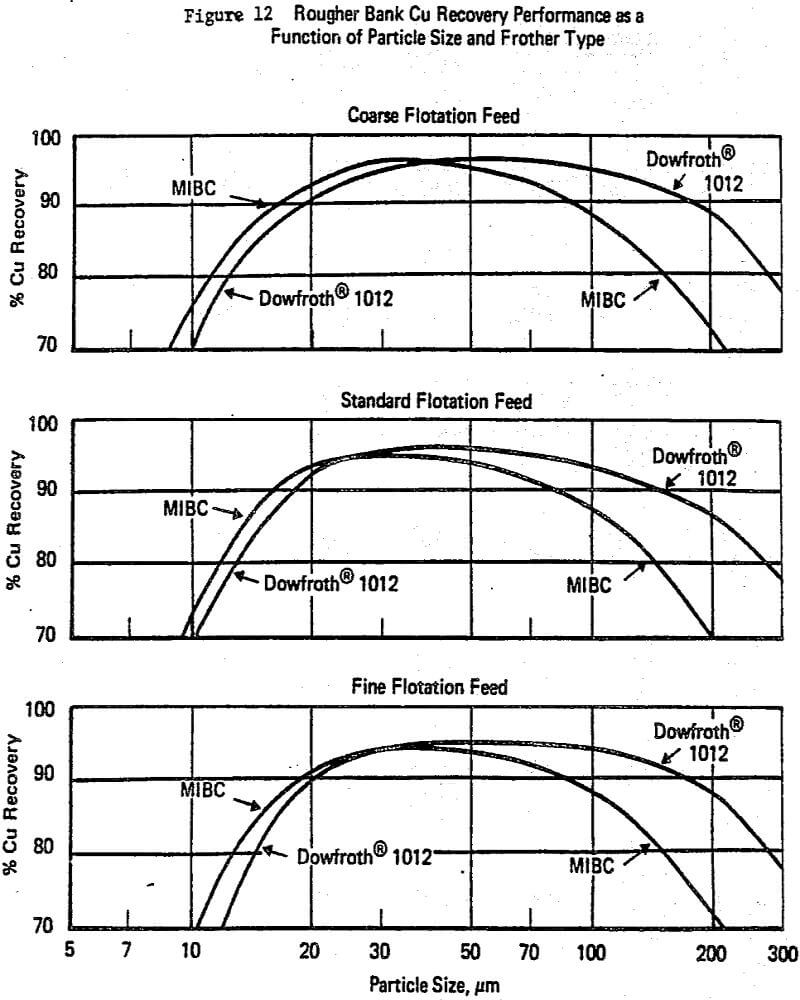
Particle Size Versus Chemical and Equipment Interactions
The other major area of practical awareness that significantly influences laboratory to plant studies is how strongly particle size affects circuit performance. Most flotation theory and associated laboratory data have been based on studies where particle size is not a strictly controlled variable. Yet, like the R/K reagent dosage trade-off, lack of knowledge on the interaction of particle size with chemistry and/or equipment can lead to misleading or incorrect conclusions with many single factor tests, e.g. Klimpel and Hansen (1987a, 1988).
To begin with, it has been this author’s experience that frother (and to a lesser extent collector) influences dominate the differences in the various mechanical machine designs available with regard to flotation performance. This is generally well accepted but does not imply that cell design is not important, it certainly is important, e.g. Klimpel (1987c). The various cell designs do exhibit differences in their ability to maintain coarser particles in the pulp and in the prevention and handling of sanding, etc., as well as economic/operating factor differences.
collector exhibit synergisms is recognized by some workers in flotation. Unfortunately such interactions contribute to the mystery or art of flotation as they are not sufficiently understood to be a priori predictable. In this author’s experience, the alcohol frothers such as MIBC and some natural materials like pine oil are particularly subject to negative and/or positive synergism with common thiol collectors depending on the dosages involved. Thus, again a frother in a laboratory test simply may not perform in the same manner at the plant.
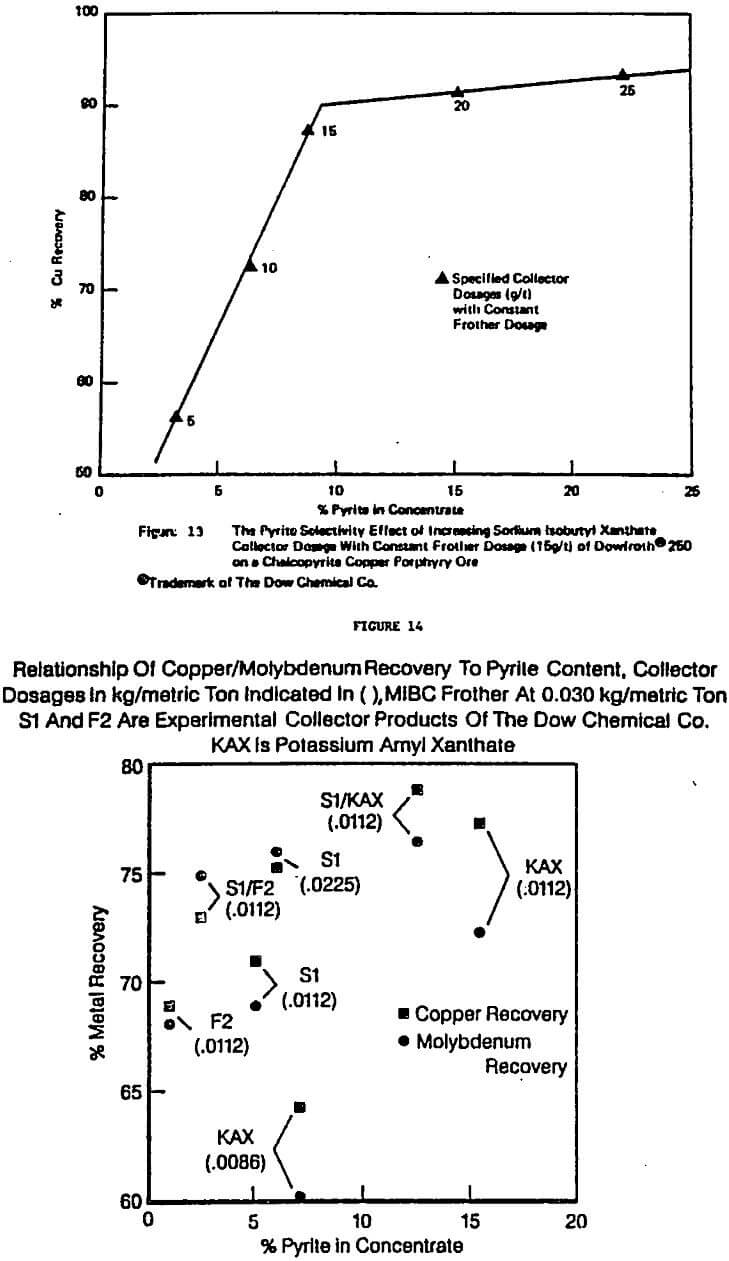
Some Influences on Concentrate Grade and Selectivity
There has been, of course, a great deal of theoretical and laboratory work on how to improve the selectivity of flotation processes, in particular, how to reject iron sulfides such as pyrite and pyrrhotite from desired metal sulfide minerals. Often excellent separations in controlled environments in the laboratory are achieved. In plant environments, such separations are often much more difficult. In the overall test program it was repeatedly found that the best separations (and at the highest rates) were achieved in laboratory tests at low reagent dosages (especially of collectors). However, again an optimization problem generally exists because the valuable recoveries associated with the good separations are simply too low to be economical in practice.