Table of Contents
A continuing problem in mine evaluation, planning, operations, and production scheduling is the necessity of assigning some value for the grade of mineralization which occurs in the area lying between two sample points. This problem is particularly prevalent in evaluating ore deposits because of the usual wide-spaced drilling and sampling in the exploration phase of mining. For example, in exploration drilling of a low-grade copper deposit, a drill-hole grid pattern of less than 300 feet or 200 by 400 feet is seldom found even in the older exploration projects. Depths of drilling required in exploring ore deposits today dictate even wider drill-hole grid spacings because of the cost of drilling. Although information on grade of ore in the vertical plane is relatively good as a result of continuous sampling down the length of a drill hole, horizontal control for both grade of ore and continuity of mineralization is seldom as good as either the engineer or geologist would like. This problem of assigning an area of influence of an assay is present in estimating grade of ore in underground mine blocks and particularly in assigning daily grade and tonnages for shovels in production scheduling in open-pit operations.
This problem also is inherent in using the polygonal method for computing ore reserves, because the grade of an assay in one drill hole is considered as extending halfway to any drill hole. Obviously, this is an incorrect model of the true situation which exists for the mineralization at the midpoint between the two drill holes. Even if the mineralization were to consist of podlike and lenslike segments, the exploration drilling would not penetrate exactly at the center of each pod or lens, and the drill-hole spacing would not equal the pod or lens lengths. If this were true, then boundaries of pods or lenses would fall halfway between holes, at least in one dimension, and the polygonal model could apply for assigning grade of ore in this special situation. However, in situations where other types of mineralization are present, the polygonal method serves as only a rough approximation of the true grade of ore within its area of influence.
The triangular method for estimating grade of ore between drill holes also is an approximation model, because it assumes a linear change of grade of ore in direct proportion to the distance between drill holes. A relationship or correlation between successive assays would have to exist to assign the linear change in grade with distance. The fact that correlation must exist among the successive assays as required in the triangular method precludes any concept of independence between the successive assays. Statistical techniques are available for testing for the presence of both correlation and independence. For example, assume that an exploration program consisted of vertical diamond-drill core holes, and the grade and tonnage of ore had been computed by the triangular method. If in subsequent development, drifts were driven within the ore and between some of the drill holes, assays from samples taken along the drifts could be tested for the presence of both correlation and independence by these statistical techniques. If a linear correlation were present which corresponded to the same linear grade change assumed in the triangular method, the triangular method would have been a good model for use in computing grade of ore between these drill holes. If no correlation were present among the drift assays and tests for independence confirmed the absence of correlation (correlation is sometimes defined as the absence of independence), the triangular method would not be a good model for representing the mineralization or grade of ore that exists between the drill holes. Mineralization is seldom so simple in its structure that a linear model can represent its complexities. Often, a combination of various nonlinear correlations exist over short distances, thus the problem of predicting grade for blocks of ore between drill holes resolves into a problem of curve fitting for a complex distribution of assay values which exists between the drill holes.
Use of the word area in this report is somewhat misleading, particularly to an engineer who is accustomed to defining area in terms of two dimensions; for example, by an X and Y coordinate system. Also, the concept of an area of influence of an assay in a mining context is a three-dimensional volume problem wherein the volume possibly could be circular, elliptical, or even rectangular in shape. However, most exploration, particularly considering the present day search for deeply buried deposits, consists of sampling from either vertical or inclined drill holes. Thus, in most exploration, only a single dimension of the mineralization and its inherent variability can be tested for area of influence, and the test information from the one dimension must, of necessity, be used as the best available estimate for the other two dimensions. Thus, there is an implied concept of area even in the one-dimension case.
The purpose of this report is to present the results of the application of certain statistical techniques , linear correlation and mean square successive difference, for investigating the area of influence and the continuity of assays obtained in mine and mineral deposit sampling.
Linear correlation implies that two variables are related; for example, the sequence of assays in one drill hole is related to the sequence of assays in an adjacent drill hole. These assay values may increase or decrease in a corresponding manner to produce positive correlation, or they may be so related that one sequence increases in value while the other decreases so as to produce negative correlation. If assays in one drill hole were correlated with the assays in another drill hole, this would indicate that there is a continuity of grade between these two drill holes. If there is no significant correlation between assays in adjacent drill holes, this implies that the assays are independent; that is, no measurable relationship exists across this distance between drill holes. Lack of correlation between drill holes may occur as a result of many factors:
- Large fluctuations in grade across short distances.
- Changes in mineralization; that is, oxide, secondary, and primary zones.
- Changes in rock types that have different susceptibility to mineralization.
- Structural changes such as faults, fracture intensity, and shearing.
- Changes in alteration; for example, argillization, chloritization, and silicification which result in a different intensity of mineralization.
Other causes could be listed, but these few give some idea of the many ways in which correlation can be affected. Several factors, such as those listed above, are usually present inmost hydro thermal deposits, and their presence will tend to superimpose grade changes on any linear correlation which might be present. For example, the primary zone of a porphyry copper deposit may show high linear correlations for assays between drill holes, but the oxide and secondary zones, as a result of the changes in mineralization, will not.
The mean square successive difference, as used in mine evaluation, is a measure of the difference between assays representing successive samples; for example, from successive samples along a drill hole or along a drift. Its interpretation is based on the concept that two samples taken adjacent to each other are more apt to produce the same assay value than two samples that are taken some distance apart. For example, the first and second assays of a series of samples taken at a uniform spacing or interval along a drift are more apt to be the same than the first and tenth assays of the series. This is based on the assumption that rock type and rock constituents in hydrothermal deposits are more nearly homogeneous over small distances than over large distances, and, therefore, mineralizing solutions should react more uniformly over the short distance.
This concept and these assumptions were recognized by de Wijs, and he has proposed a coefficient of deviation that he has used as a measure of variability based upon the arithmetic mean (not the mean square) of the successive difference between assays. According to de Wijs, this coefficient should take into account the possibility that successive values are correlated with each other, and that “This coefficient seems to be a trait of [the mineralization], dependent upon the mode of origin, whereas the average grade expresses the local intensity and duration of the mineralizing process.”
In this study, the mean square successive difference was used, because it is a commonly available statistical technique which can be used as a standardized test procedure. The test is so constructed that a significant result indicates the absence of independence between successive values; that is, the assays are related by a measurable amount at the sample interval used (for example, 5-foot sample intervals for successive assays within a drill hole). The test can be rerun after regrouping the assay values; for example, assays from 5-foot sample intervals can be averaged for 10-foot intervals by combining values and computing a new average value for the first and second assays, the third and fourth assays, and so forth. Also, the assays can be arranged by groupings such as dealing cards in a game having two or more players. This latter arrangement introduces a progressive change (equal to the sample interval) in the starting assay position for each new group. This arrangement can, at times, coincide with trend or periodic changes in assay values to produce occasional significant tests indicating nonindependence of the assay grouping. If a test of the 10-foot interval data also indicates the presence of nonindependence, the assays can be recombined to 15-foot, 20-foot, and larger sample intervals until the test results indicate independence between successive assay values. Once individual assays, recombined to some larger sample interval, show independence by the mean-square-successive-difference test, this sample interval is considered as the area of influence of an assay in the dimension indicated by the sequence of samples and assays.
Examples of assays from several different mines and ore deposits are used to demonstrate the relationship between area of influence of assays and the characteristics of the mineralization being sampled. Some of these data have been used in previous sampling research studies for other objectives, but these data have been gathered here to illustrate the concepts of testing for the area of influence of an assay.
Statistical Techniques used for the Investigation
Mean-Square-Successive-Difference Test
The difference between successive assays can be evaluated by the mean-square-successive-difference test. This technique is useful in testing for long-range trends as well as short-period fluctuations. The mean square successive difference is obtained by taking the mean of the squares of the N-1 differences between successive assays. The formula is
δ² = Σ(Xi+1 – Xi)²/N – 1
where δ² represents the mean square successive difference, Xi is the ith assay, and N is the number of assay items. The ratio η = δ²/s² can be used if table values (1) are available for η. In this ratio, s² is the variance of the assays, that is, s² = Σ(Xi – X)²/N – 1, when Xi is the ith assay and X is the mean of the assays.
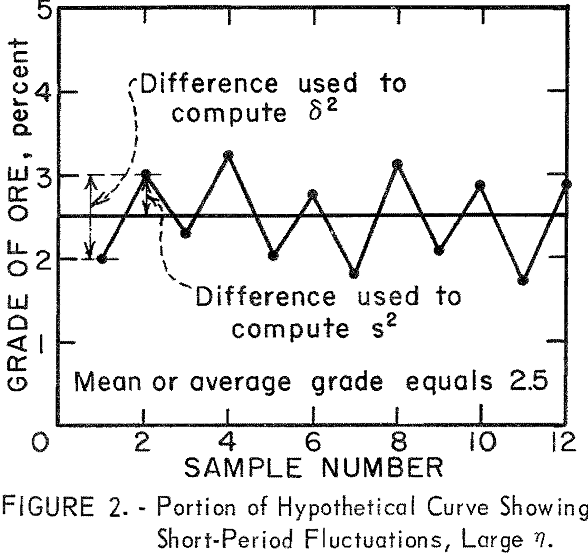
The value of δ² is based on the difference between successive assays while the value of s² is based on the deviation of each assay from the mean of the assays. A consistent increase or decrease in a series of assay values (trend in grade of ore) will produce a series of large deviations from the mean, and s² will be larger than δ² in this situation. This will result in a small ratio for η (fig. 1). A large value for the ratio η would occur if the successive assays fluctuate rather widely, and particularly if they should fluctuate in a more or less alternating manner on either side of the mean (fig. 2).
For values of N equal to or less than 25, the value of η will fluctuate about 2 as an average value.
For values of N greater than 25, the formula ε = 1 – δ²/2s² can be used; ε is nearly normally distributed with an average value of zero. This permits the use of a z test, z = ε/σε and σε = √N – 2/(N – 1)(N + 1) to evaluate the mean square successive difference.
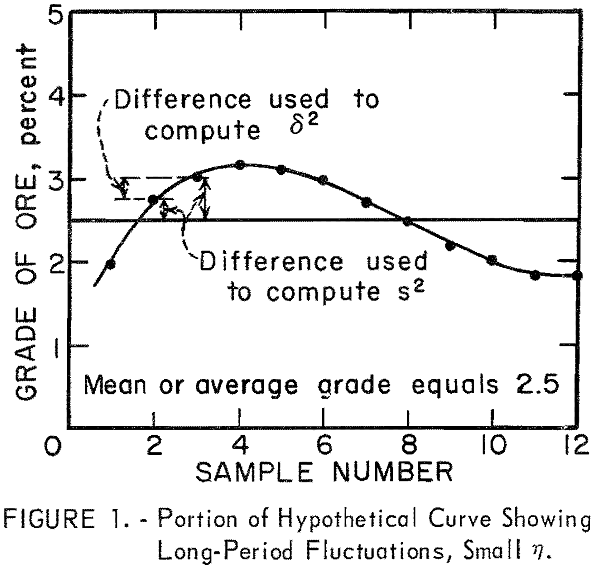
Since δ² will not increase as rapidly as s² when long-period fluctuations are present in the assay data (fig. 1), η = δ²/s² will be small, less than 1, and ε = 1 – δ²/2s² will be positive when η is less than 2.
When short-period fluctuations are present in the assay data (fig. 2) δ² will be larger than s², η will be larger, and ε will be negative when η is greater than 2. These positive and negative relationships for ε illustrate the usefulness of the mean-square-successive-difference test not only in testing for independence and nonrandomness between successive assays but also in its ability to differentiate between types of fluctuations or trend in the assay data.
If the value of z were not significant at some selected confidence level (a 90-percent level has been used for this study), the mean square successive difference between successive assays also would be considered as non-significant; that is, the successive assays behave as if they were independent of one another. Any single assay could be related to its neighbors but not to the group as a whole, and this would introduce the concept of evidence for independence between successive assays. When assays are independent, there is no evidence or justification for projecting the area of influence of an assay beyond the sample-interval length which showed independence.
The presence or absence of a significant value for the mean-square-successive-difference test is a function of both the characteristics of the the mineralization in the deposit and the sample-interval length. If the mineralization were to occur in a brecciated zone wherein the fractures containing mineralization were completely unrelated over small distances, then a small sample-interval length should produce independence between successive assay values. If the mineralization were in podlike or lenslike masses with considerable thickness, significant values for the mean-square-successive difference test would be expected for short sample intervals, and a long sample-interval length equivalent to lens thickness would be required to produce a nonsignificant value for the mean-square-successive difference test. In this latter situation, it would probably be necessary to either average assay values from several sample intervals, such as the first and second, the third and fourth, and so forth, to double the sample interval, or to regroup the assays into selected intervals, before the test would show non significance for the mean-square-successive-difference test. The ultimate situation in combining samples would be to end up with a single average assay value per drill hole, then the problem would revert to testing for independence between single assays between drill holes. As will be shown later in this report 2 non significance and, therefore, independence between successive assays may occur at any sample-interval length, depending on the characteristics of the mineralization.
Correlation
The presence of correlation between a series of measurements of two items indicates that there is some relationship between these two items. The correlation may be a result of some causal relationship where one item is dependent upon the other, as in pressure-temperature relationships, or the correlation may exist as a result of coincidence, as, for example, where two completely unrelated sets of data happen to increase by a corresponding amount over a period of years.
The formula for linear correlation,

is used to compute a value for r, the linear correlation coefficient. In the formula, N is the number of items in each set of data, X values represent the individual items of one set of data, and Y values represent the individual items in the second set of data. For example, in this study, one set of assays in a drill hole could be designated as the X values and a second set of assays from an adjoining drill hole could be designated as the Y values.
The linear correlation coefficient r may be interpreted in terms of variance, with r², the coefficient squared, defined as the amount of variation that is accounted for by the correlation between the two sets of data, X and Y values. Then (1 – r²) may be considered as the residual or amount of variation that is not explained by the relationship or correlation between the two sets of data. This residual or unexplained remainder is often considered as a random element in the two sets of data. This interpretation of correlation in terms of variance is based on the assumption that the correlation between X and Y is linear and that variation in X is associated with variation in Y.
Correlation can be used to test for the existence of continuity of grade of ore between adjacent drill-hole or channel samples, particularly in bedded or layered deposits. It can be used to aline or relate specific ore horizons.
Source of Assay Data Tested
Sets of assay data from five hydrothermal mineral deposits–Climax molybdenun, Colorado, Cebolla Creek titaniferous iron, Colorado, San Manuel copper, Arizona, Piedra Hueca copper, Puerto Rico, and Butte copper, Montana — have been used for demonstrating the tests for determining the area of influence of an assay. Each deposit has different characteristics of mineralization fracture filling in a breccia at Climax; pods and lenses associated with a carbonatite stockwork at Cebolla Creek; porphyry-type low-grade copper with oxide, secondary, and primary ores at San Manuel; low-grade copper ores along a shear zone or sheetlike structure at Piedra Hueca in Puerto Rico; and deep-vein copper ores and horsetail copper ores from Butte, Mont.
Climax Molybdenum Deposit
A special experimental sampling project, designed for statistical analysis of the resulting assay data, was made possible at the Climax Molybdenum Co. mine through the help and excellent cooperation of the company officials. One of the objectives of the experimental sampling project was to determine the minimum core sample size (volume) that could be used and still retain independence (randomness) between samples to permit valid use of statistical methods in estimating grade of ore with a specified precision.
Results of this earlier research sampling project have been published, and only sufficient details will be given here to establish the relationship between the drill holes and the assay data used in this study for the area of influence of an assay.
Five core-drill holes, totaling approximately 800 feet, were drilled at three sites in the mine. Two of these sites were on the Storke level and one on the Grizzly level. All three sites were in the 0.2- to 0.4-percent MoS2 grade zone as defined by earlier sampling and geologic considerations. One drill site, approximately parallel to the footwall, was in the face of a haulage drift which was to be advanced to completion at a later data. Two drill holes, NX 636 and BX 642, were drilled horizontally along the projected rib of the haulage drift. The two horizontal holes were oriented parallel to each other and 12 inches apart vertically. The NX hole encountered two fault zones and had to be drilled 222 feet to obtain 200 feet of core. The BX hole had to be stopped at 76 feet because of difficult drilling in the first fault zone. Both holes started from the same zero footage marker so that samples taken from each drill hole matched as to footage of drill hole.
Two other drill holes, NX 648 and AX 645, were drilled out into the hanging wall. These holes were oriented horizontally and separated by 12 inches at the collars. They also were oriented parallel and 12 inches away from a third drill hole (AX 551) which had been, drilled previously by the company.
Thus, the three holes in the hanging wall (2 new and one old) formed a triangle at the collar positions. The fifth drill hole, AX 649, was drilled approximately horizontal at a randomly selected orientation from a drill site on the old Grizzly level. These three drill sites were from 1,200 to 1,800 feet apart and the fifth hole is located about 600 feet higher in elevation than the other four holes.
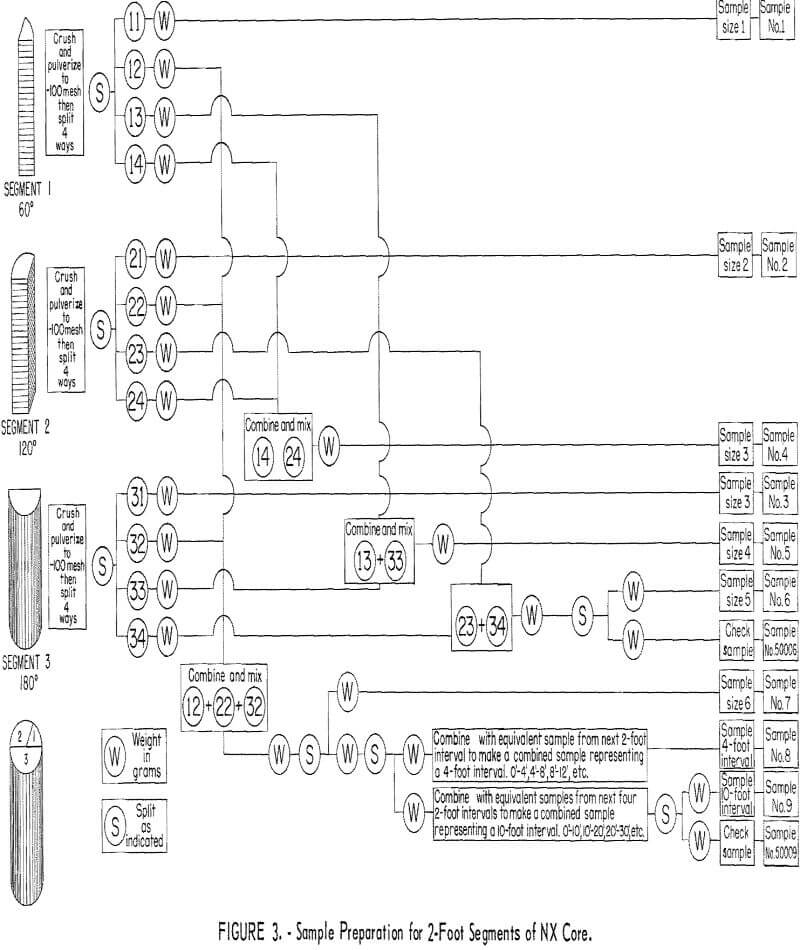
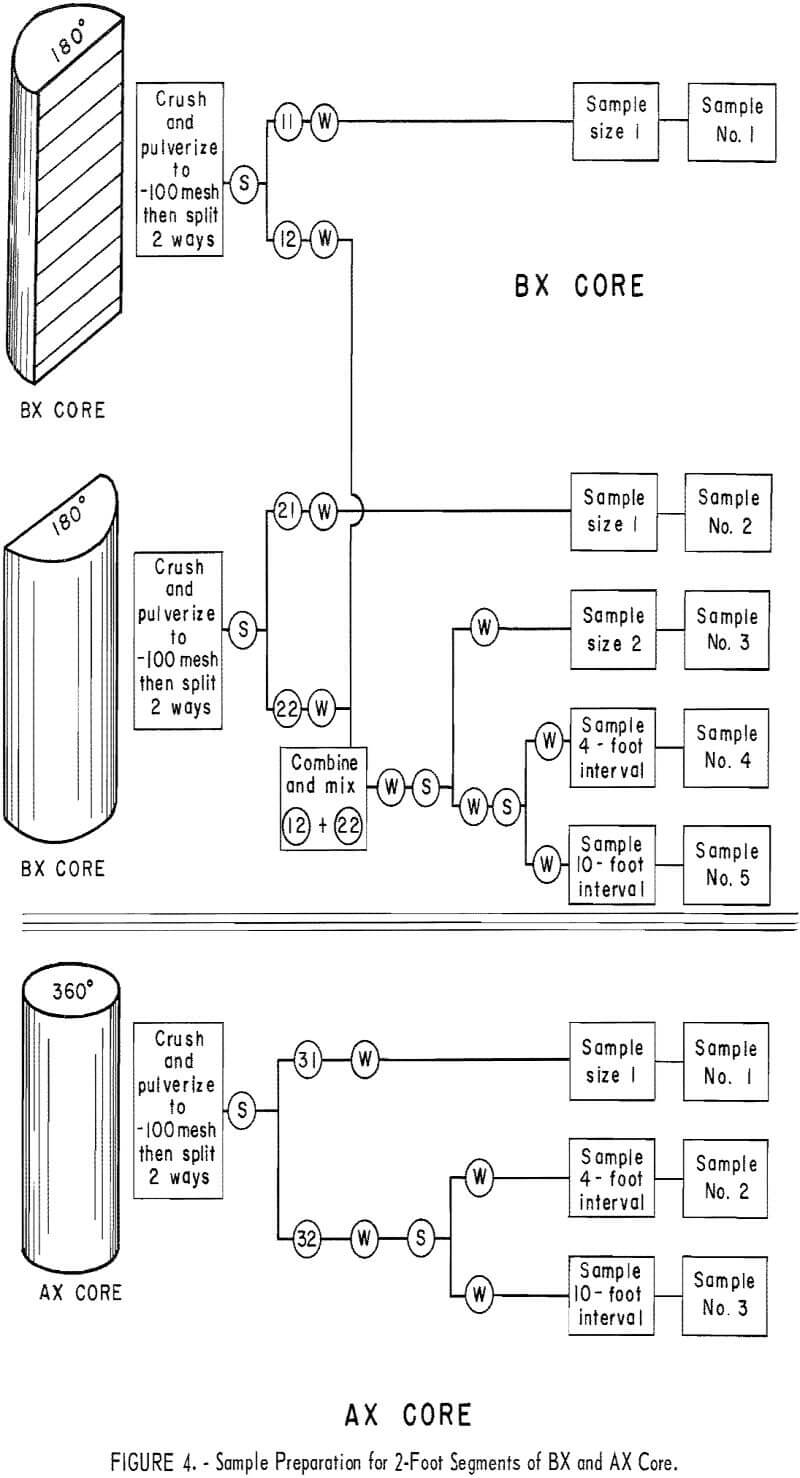
Drill core was carefully logged and then cut into 2-foot sample intervals corresponding to 2-foot advances in the holes. The 2-foot lengths of NX drill core were cut in two lengthwise by diamond sawing to give two 180-degree segments, and then a 60-degree segment was cut longitudinally from one of the 2-foot 180-degree segments (fig. 3). BX core was cut into 2-foot sample intervals and then cut in two lengthwise by diamond sawing (fig. 4). AX core was cut into 2-foot sample intervals, but it was not cut lengthwise (fig. 4).
All core segments were pulverized to minus 100 mesh and split and recombined to form samples for 60-, 120-, 180-, 240-, 300-, and 360- degree segments of 2-foot cores (figs. 3 and 4). Splits also were combined to produce samples representing 4- and 10-foot, 360-degree segments of core. All samples were assayed at the Golden, Colo., laboratory of the Climax Molybdenum Co.
Mean-Square-Successive-Difference Tests
The mean-square-successive-difference test was used to determine whether or not the successive assays along the length of the drill holes were independent; that is, whether or not there was any evidence of a relationship between successive assays. Since the NX samples had been cut and combined into six sample volumes- 60-, 120-, 180-, 240-, 300-, and 360-degree segments for each 2-foot sample interval assays representing each of these volumes within the NX drill holes could be tested along the length of the two NX drill holes. The BX samples had been cut and combined into two 180-degree segments and one 360-degree segment for each 2-foot sample interval. Assays from each of these volumes could be tested for the one BX drill hole. AX core was not subdivided into segments so a single test could be made for the 2-foot sample intervals for each of the two AX holes. However, pulverized material from each drill hole also had been combined into 4- and 10-foot sample intervals, so each of these intervals could be tested.
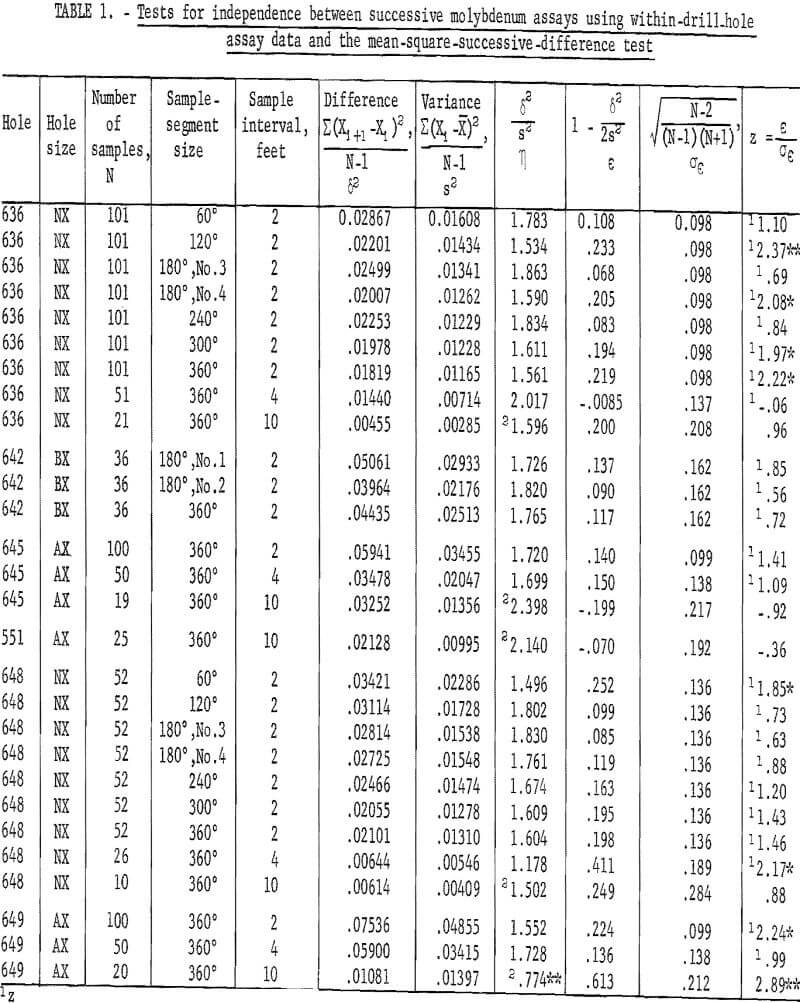
Table 1 gives the results of these tests. Data for NX drill hole 636 showed three out of nine tests as significant at the 90-percent level and one additional test as significant at the 98-percent level. There are two significant tests for drill hole 648 and two significant tests for drill hole 649. There are three distinct breaks in the data from NX drill hole 636, which could be the cause of some of the apparent discrepancy in results. The faulting cut by hole 636 resulted in gaps in the continuity of data from 80 to 94, from 144 to 148, and from 212 to 214 feet, causing a break in continuity of the relationship between samples across these intervals. Tests of assay data from BX drill hole 642, which is parallel to NX drill hole 636, indicate independence between successive assays, but coring was stopped at 72 feet in the first fault so that its continuity between samples was not broken. Also, tests for the 2-, 4-, and 10-foot intervals from AX drill hole 645 are nonsignificant, yet it is known to have some trend in the data. Thus, the non-randomness in NX drill hole 636 may have been introduced by experimental procedure rather than by the mineral distribution. Also, in a purely statistical sense, at a 90-percent level of testing, 1 in 10 tests should show significance.
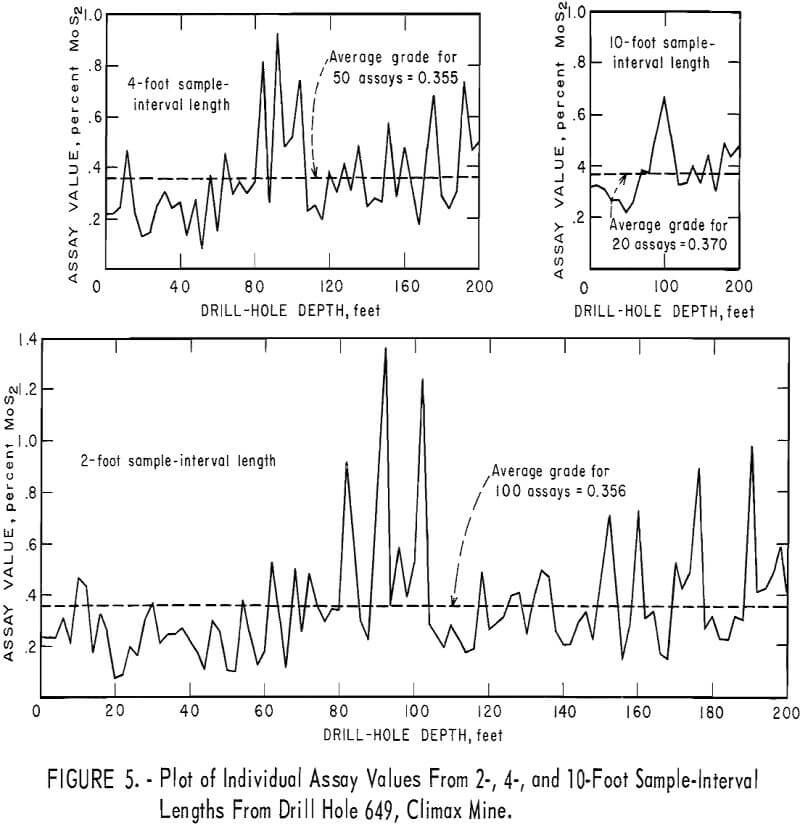
Two tests for drill hole 649 are significant. Fluctuations have been averaged out for the 4-foot interval and the test indicates independence between assays. Figure 5 shows a plot of the individual assays for the 2-, 4-, and 10-foot sample-interval lengths from drill hole 649. Individual assays from the 10-foot sample interval show definite trend or that a long- period fluctuation is present in the drill hole. There is some evidence of this trend in the plot for the 2-foot interval, but a curve fitted to the 2-foot-interval data would show more of a cyclical periodicity. This trend is adequately averaged out at the 4-foot interval so that the results indicate nonsignificance at this interval. However, the 10-foot interval is such that it coincides with some phase of the original trend pattern, and the test is again significant. This is a good example of how sample-interval length can be used to ascertain some information about the mineralization.
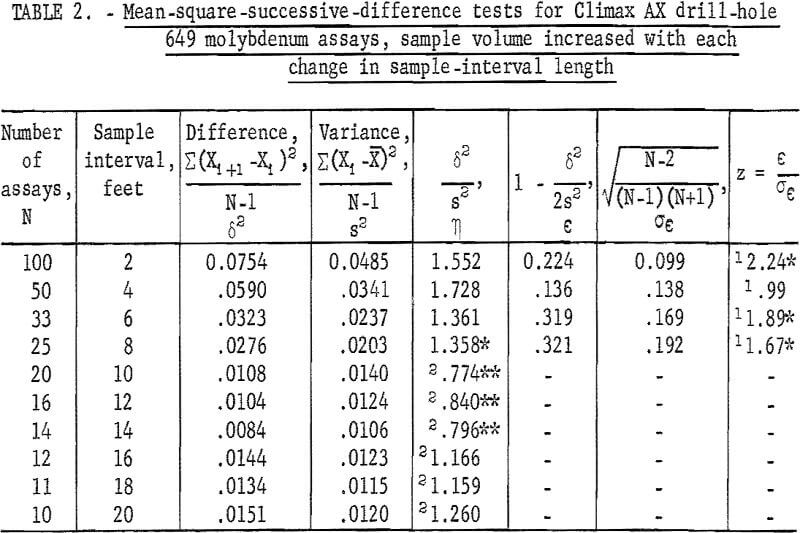
If the mean-square-successive-difference test is nonsignificant that is, the data test as if each sample is independent of its neighboring sample there is no good justification for extending the area of influence of a sample beyond the sample interval length producing the evidence of independence. If the data were to test as significant, such as that for the 2-foot interval for drill hole 649, (table 2), the data can be recombined into multiples of the original sample interval (see fig. 6) and tested until nonsignificance is shown. This was done for hole 649 (table 2), and the data showed nonsignificance at a 4-foot interval. If no trend were present in the assay data, recombining the assays into larger intervals should continue to produce a nonsignificant test. However, if trend were present, recombining could result in having some new intervals coincide with the old trend pattern and show significance at a larger interval as is evident for the 6- through the 14-foot interval from hole 649 (table 2). In making this recombining sequence, it should be remembered that sample volume is being increased each time recombining occurs. Increasing sample volume reduces the variance and standard deviation of the recombined assays, and this increased volume may affect the results of the tests for independence.
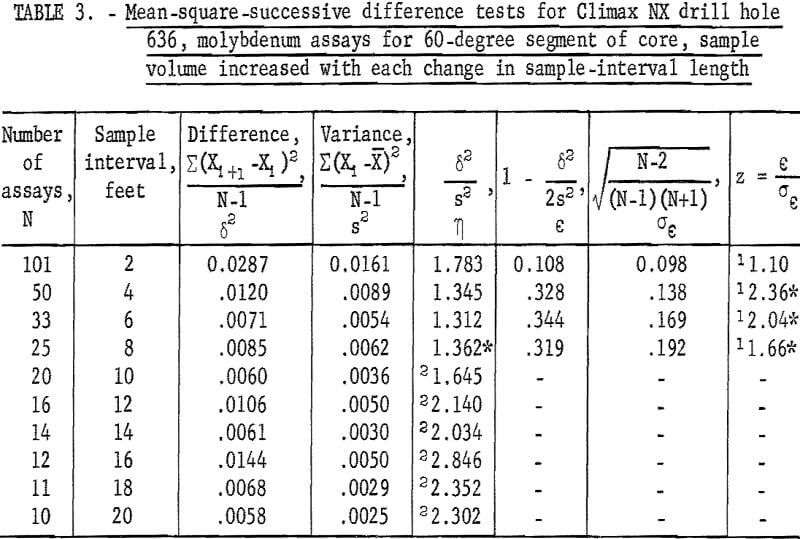
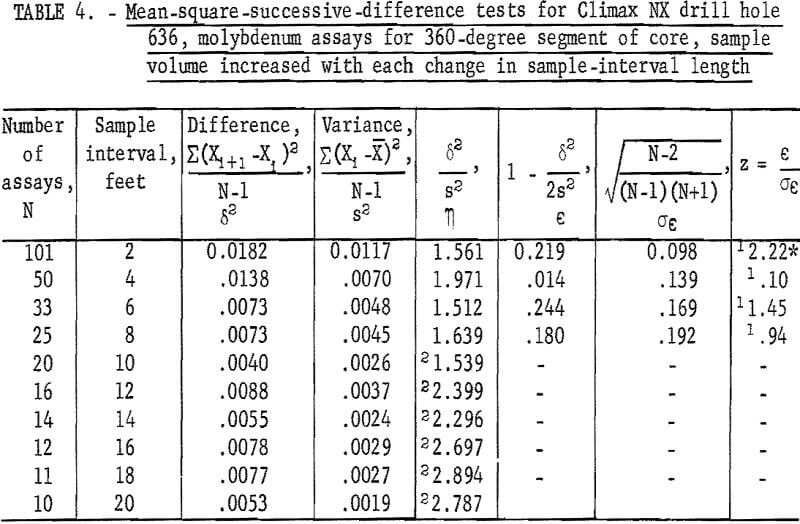
The 100 assays representing the 60- and 360-degree segments of core from NX drill hole 636 were recombined by 2-foot intervals up to a 20-foot interval to determine if a trend pattern would be evident at different intervals. Results of these tests are given in table 3 for the 60-degree segment and in table 4 for the 360-degree segment. The test for the 60-degree segment is not significant at the 2-foot interval, but it is significant at the 4-, 6-, and 8-foot intervals. The test for the 360-degree segment is significant at the 2-foot interval, but it is not significant at the rest of the intervals. This example may illustrate a possible influence of sample volume on the area of influence of an assay larger sample volumes produce smaller variances and standard deviations and could result in averaging out trend which might influence the tests for independence.
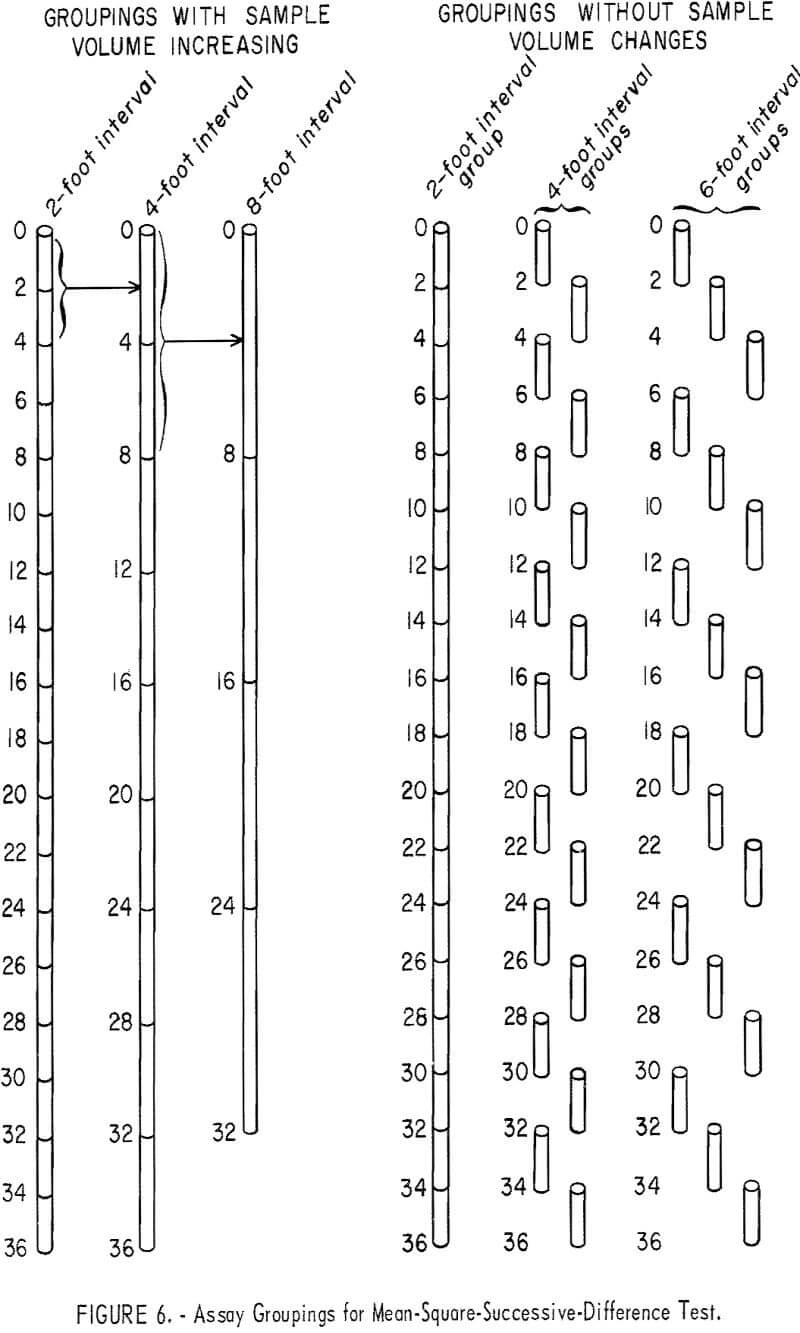
Similar mean-square-successive-difference tests can be made for these data, without involving an increase in sample volume, by using the same sample intervals but not combining and reaveraging the assays (see fig. 6). Table 5 gives the results of tests for various groupings of assays for AX drill hole 649. The first involves two groups composed of odd and even numbered assays which represent a 4-foot sample-interval length. Both tests are nonsignificant. The second arrangement is made up by dealing or separating the assays into three groups, each representing a 6-foot sample-interval length (fig. 6). These three tests for the 6-foot interval are all nonsignificant. Tests for the 8-foot sample interval involve four groups. Two of these tests are significant at the 90-percent test level. This corresponds to the significant result found for the single test for 8-foot interval in table 2.
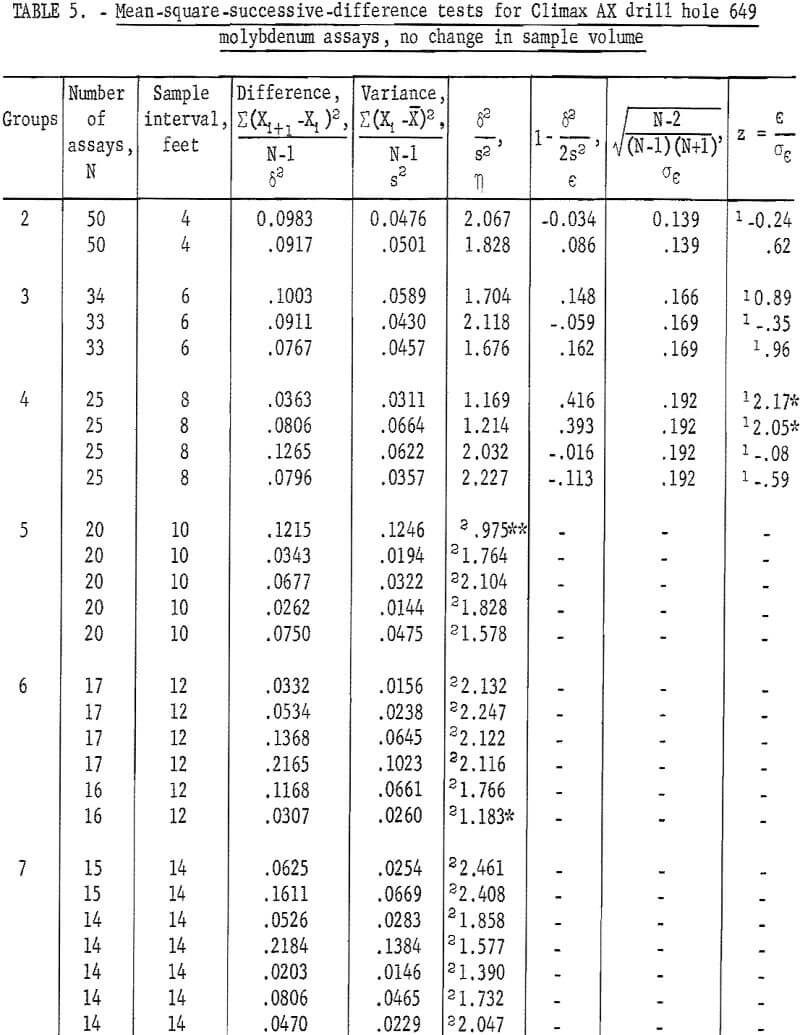
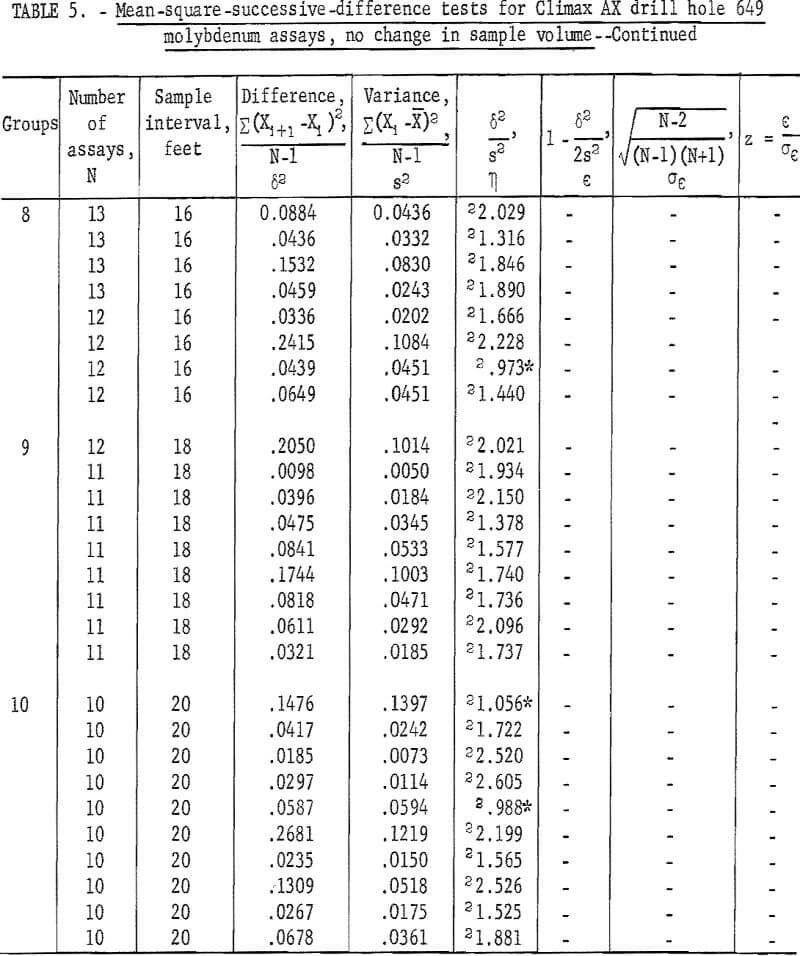
A fifth group representing a 10-foot sample interval involves five tests. Only one of the five is significant at the 98-percent test level. The single test in table 2 for the 10-foot interval was significant. The sixth group, for a 12-foot sample interval, has one test significant at the 90-percent level. The seventh group has no significant tests, and the eighth group has one test significant at the 90-percent level. The 9th group has no significant tests, but the 10th group, for a 20-foot sample interval, has two tests significant at the 90-percent level.
When these 54 tests are considered as one group, there are 6 tests significant at the 90-percent level and 1 test significant at the 98-percent level. As a result of the test levels, 1 test in 10 is expected to be significant at the 90-percent level and 1 test in 50 is expected to be significant at the 98-percent level. Thus, the results of the tests indicate independence between successive samples at the various sample-interval lengths tested. The number of tests that showed significance is no more than would be expected as a result of chance alone and cannot be related to significant differences in the test results.
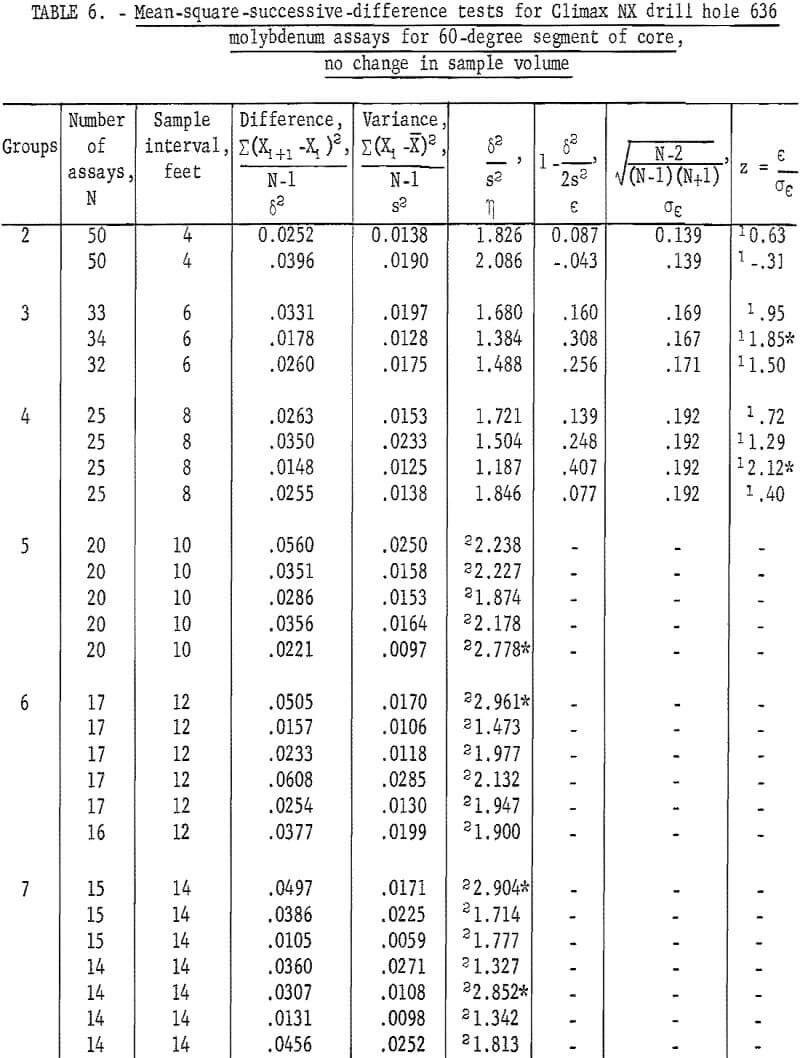
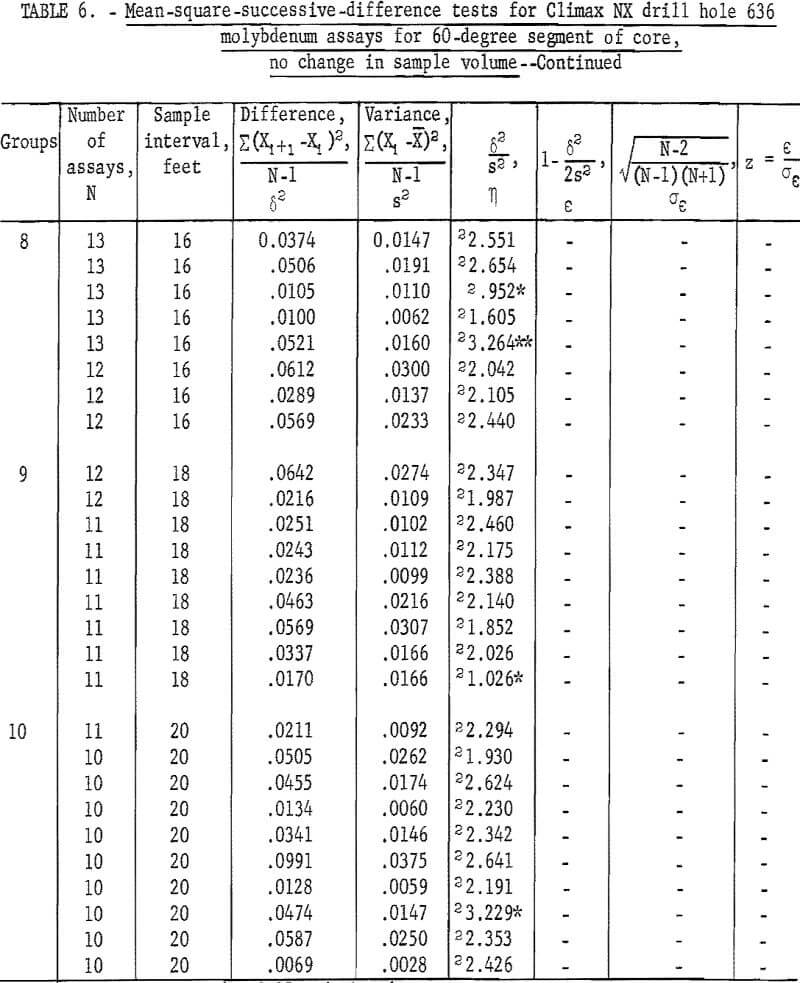
Similar tests were made for the split NX core, 60-degree segment (table 6) from NX drill hole 636. There are eight tests significant at the 90-percent level and one test significant at the 98-percent level. There are somewhat more significant tests at the 90-percent level than would be expected as a result of chance alone for the total of 54 tests.
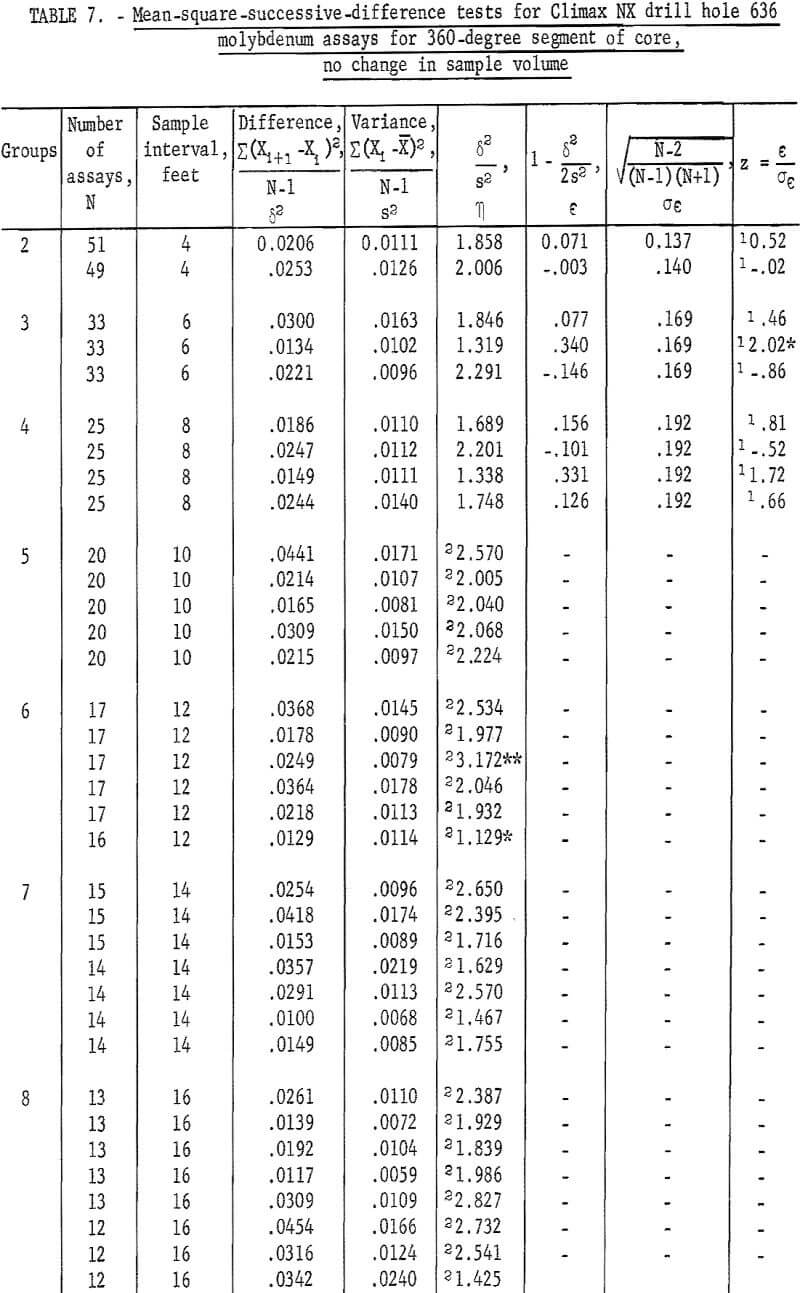
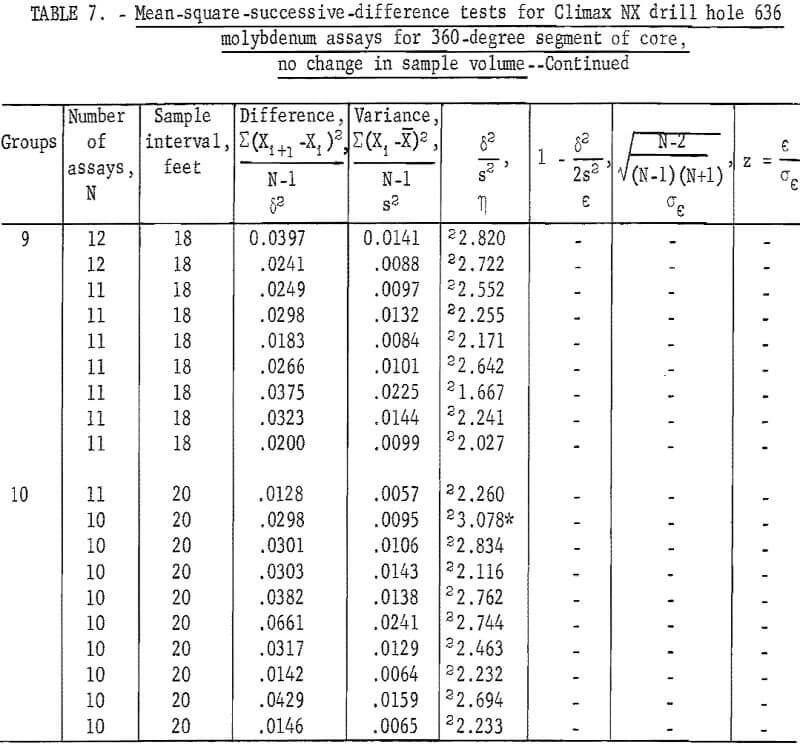
For the 360-degree segment of core from NX drill hole 636 (table 7), the tests indicate only four significant at 90-percent level and one at the 98 -percent level.
The tests for independence when sample volume is not increased appear to give better results; that is, they appear more nearly independent at all sample intervals than the same series of tests when sample volume is increased (tables 3 and 4).
Correlation
Correlation can be used to check for the existence of a relationship between successive assays from different sample volumes used in the designed sampling project at Climax.
Correlations were computed for the various combinations of within-drill-hole assays representing the six different sample volumes within NX drill holes 636 and 648 and the three sample volumes within BX hole 642. Results are given in table 8. Virtually all of these within-drill-hole assays show good correlation values for rxy. The percentage of variance in Y that is attributable to X ranges from 36.7 to 97.6. These are statistically significant values for rxy. (N ranges from 36 to 101) and indicate that nonindependence is present when comparing assays representing different sample volumes from the same sample interval within a drill hole in this grade zone at Climax. Smaller percentages of correlation are found when comparing two small sample volumes within a drill hole. It is believed that a small-volume sample does not contain enough of the small fractures of veinlets of ore to produce as much correlation. This might be considered as a lower limit to the correlation factor of influence. Care must be exercised in interpreting the results of these correlation values because the segments larger than 180 degrees in size are made up by combining splits of the smaller segments. Thus, there is no doubt, a built-in correlation is present in some of these data.
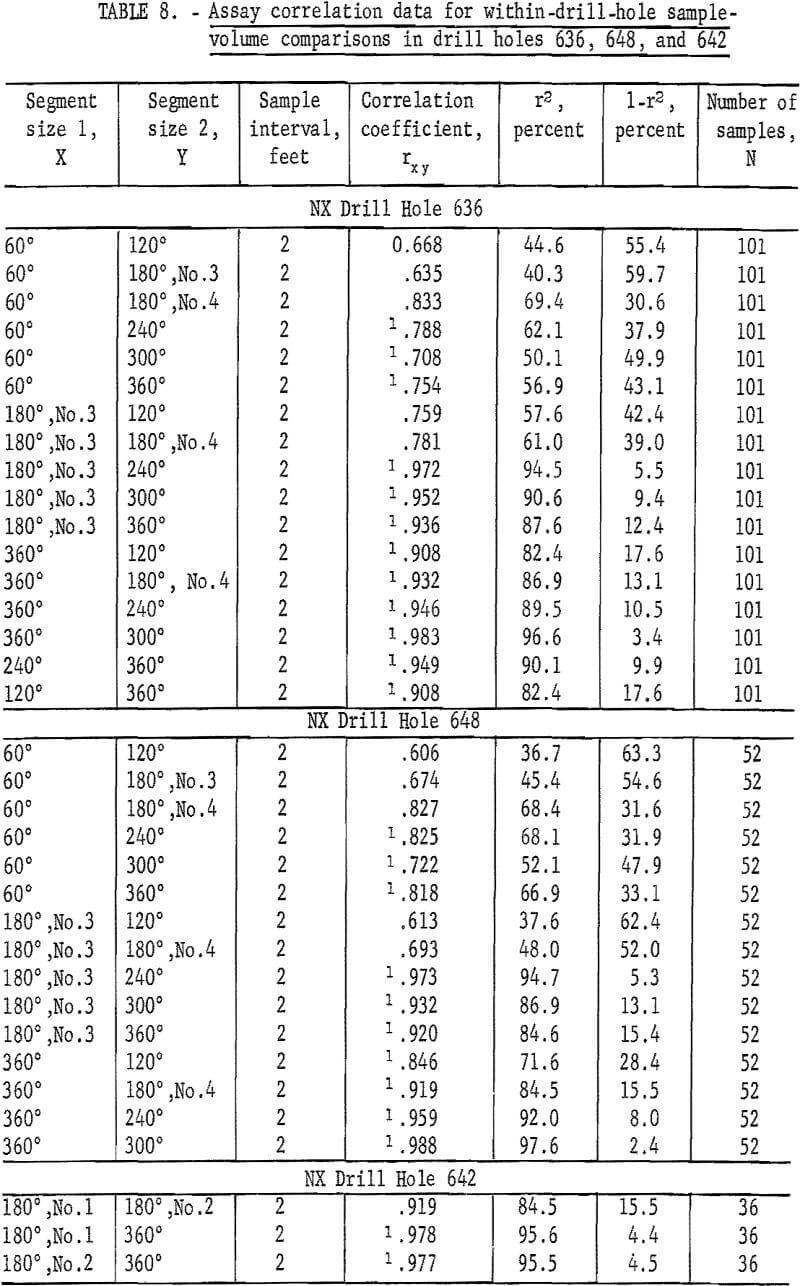
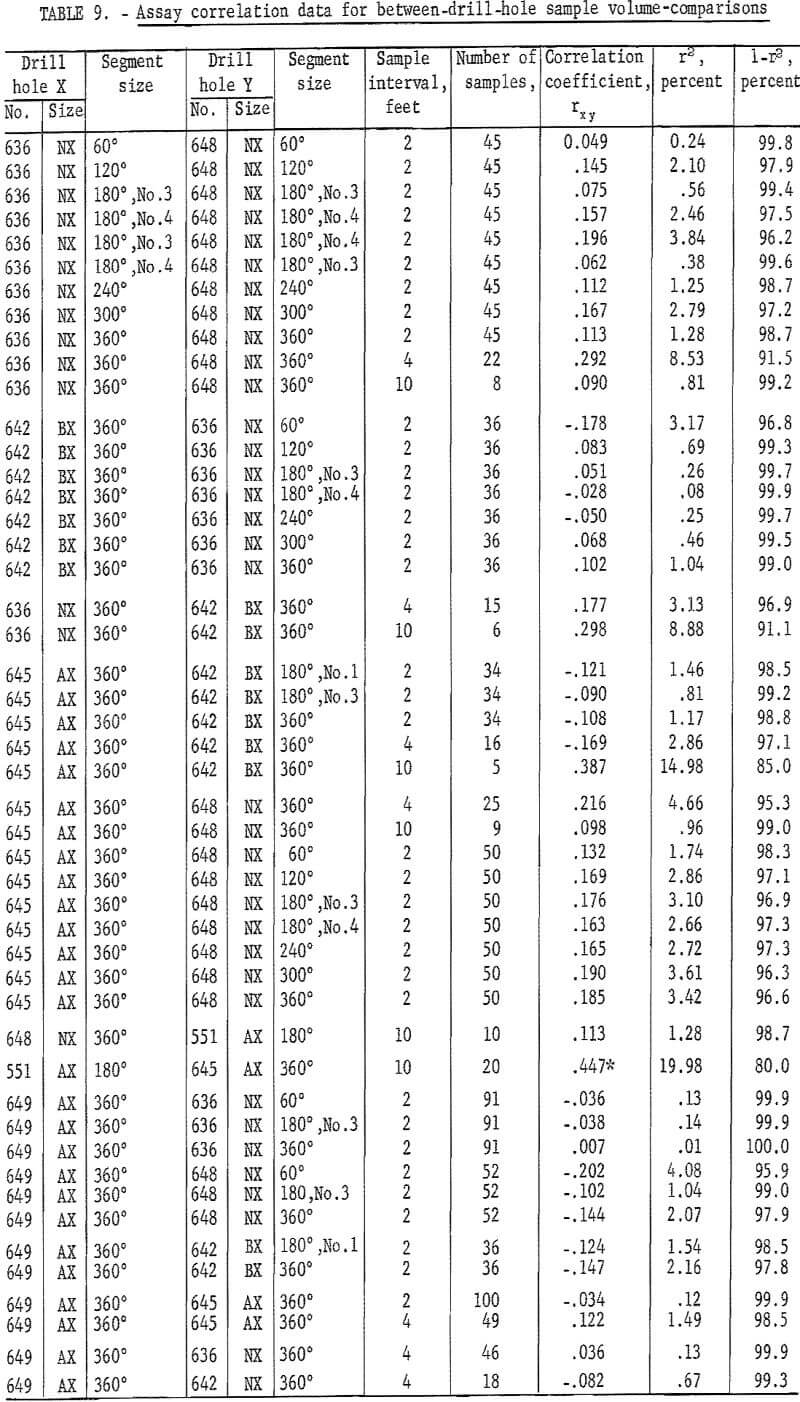
Table 9 gives the results of correlation computations for between-drill-hole sample-volume comparisons. Only one of the correlation coefficients for these between-drill-hole data is significant at the 95-percent level. This is the test for AX holes 551 and 645. These two holes, 645, a new hole drilled for the sampling experiment, and 551, an old drill hole, both have trend, because they are drilled out into the hanging wall which is in reality an assay wall with grade of ore gradually diminishing. The drill holes in these computations for between-drill-hole correlation, when grouped as pairs, NX 636-BX 642, NX 645-AX 648, and AX 648-BX 551-NX 645, are only 1 foot apart. However, when they are tested for between locations, for example, NX 636 and NX 645, they are approximately 1,200 feet apart.
Although there is evidence of independence along a drill hole (tables 1 through 7), the fact that there is virtually no correlation present between assays from drill holes 636 and 642, which are only 1 foot apart, is rather surprising. This indicates that assays only 1 foot apart in this area of the deposit and in this grade zone are actually unrelated; that is, the mineralization is so distributed that there is no justification for extending the area of influence of any single assay more than 1 foot. Since this deposit is composed of mineralization in quartz filling fractures in a brecciated zone, the correlation and mean-square-successive-difference tests indicate that the mineralized fractures are short; that is, they end abruptly in a short distance, they do not have continuity. Each cubic foot of rock is an assay-value sense is unrelated to each other. Therefore, if a cross section were being made in this area to estimate grade of ore between two drill holes that are more than 1 foot apart, the best estimate of grade of ore between the drill holes would be the average of the assays that pertain to the population of assays within the section.
Cebolla Greek Titaniferous Iron Deposit
In 1957 the Bureau of Mines contracted for the drilling of three NX diamond-drill holes in the Cebolla Creek deposit. Two of these holes, although widely separated, tested the deposit at depth, and selected intervals of the NX core were used to investigate the adaptation of statistical analysis to the sampling of mineral deposits.
The Cebolla Creek titaniferous iron deposits occur in a complex alkalic stock with a central core of carbonatite. Pyroxenite underlies an area of 8 square miles and the stock involves approximately 12 square miles. Minerals formed by hydrothermal alteration and accessory sulfides are widely distributed in the stock. Titaniferous iron occurrences are restricted to these varieties of pyroxenite rich in magnetite and perovskite and commonly associated with ilmenite, apatite, and biotite.
A section of drill hole 1 (210 to 340 feet) which, by visual examination, was considered as being typical of core from the drill hole, and two sections from drill hole 3 (104 to 236 feet representative of altered mineralization, and 628 to 760 feet representative of unaltered mineralization) were selected for the sampling investigation. Examination of the core indicated a possible lenslike structure with changes of grade of ore related to this apparent structure. Cores from the first of these sections from holes 1 and 3 were prepared and sampled according to the same procedure used for NX core at Climax (fig. 3). The bottom section from drill hole 3 (628 to 760 feet) was cut into 2-foot core lengths, but it was not subdivided further. Assays were obtained for total iron and titanium, as TiO2, for each of these three 2-foot- core sample intervals and for the 4-foot core sample intervals from the rest of these two drill holes.
Mean-Square-Successive-Difference Tests
Table 10 lists the results of the mean-square-successive-difference tests for the titanium and iron assays from various combinations of samples from the Cebolla Creek deposit when sample volume is increased with each successive combination of sample interval length. A sample interval length of 28 feet for titanium and 24 feet for iron is necessary before independence is indicated by the tests for the 4-foot samples from drill hole 1. This would indicate these distances as the area of influence of titanium and iron assays, based on 4-foot NX core, in the vertical dimension for this drill hole. For some reasons, perhaps a periodicity in the sizes of ore lenses, tests for the 36-foot interval indicate that the assays are not independent for both titanium and iron.
The 4-foot sample intervals for NX core indicate that a 36-foot sample interval is required to show independence between successive assays in drill hole 3 for both titanium and iron. These results indicate a difference in mineralization between drill holes that are located about 1 mile apart.
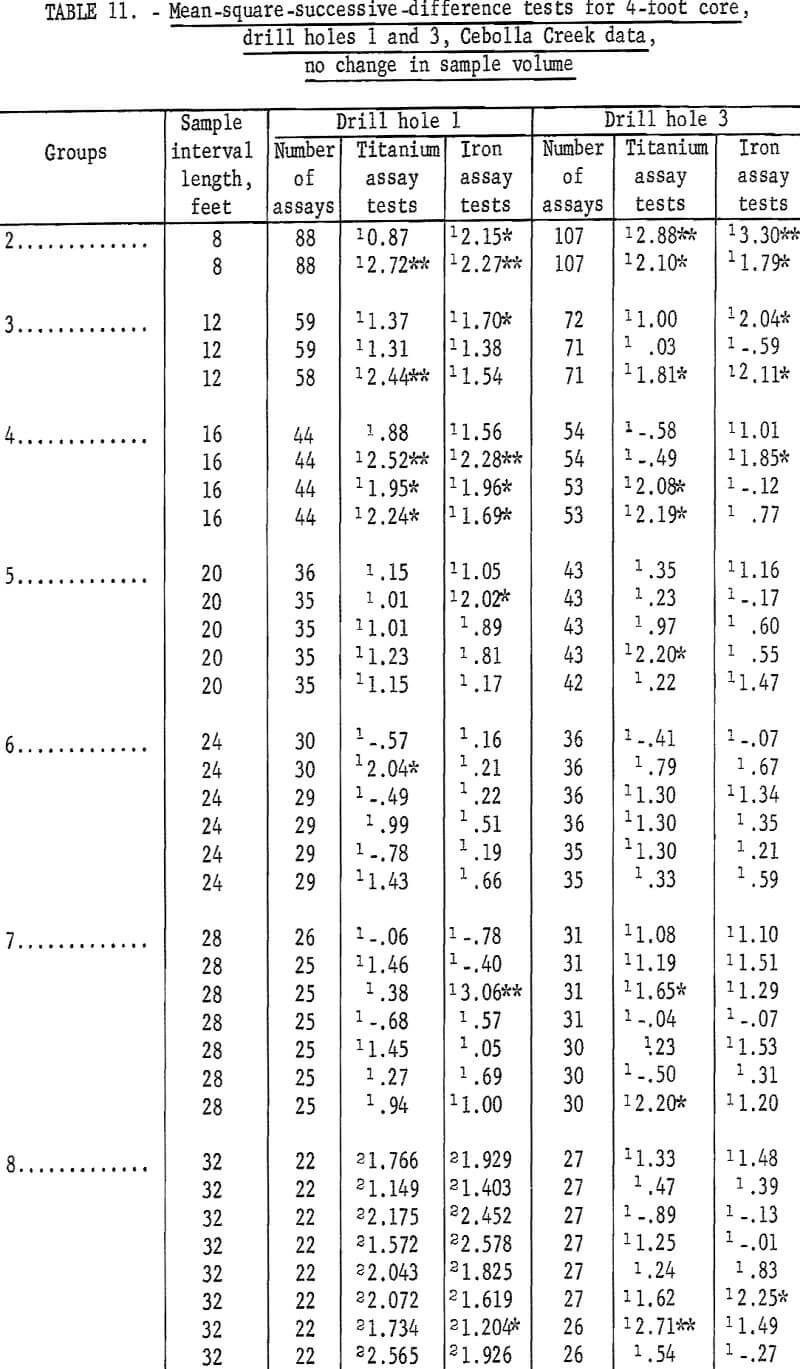
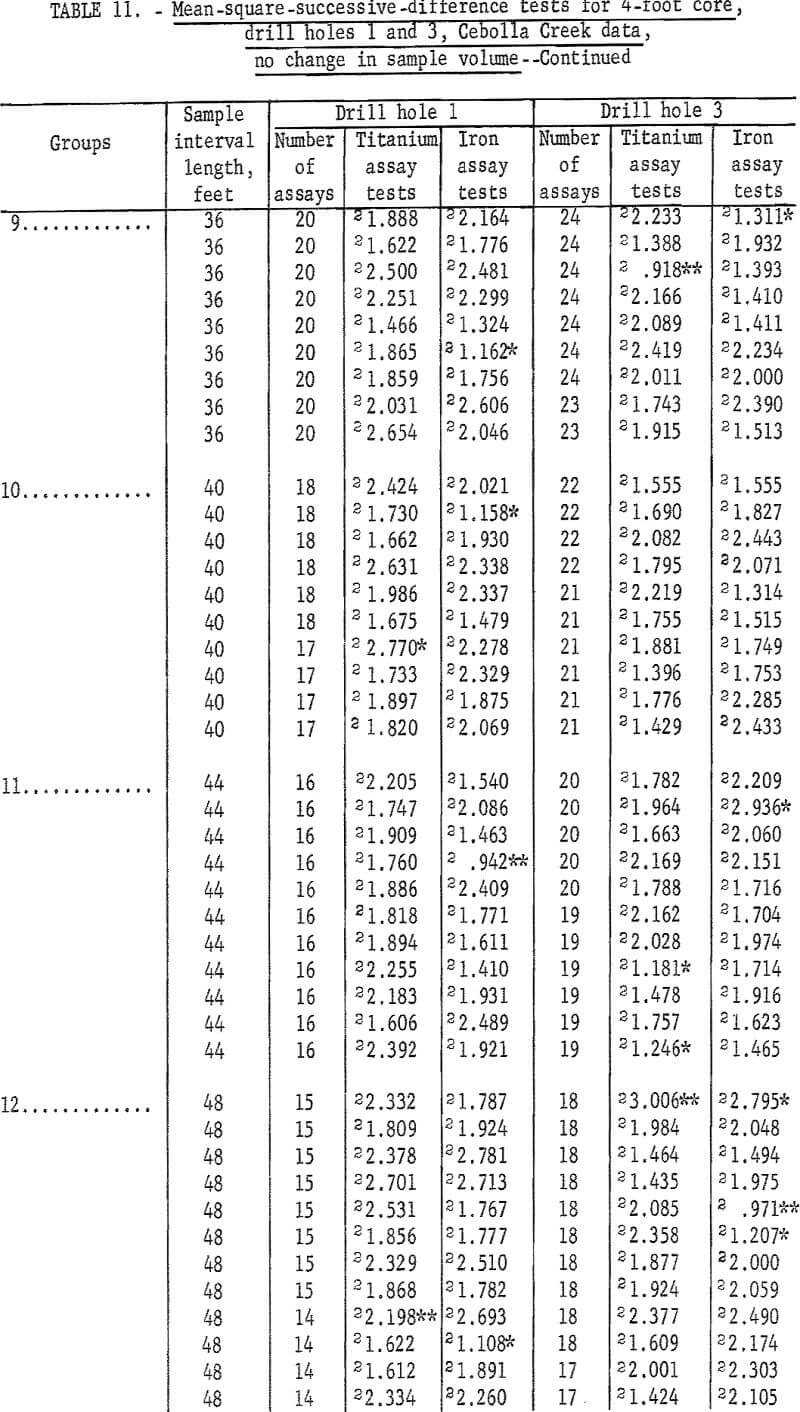
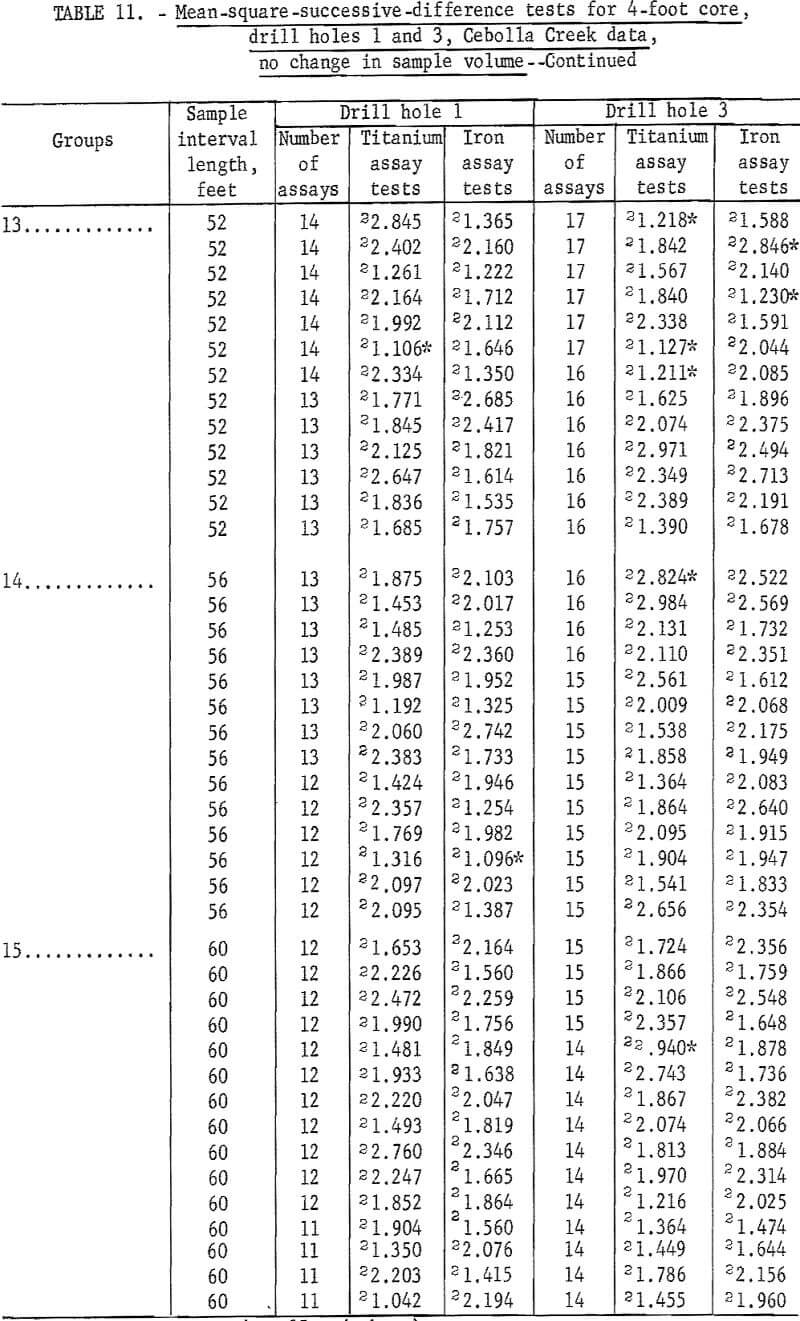
Data are given in table 11 for mean-square-successive-difference tests when 4-foot assays for titanium and iron from drill holes 1 and 3 are regrouped for new intervals of 8 to 60 feet without increasing sample volume. Test results indicate significance up to intervals of 20 feet for both titanium and iron for drill hole 1 and up to intervals of 20 feet for titanium and 16 feet for iron in drill hole 3. Test results for larger intervals show a few significant values, but no more than would be expected by chance alone for the 90-percent and 98-percent test levels.
Results of the tests for the specially prepared core from the selected interval of 210 to 340 feet in drill hole 1 are given in table 10. Both the 60- and 360-degree core segments require only a 4-foot sample interval to indicate independence for titanium assays. Although the 4-, 8-, and 14-foot sample intervals for both the 60- and 360-degree core segments show independence, it requires a 14-foot interval for the 60-degree segment and an 18-foot interval for the 360 -degree segment to produce a consistent test for independence for the iron assays from this selected interval. Thus, there is evidence of differences in mineralization within drill hole 1 because these selected core interval lengths are different from the 28-foot and 36-foot intervals found for the entire drill hole.
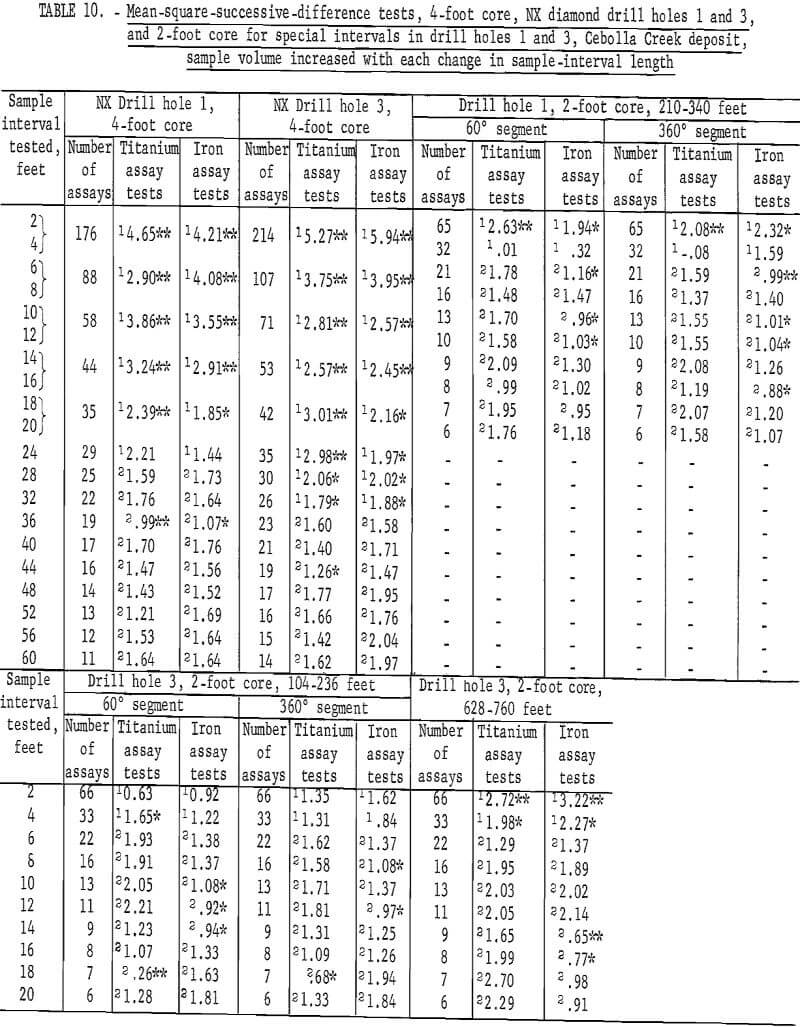
These results show smaller areas of influence for the assays from the 2-foot sample intervals, but the iron test results are more erratic for the smaller sample volumes. This tendency to erratic results should be expected because the larger sample volumes (4-foot intervals versus 2-foot intervals) tend to average out minor fluctuations which might show independence over a single shorter interval.
Data in table 10 give the results of similar tests for the specially prepared core from the selected interval of 104 to 236 feet in drill hole 3. This was the interval of core that was to represent altered material from hole 3. Except for the 18-foot interval for both the 60- and the 360-degree segments and for the 4-foot interval for the 60-degree segment, the titanium assays indicate randomness between successive assays. The iron assays are again more erratic for the test results with the 10-, 12-, and 14-foot intervals for the 60-degree segment and the 8-foot and 12-foot intervals for the 360-degree segment indicating that the assays for these intervals are not independent.
Results of tests for the data from the second selected interval in the lower portion of drill hole 3 (628 to 760 feet) are given in columns 14 and 15 of table 10. This interval of core was chosen because it did not show alteration in the mineralization. This selected interval was not cut into smaller segments so only the tests for 2-foot full-diameter core are given. The titanium assays show independence at an interval of only 6 feet. The iron assays are not independent for intervals of 2 and 4 feet and then for intervals of 14 and 16 feet. The other intervals indicate independence for the iron assays.
Since the tests are made at the 90-percent level of confidence, about 1 in 10 tests should not be independent by chance alone. This is approximately the results for the titanium tests for the two selected intervals, one in drill hole 1 and the other in drill hole 3. However, the tests for the iron assays indicate fewer independent results than would be expected by chance. This indicates that there may be some nonindependent periodicity in the iron mineralization, and the fact that the mean-square-successive difference tests are virtually all positive indicates that a long-period fluctuation may be present. The iron assay tests for the altered core in drill hole 3 were more erratic than the tests for iron assays from unaltered core deeper in hole 3.
Data for mean-square-successive difference tests for the Cebolla Creek special core sample assays when sample volume is not increased are given in table 12. Drill hole 1 data show only 3 out of 54 tests significant for titanium for the 60-degree segment; and only 4 out of 54 are significant for the 360-degree segment. There is one test significant at the 98-percent confidence level for iron assays from the 60-degree segment and 6 tests, four at 98-percent and two at 90-percent levels, are significant for iron assays from the 360-degree segment. Data for the interval from 102 to 236 feet in drill hole 3 show one test significant at the 90-percent level and three tests significant at the 98-percent level for titanium assays from both the 60-degree and 360-degree segments. These results for significant tests are more than would be expected as a result of chance alone for the 98-percent level when the 54 tests are considered. It also is less than would be expected at the 90-percent level.
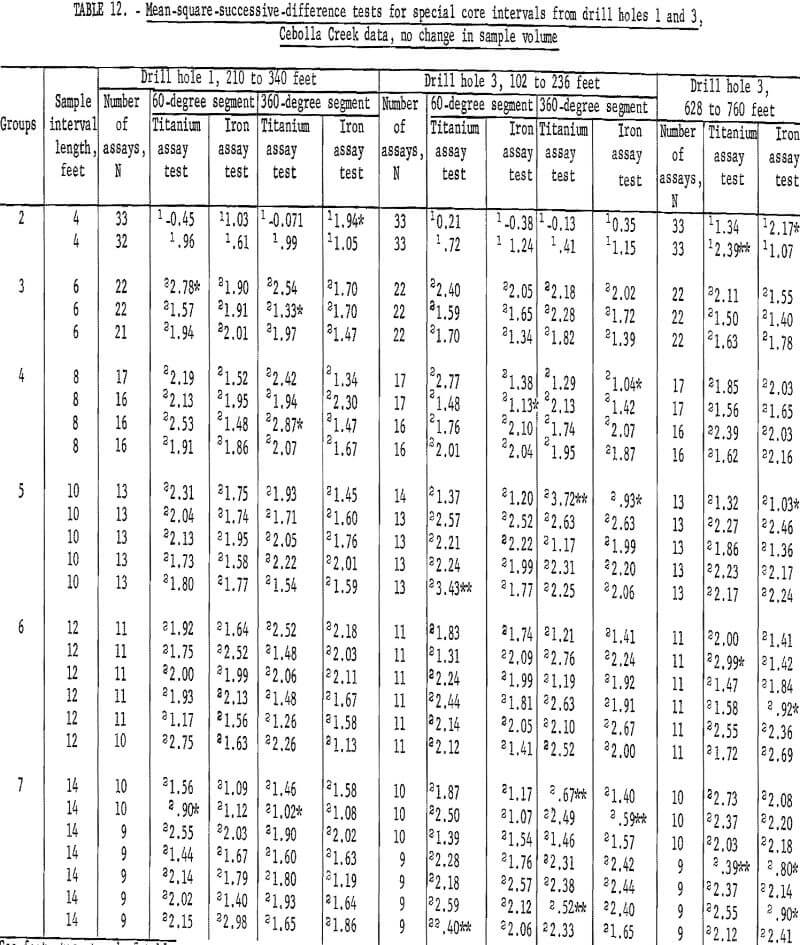
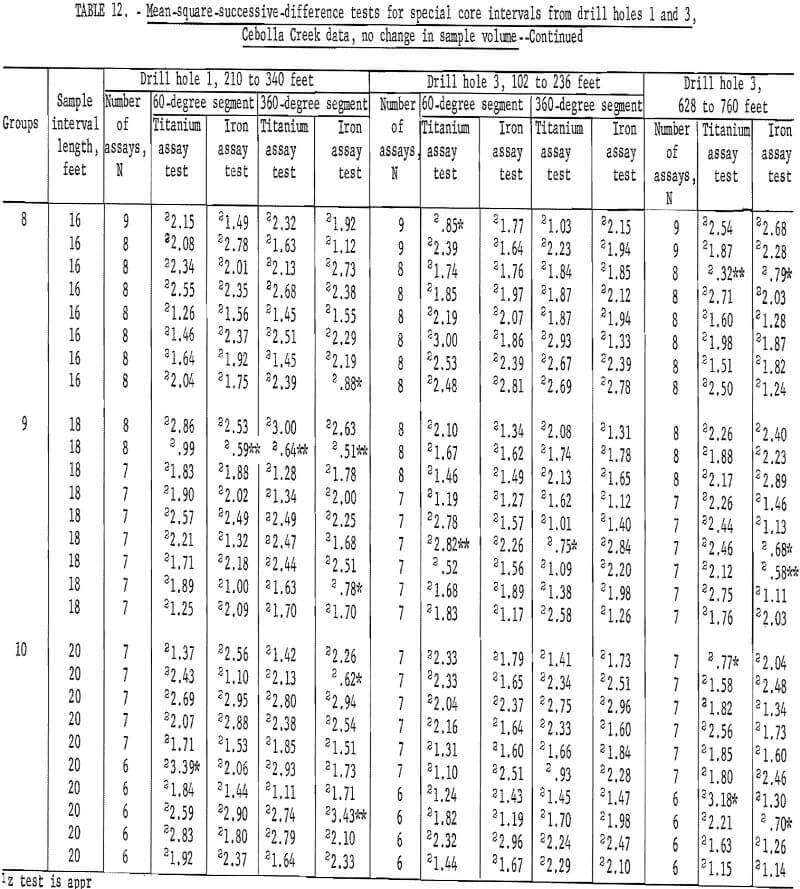
There is only one test significant at the 90-percent level for iron assays from the 60-degree segment; there are two tests significant at the 90-percent level and one test significant at the 98-percent level for the 360-degree segment iron assays from the 102- to 236-foot interval from drill hole 3.
For the 628 – to 760-foot interval from drill hole 3, there are three significant tests for titanium assays at both the 90-percent and the 98-percent levels. There are eight significant tests for iron assays at the 90-percent level and one significant test at the 98-percent level for iron assays. This is more than would be expected by chance along in a series of 54 tests.
Comparison of tests for the top and bottom intervals in drill hole 3 indicate some differences in mineralization, especially in the iron assays. However, for all the data, scattering of the significant test results throughout the various intervals suggests that there may be some influence of trend or periodicity in the data that builds up in a single grouping to produce significance, rather than significance resulting from a consistent influence indicating nonrandomness for a consecutive series of tests at some interval. If the data were not independent, there should be a run of significant tests results at the shorter sample-interval lengths with a few nonsignificant tests. Since the reverse is indicated, it is believed that the sprinkling of significant tests throughout the various intervals is a result of differences in mineralization which tend toward a periodicity in values. As a consequence, certain sample-interval lengths coincide with the periodicity and these groupings produce the significant tests. This could result because of the shifting of the starting points for the first assays of the groupings where no change in sample volume is included. Also, where sample volume is increased by averaging assay groups, the midpoint of the averaged new sample interval length is at a different point.
Correlation
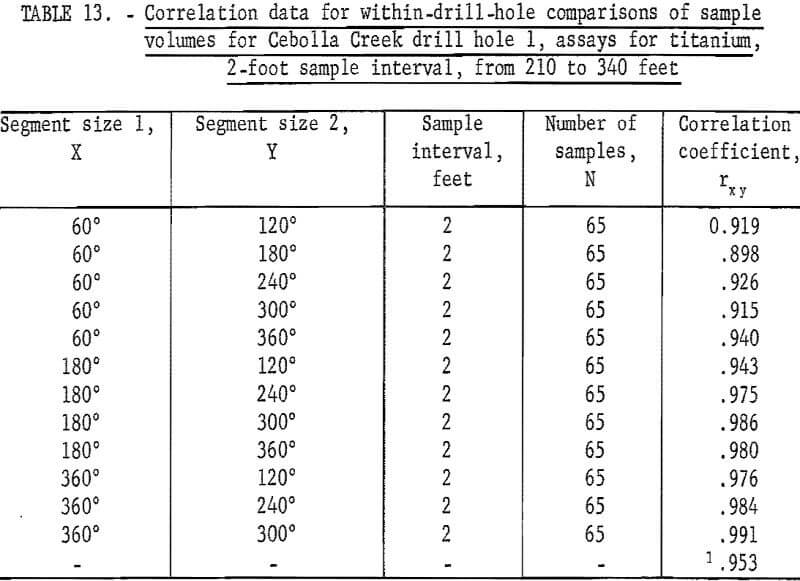
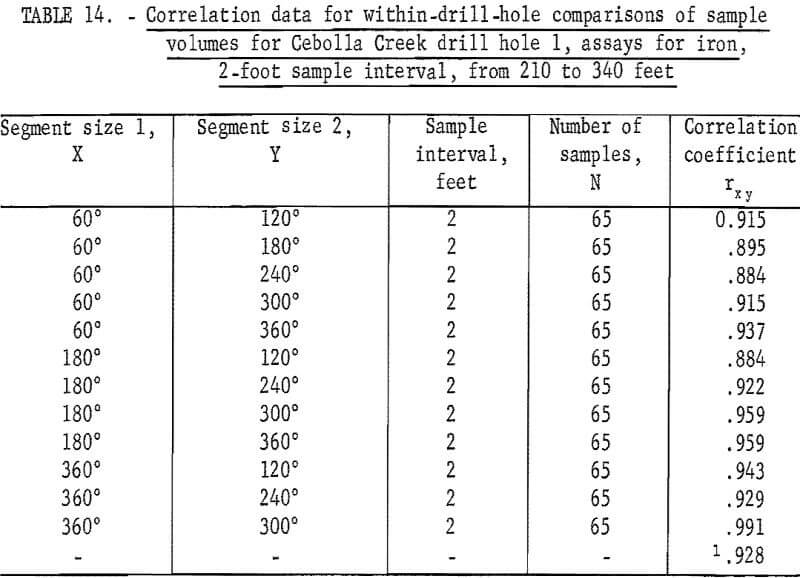
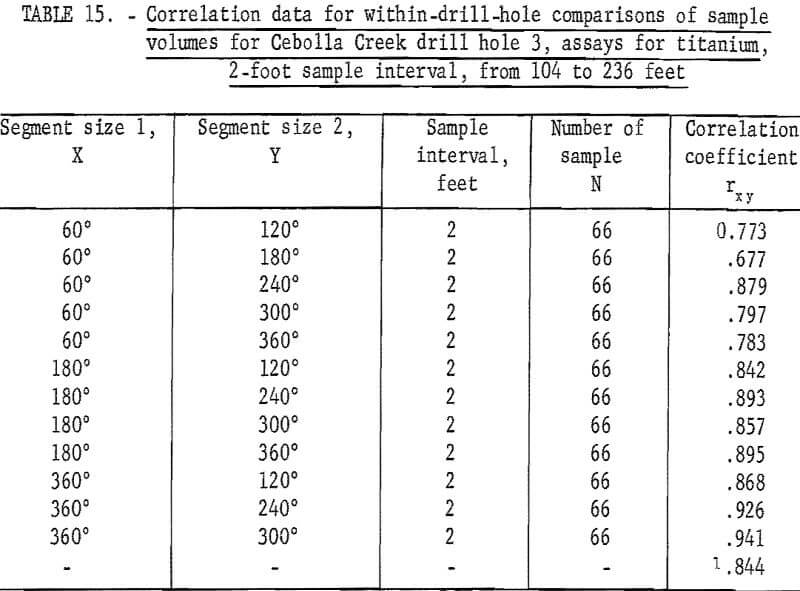
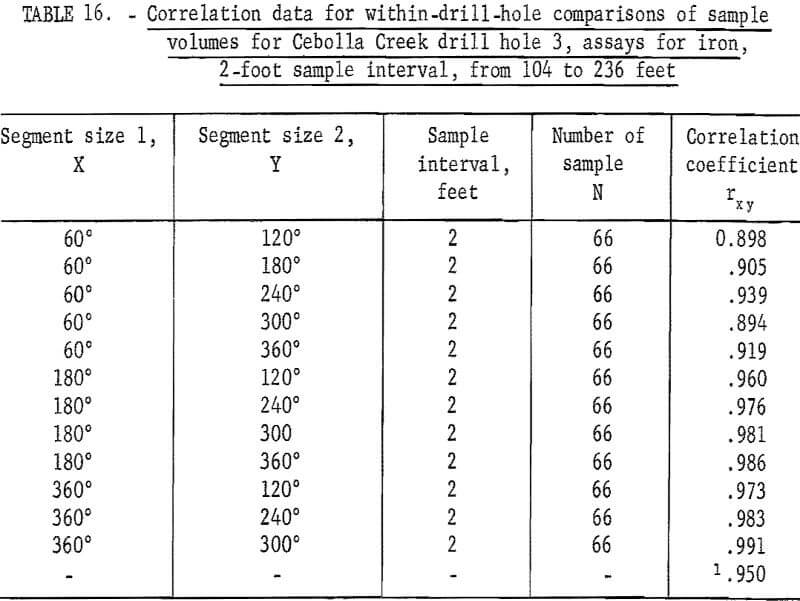
Berkenkotter has shown that the assays for titanium and for iron from Cebolla Creek are correlated on a within-drill-hole basis. These results are shown in tables 13 and 14 for drill hole 1, and in tables 15 and 16 for drill hole 3. Because of the method of sample preparation for the sawed and split sample segments, the 60-, 120-, and the 180-degree sample segments should be independent with respect to sample preparation, whereas the larger (240-, 300-, and 360-degree) volumes, which are composed of splits of the material from the smaller volumes, could be nonindependent as a result of sample preparation.
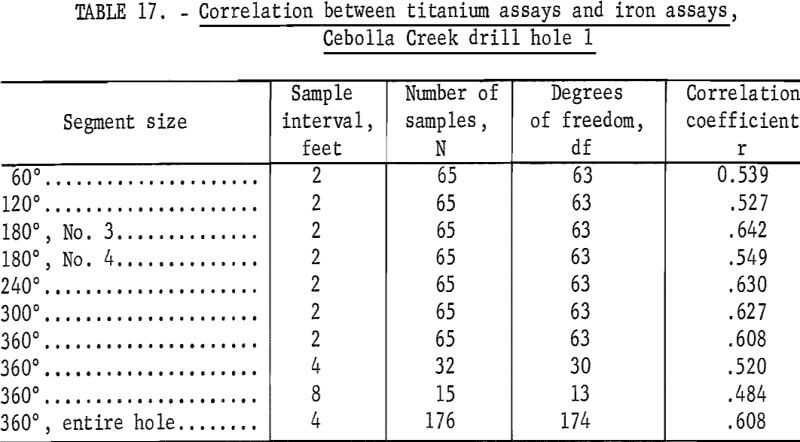
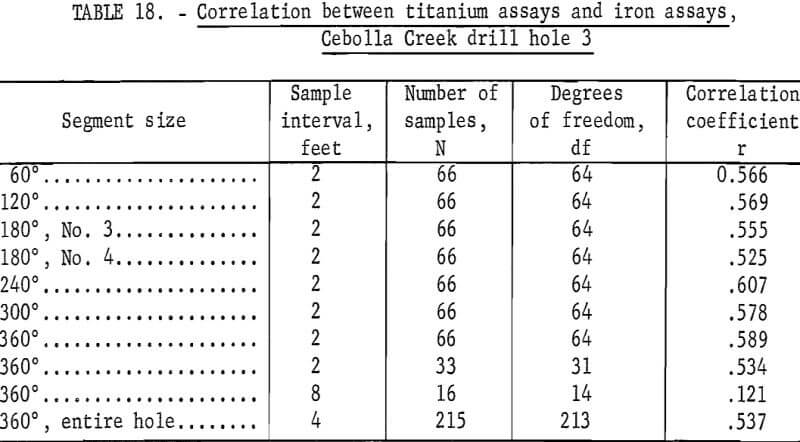
Tests also show that the titanium and iron assays are correlated with each other (tables 17 and 18), although the correlation is not very high.
San Manuel Copper Deposit
A statistical analysis has been made, of churn-drill and underground diamond-drill sample data from a selected area within the North ore body of the San Manuel copper deposit. The surface churn-drilling was performed by the Bureau of Mines and by a private company during the exploration and development of the deposit. The underground AX-size diamond drilling was performed by the operating company after the deposit was brought into production. Sample data were furnished by officials of the San Manuel Copper Corp. for the original study and are used here for this additional investigation.
Mean-Square-Successive-Difference Tests
Table 19 gives the results of the mean-square-successive-difference tests for assays from the 3 churn-drill holes and from the 2 diamond-drill holes selected for this investigation. These holes were selected rather arbitrarily; the only prerequisite set for the churn-drill holes was that they should be on the same section (fig. 7). The diamond-drill holes were the first 2 in the group of 12 holes (fig. 8). It is of further interest in interpreting the results of the tests that the diamond-drill holes were drilled at +19 and +24 degrees from the horizontal. These holes are roughly at right angles to the churn-drill holes and give a reasonably good test of the area of influence in a second dimension. The tests indicate nonindependence up to distances of 50 feet, the depth of the holes. These two diamond-drill holes are situated on either side of the 600 West section which includes the 3 churn-drill holes. One other diamond-drill hole was drilled near this 600-West section, but it was at a high positive inclination and would not test the area of influence normal to the churn-drill holes.
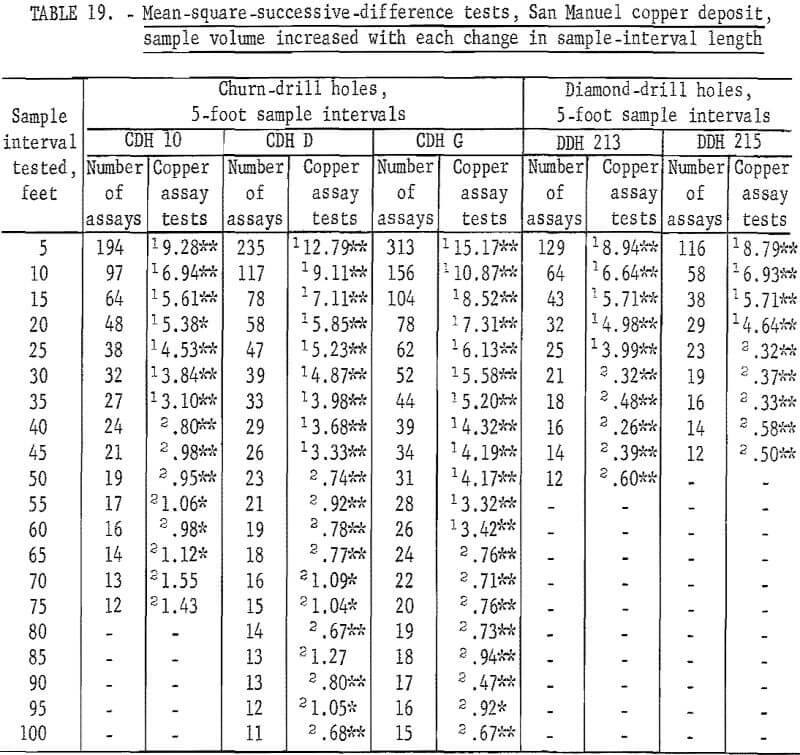
Results of the mean-square-successive-difference tests show that only churn-drill hole 10 even approaches an acceptable test for independence within the limits used for the tests, and this drill hole requires an interval of 70 feet to produce this evidence of independence between successive assays. Churn-drill holes D and G have areas of influence greater than 100 feet.
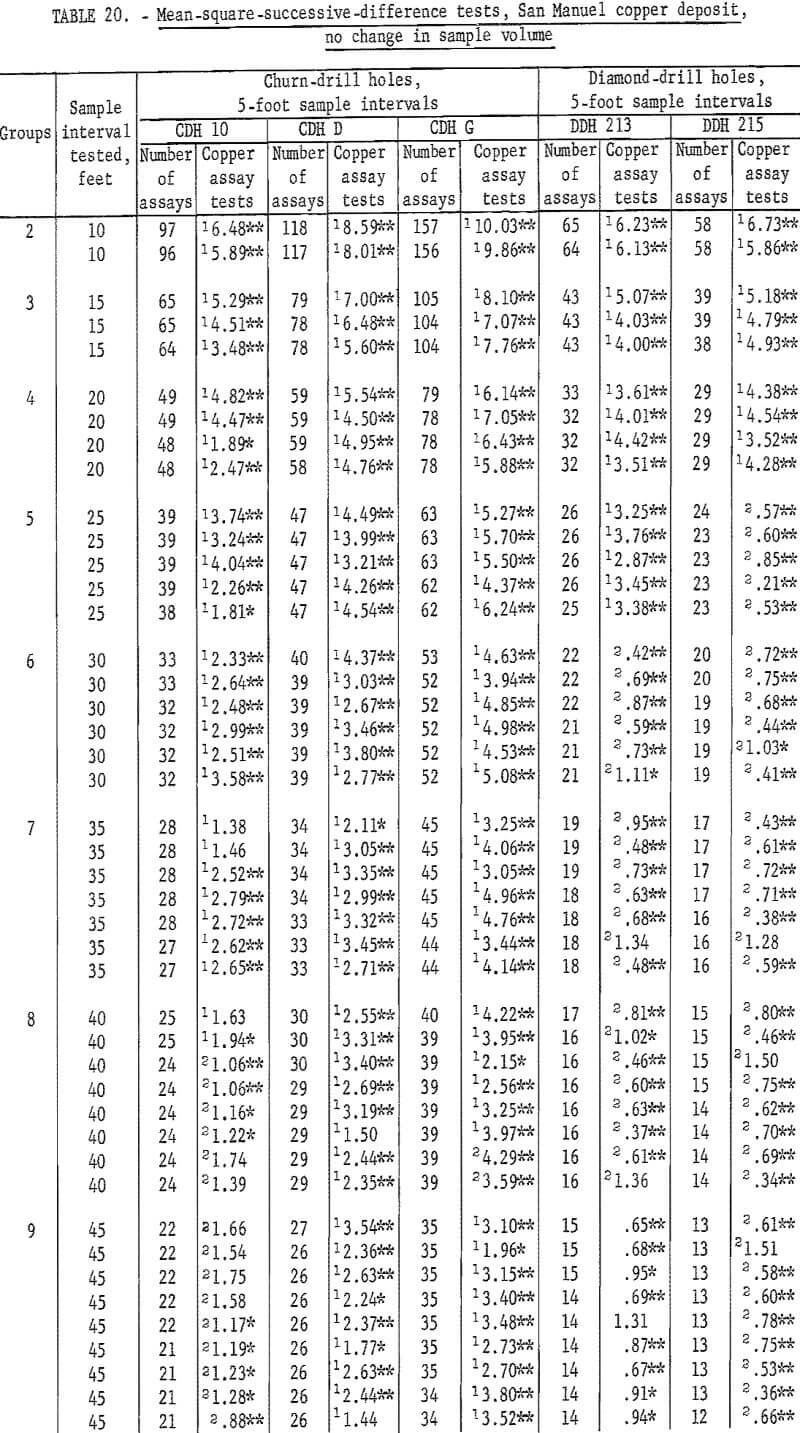
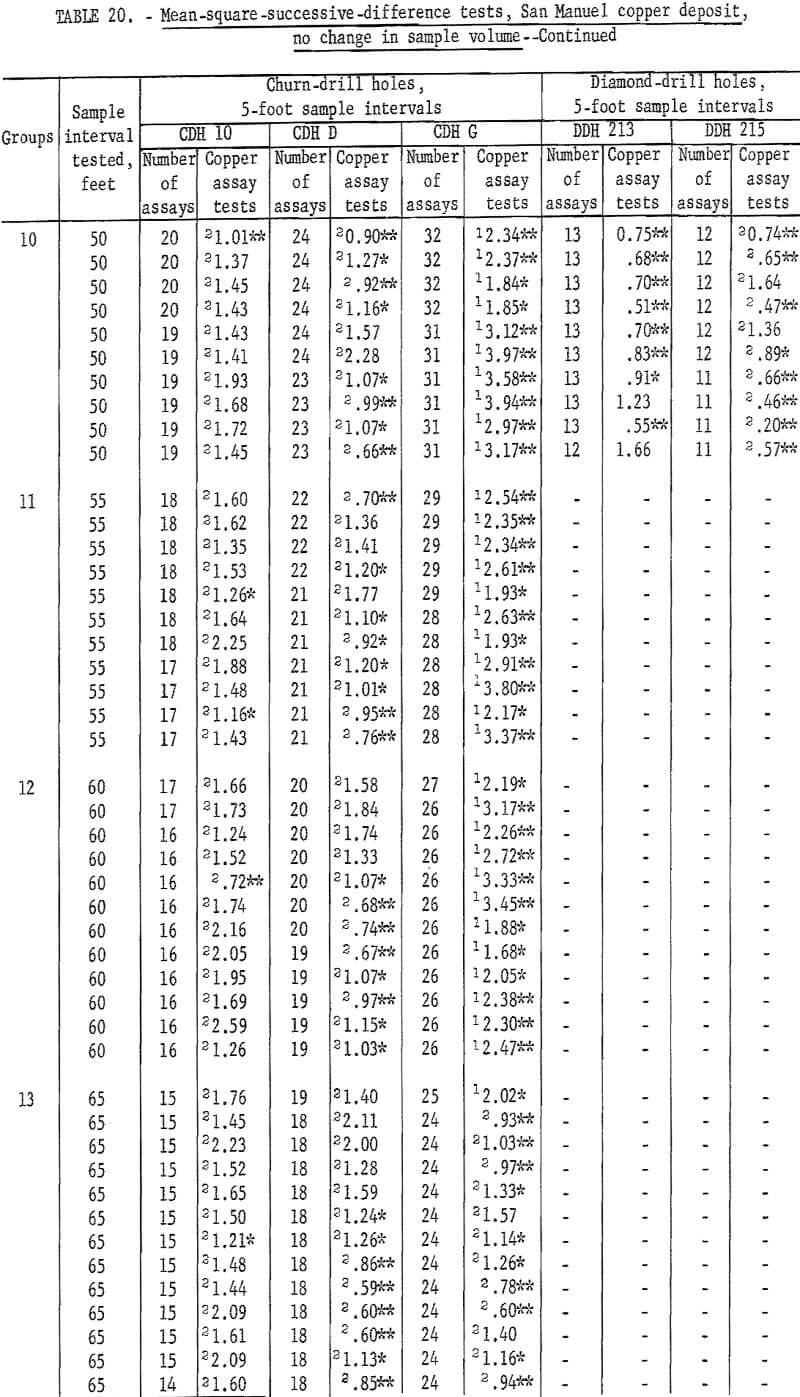
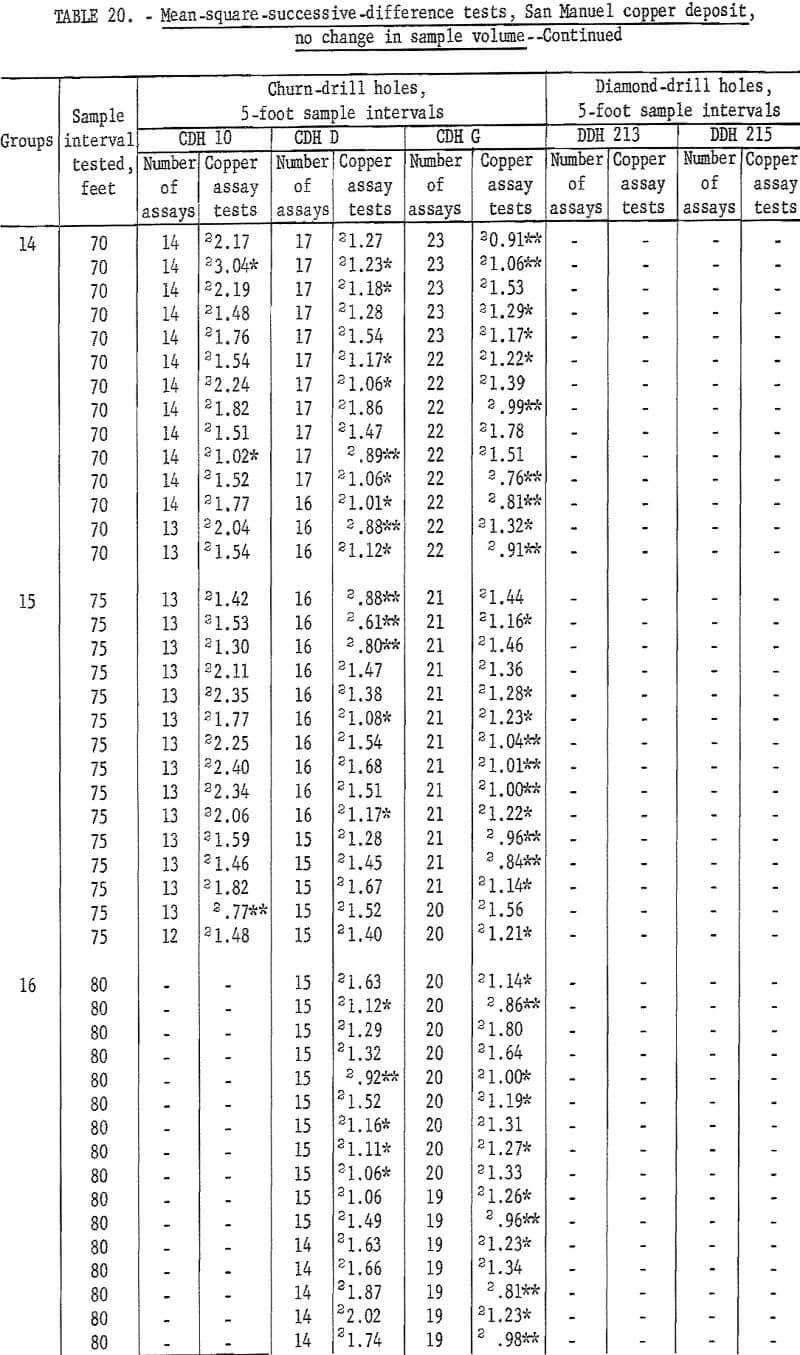
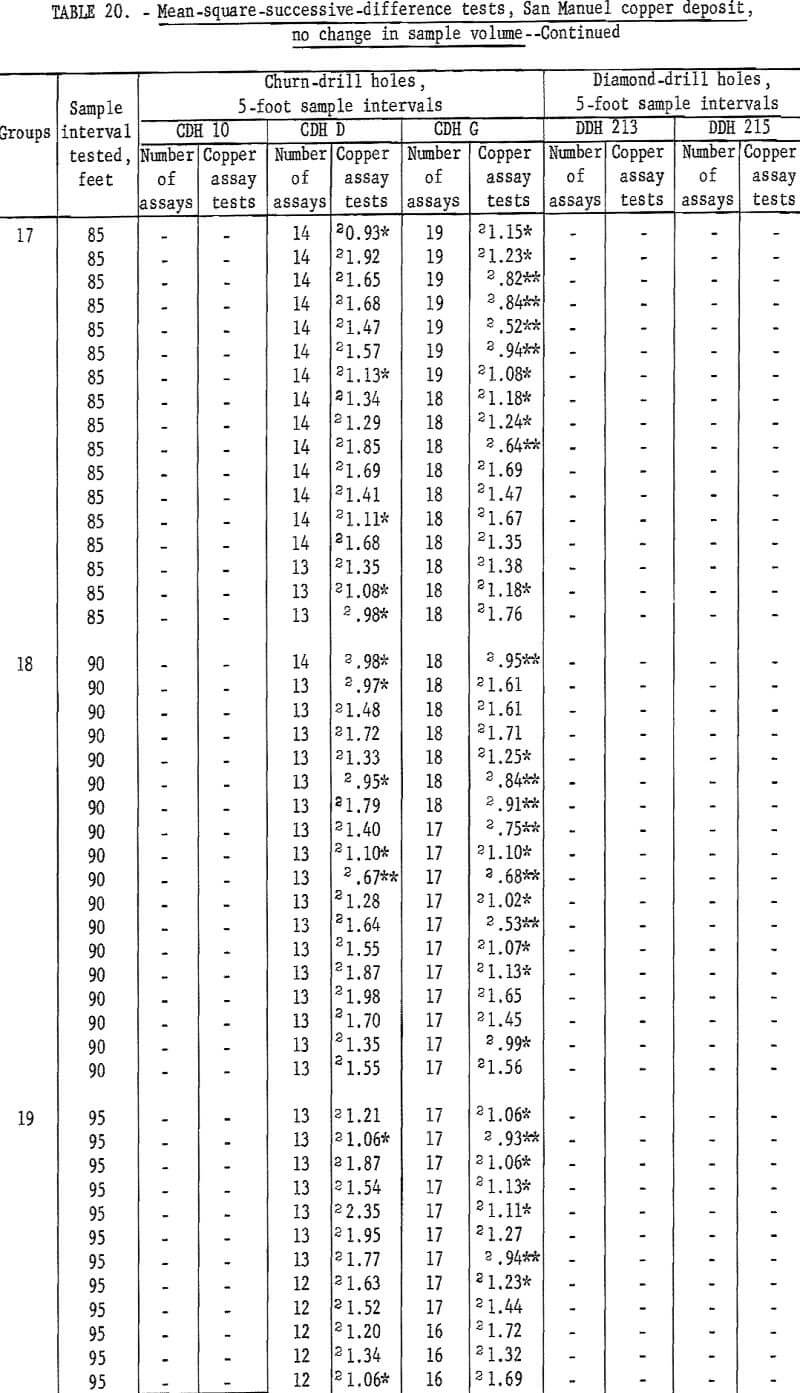
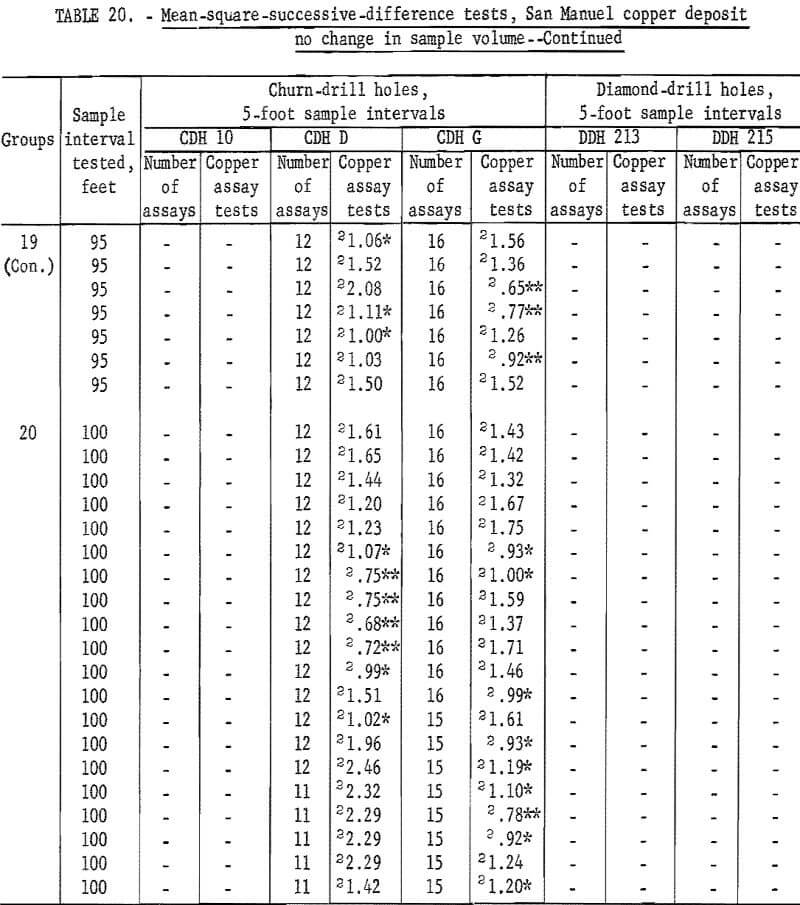
Results of tests for assay groupings involving no change in sample volume are given in table 20. Tests for independence are consistently significant for churn-drill hole 10 up to an interval of 50 feet. At 55 feet there are still two tests significant at the 90-percent level out of 11 tests. This is slightly high for acceptance. However, from 60 feet on to 70 feet the tests are acceptable as indicating independence for the assay groupings. Similar results are noted in table 19 for hole 10 where significance changes from the 98-percent level to the 90-percent level at a 55-foot interval, and independence is indicated at a 70-foot interval. Thus, the tests for the two methods of grouping are consistent even if they are not exactly alike as to the interval indicating independence.
Tests for churn-drill holes D and G as shown in table 20 show some evidence that the sample interval for producing independence is being approached at the 100-foot test interval. These results for holes D and G are more informative in
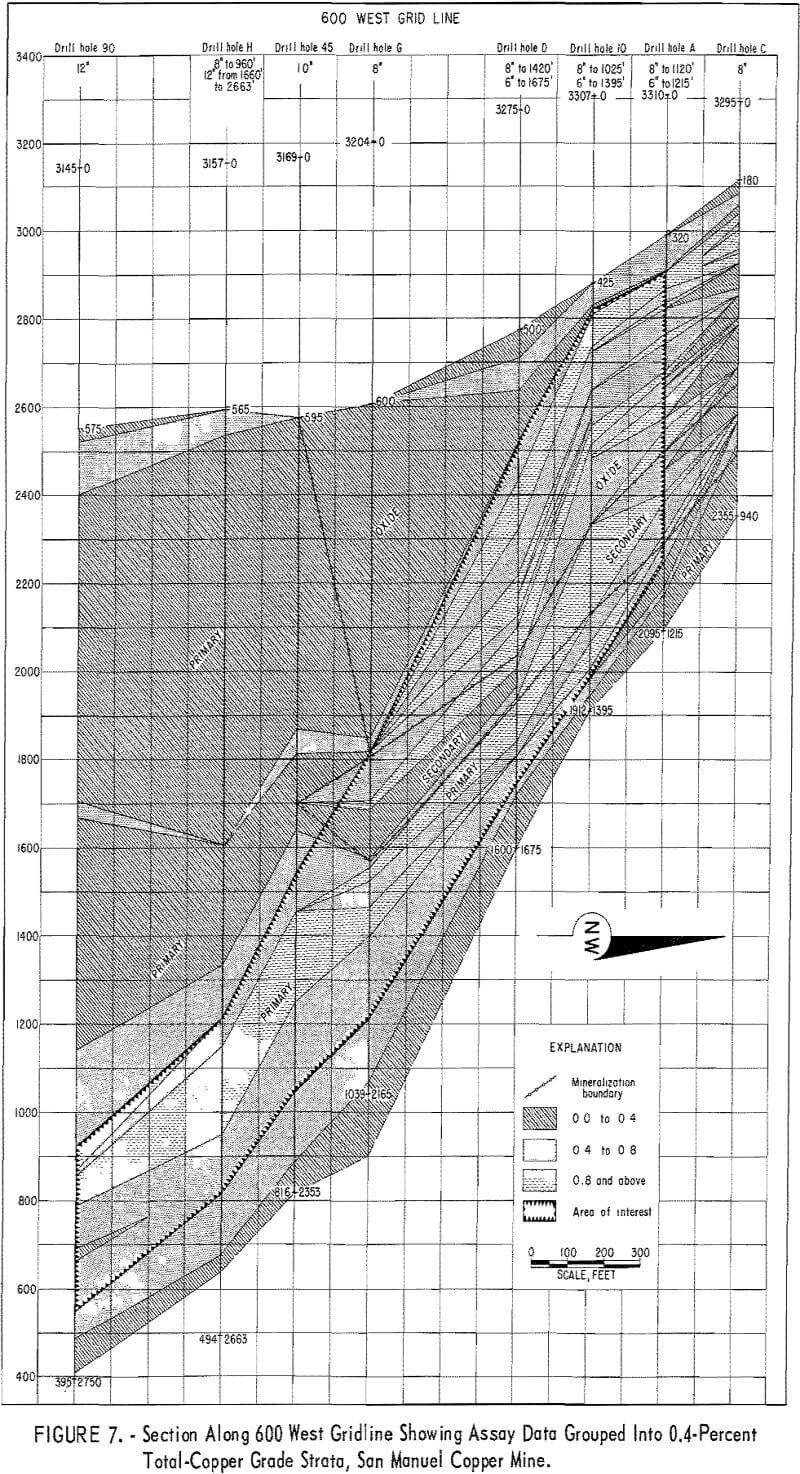
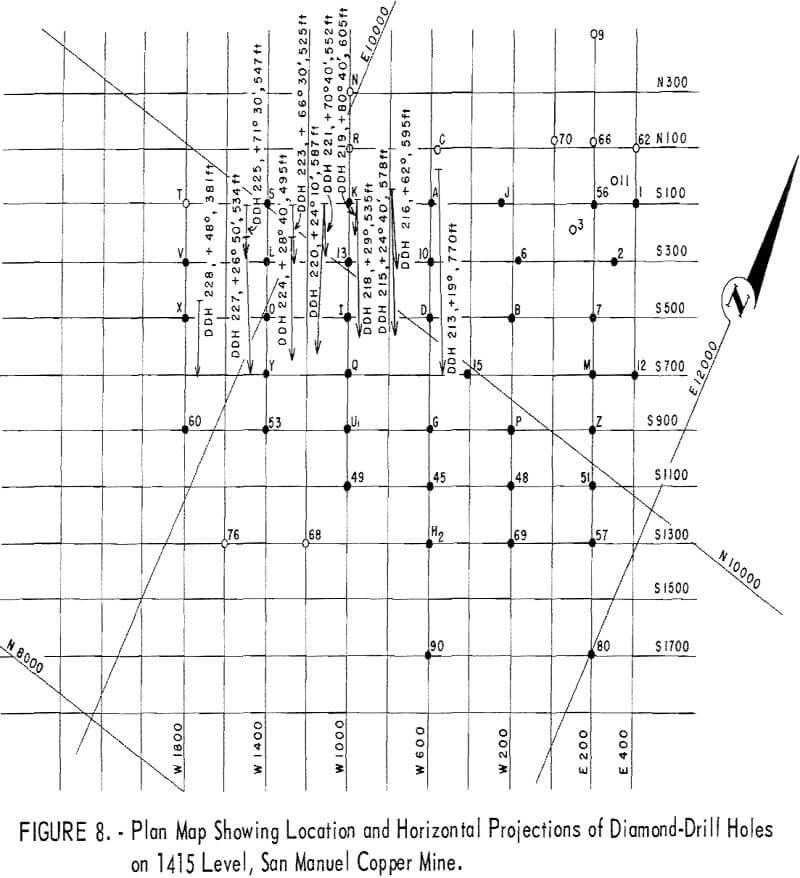
table 20 than in table 19, because the groupings for no change in sample volume, table 20, show many test values for each interval and give more of an average result than the single test value in table 19.
The new tests for the diamond-drill holes do not indicate any improvement for those results shown in table 19.
Churn drilling at the San Manuel North ore body was on a 200- by 400-foot grid. Holes 10 and D are 200 feet apart on the section shown in figure 7; however, hole G is 400 feet from hole D. Thus, hole 10 with its indicated area of influence of at least 70 feet and hole D with its indicated area of influence greater than 100 feet, should provide the possibility of demonstrating continuity of assays between the holes which are 200 feet apart.
Correlation
Diamond-drill holes
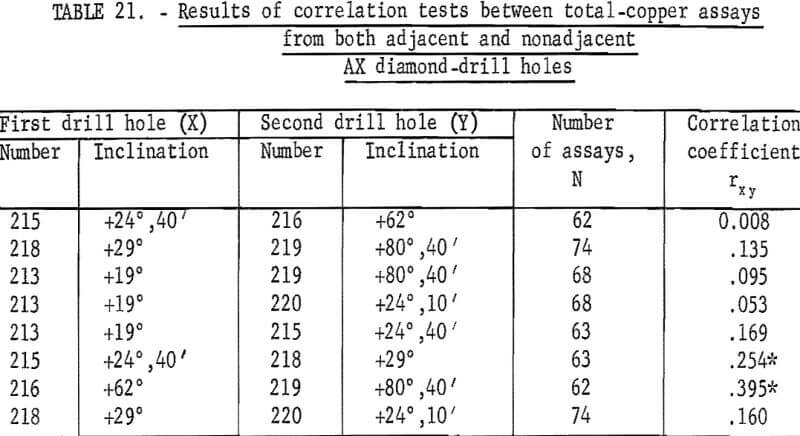
Tests for correlation of assays between diamond-drill holes were made and the results are given in table 21.
With the exception of the tests between holes 215 and 218 , and 216 and 219, the correlations are all nonsignificant statistically. These results, which indicate virtually no correlation and, therefore, independence of assays between drill holes, is contrary to the findings of the nonindependence along diamond-drill holes 213 and 215 (table 19). This would indicate differences in correlation and independence for the two dimensions along the drill hole and between parallel drill holes. Also, the differences may be a result of orientation of the mineralization at some angle to either one of the two dimensions tested.
Churn-drill holes
The published report on the analysis of sample data from the San Manuel North ore body notes that grouping the assays by drill holes into 0.4- percent total-copper grade strata (fig. 7) makes it possible to match these grade strata from hole to hole and thus provide evidence of continuity of mineralization between drill holes. However, grouping the assays within drill holes into 0.2-percent-total copper grade strata resulted in very small lenslike groups, and little continuity of strata between drill holes could be demonstrated except in the low-grade primary zone near the bottom of the holes.
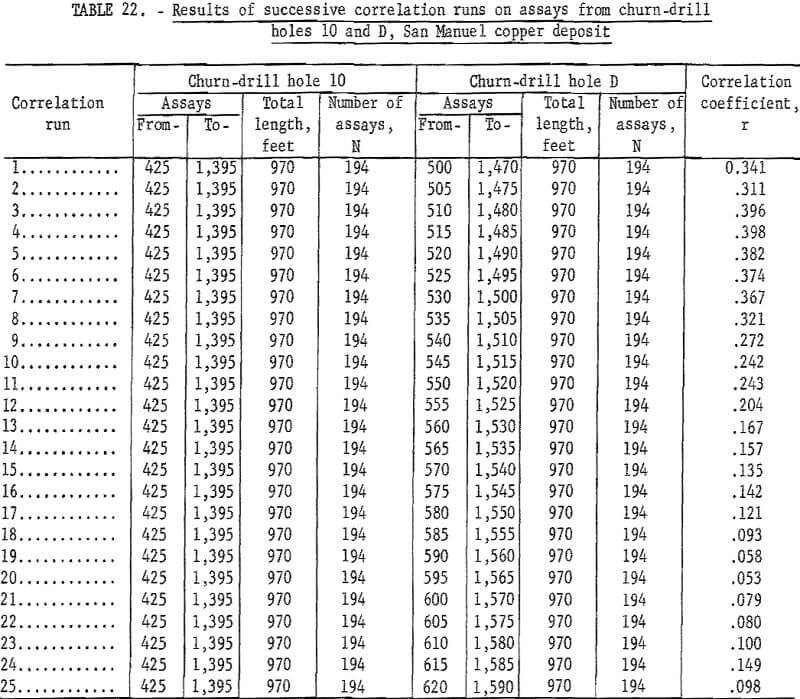
In the present investigation a somewhat different technique was tried. This is adapted from Smith who used it effectively to match bedding characteristics in oil shale. Figure 9 is a schematic layout of the procedure. Assays from one drill hole (hole 10 in this example) are set up as a constant sequential group. This constant group of assays is then correlated with some selected similar grouping of assays in an adjacent drill hole. This procedure assumes that lenses, beds, or sheeting of mineralized material of nearly equal thickness exists in a roughly parallel pattern between drill holes. In figure 9, assays from 425 to 1,395 feet in drill hole 10 have been selected as the constant or standard group containing 194 assays. Similarity in grade of mineralization and geologic logging of the core indicate that drill hole D has a similar grouping beginning at 500 feet. Accordingly, 194 consecutive assays from hole D (500 to 505 through 1,470 to 1,475 feet) are matched with the 194 assays in hole 10 and correlation 1 is run. For the second correlation run, the first assay from the top of hole D (500 to 505 feet) is dropped and the next assay on the bottom (1,475 to 1,480 feet) is added to make up 194 assays. Successive correlation runs are made after rematching the new assays for each run. The resulting correlation coefficients are examined and the largest coefficient indicates the best matching of assays for the sample interval used. Unless there is good continuity of structure and/or
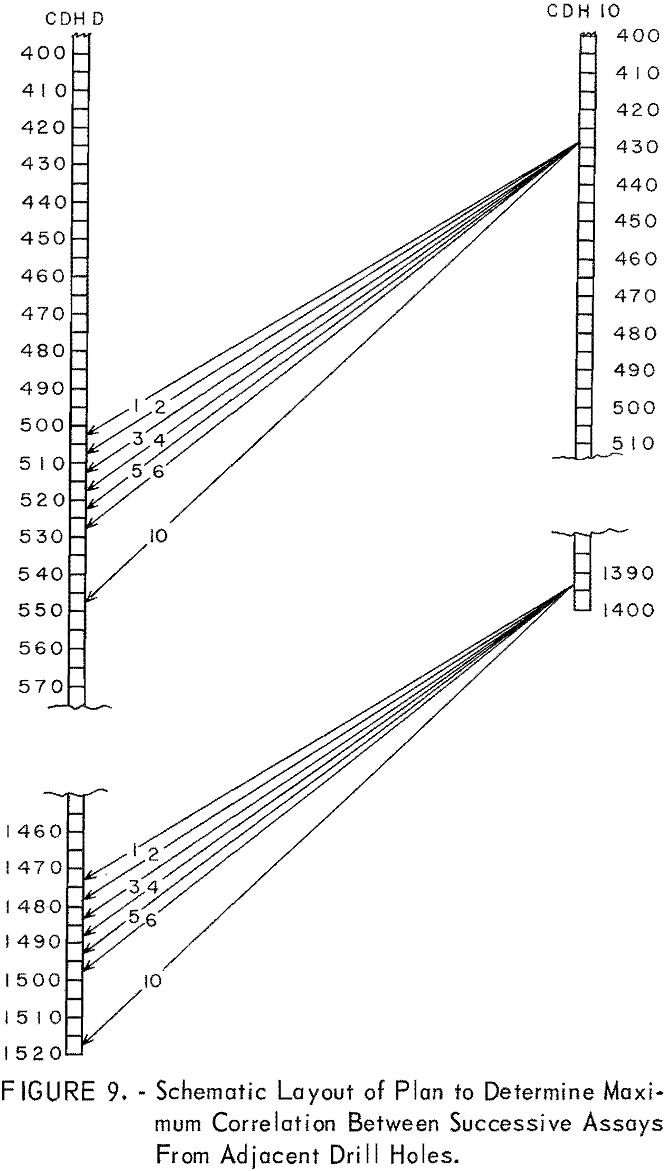
mineralization between drill holes, the correlation coefficients are apt to be small and not significant. Table 22 gives the results of a series of correlation runs between churn-drill holes 10 and D. The highest correlation coefficient is found in run 4 which matches the assay for sample interval 425 to 430 feet in hole 10 with the assay for sample interval 515 to 520 feet in hole D. The correlation coefficient of 0.398 for 194 assays is significant in a statistical sense. An examination of figure 7 indicates that this is a logical correlation if the grade strata in figure 7 are correct. The examination also shows that almost any grouping that matches assays within a few intervals of those given in correlation 4 should give about as good a correlation. This is borne out by the correlation coefficients in table 22. A series of 42 successive correlation runs actually were made, but only the first 25 are shown in table 22. The remaining runs resulted in very low correlation coefficients.
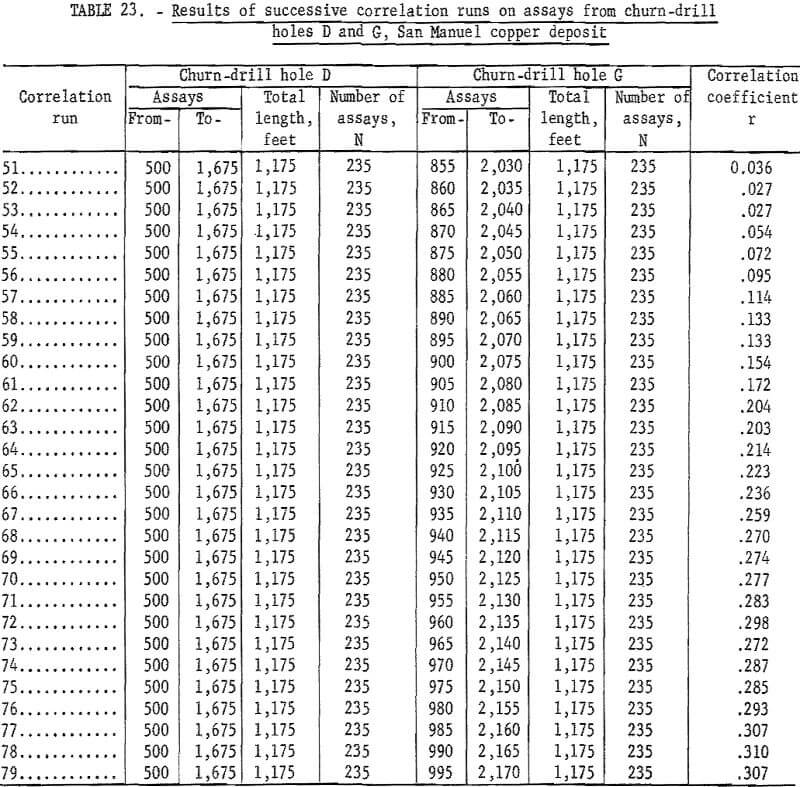
Table 23 gives the results of similar successive correlation runs for assays from churn-drill holes D and G. Hole D is used as the constant and G assays are varied. Only runs 51 through 79 are recorded in the table. Actually, hole G was started at 600 feet and the correlation coefficients were negative and very low until run 27. The coefficients remain low even in run 51 where the data are picked up in table 23. Even though the two drill holes are 400 feet apart, the resulting correlation coefficients increase to run 78. This matching is not too unrealistic in view of the grade strata shown in figure 7.
The results of similar correlation runs for churn-drill holes 10 and G are given in table 24. A total of 120 runs were made and run 96 matching the intervals 425 to 1,395 feet in hole 10 with 1,075 to 2,045 feet in hole G gave the highest correlation coefficient. Runs 85 to 110 are listed in table 24.
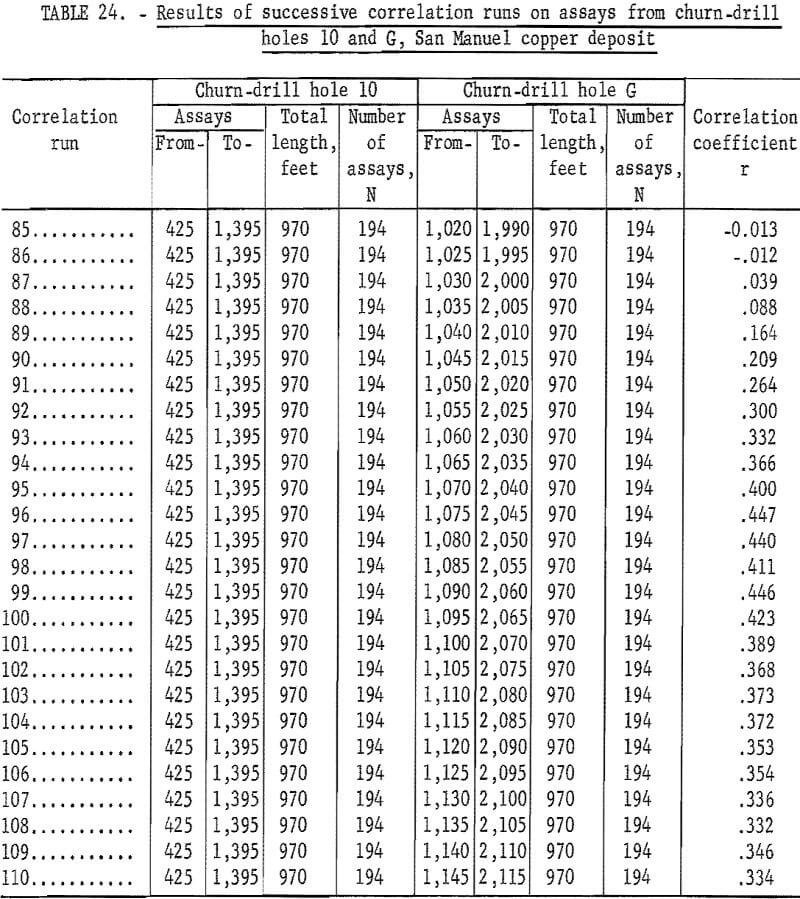
The results of these correlation runs give an interpretation as to the dip of the mineralization and its continuity between drill holes. This can be highly useful during exploration drilling and in evaluating the results of a drilling campaign.
Piedra Hueca Copper Deposit
During exploration of the Piedra Hueca copper deposit, management decided to do some large-scale test sampling by driving two crosscuts about 100 meters apart through part of the deposit. First, NX diamond-drill holes were drilled horizontally along the line of advance of the two crosscuts so that comparisons could be made between assays from the NX core and from the crosscuts. Core recovery was 100 percent. Crosscut rounds were carefully measured for advance of each round and then an equivalent footage of NX core was sampled for the assay comparisons. Each entire round was run through a crushing and sampling plant. From each round in the crosscuts, 15 to 20-pounds of crushed muck ended up in the final split selected for assaying. This material was pulverized, mixed, and two samples were split out for duplicate assays. These samples were sent to separate laboratories for assays. One group has been designated as H-1 and the other as U-2. The NX core was split and one-half of it was sent for assay. The two crosscuts were numbered 650-EAST and 750-EAST.
Mean-Square-Successive-Difference Tests
Results of the mean-square-successive-difference tests for the 650-EAST cross-cut H-1, U-2, and diamond-drill hole assays are given in table 25. Measurements are given in meters. Only the 16-meter interval for the 650 EAST H-1 and U-2 assays indicate independence. This result could easily be a chance occurrence particularly since all the other 28 tests indicate nonindependence. Thus the area of influence of an assay in this dimension of the deposit is more than 20 meters.
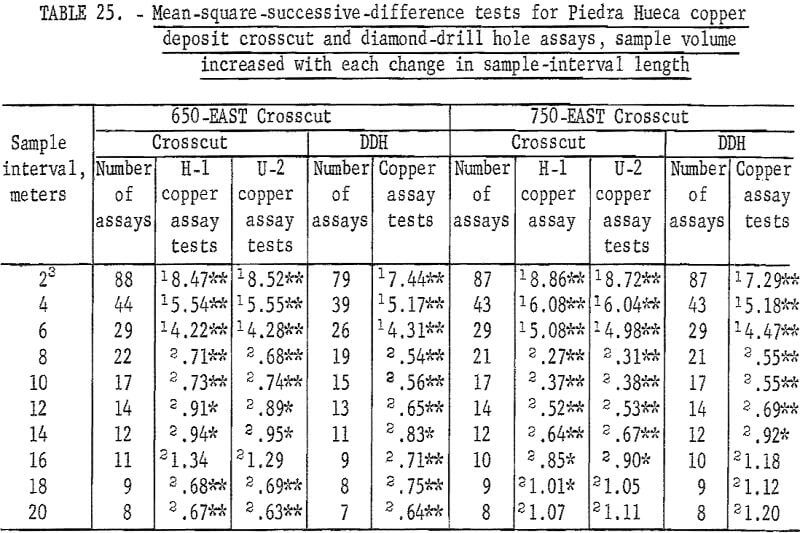
Test data for the 750-EAST crosscut are also given in table 25. The H-1 assays indicate independence for the 20-meter interval. The U-2 assays indicate independence for the 18- and 20-meter intervals, and the diamond-drill hole core assays show independence for the 16-, 18-, and 20-meter intervals. Thus, the three sets of data from 750-EAST crosscut indicate that the area of influence of an assay in the area cut by the crosscut is 16 to 20 meters.
It would be interesting to have similar data from drifts between the crosscuts and from raises driven from the drifts or crosscuts to test the other two dimensions in this area of the Piedra Hueca deposit.
Test results for the assay groupings involving no change in sample volume are given in table 26. Tests for the H-1 and U-2 assays in 650-EAST crosscut are acceptable for the 14-, 16-, and 18-meter intervals but not for the 20-meter interval. The diamond-drill hole assays do not give acceptable tests for any of the intervals. These results are somewhat different than those in table 25 where only the 16-meter interval was acceptable for the H-1 and U-2 assay tests.
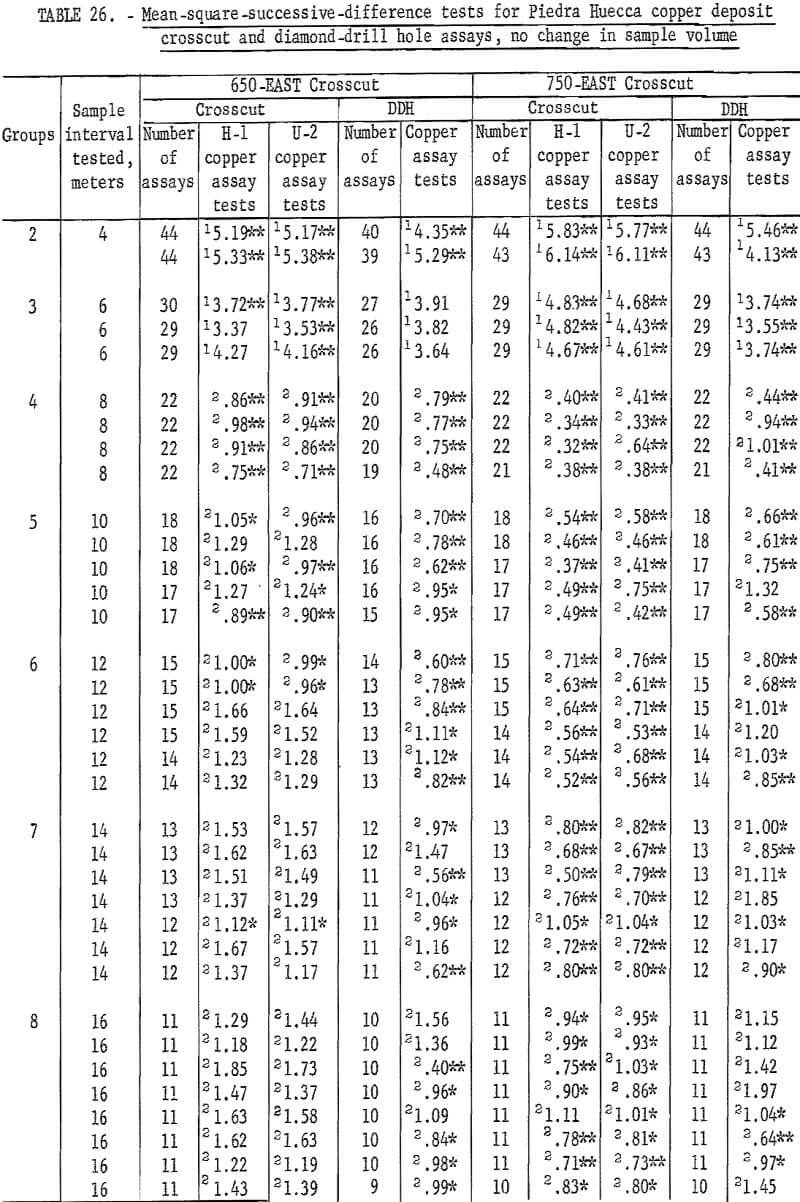
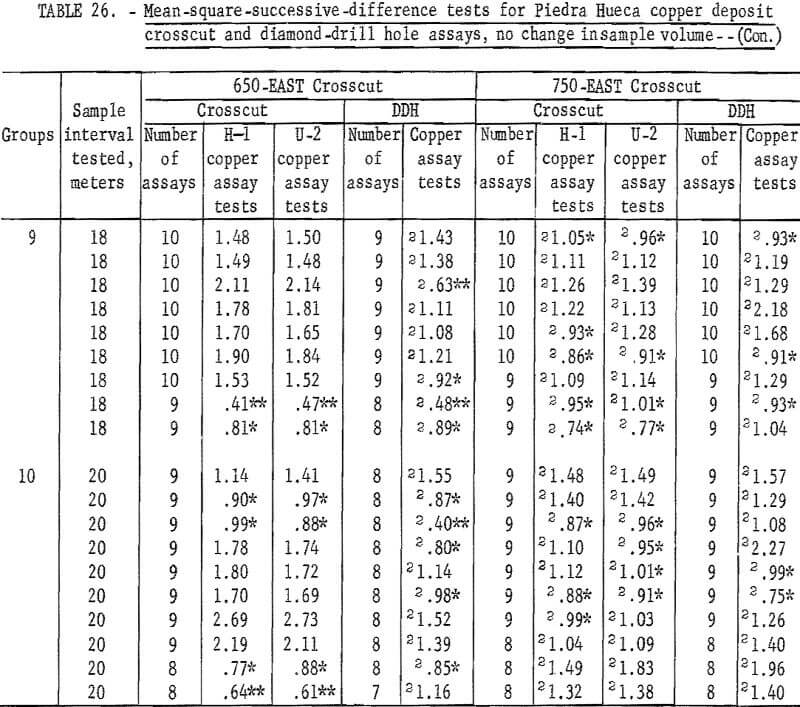
Tests for assays from 750-EAST crosscut indicate that none of the results are acceptable, that is, the area of influence is greater than 20 meters. This result is in contradiction to that shown in table 25 where 16- to 20-meter intervals are acceptable. This difference could be a result of obtaining the single acceptable tests in table 25 compared with the average result of 8 tests at 16 meters, 9 tests at 18 meters, and 10 tests at 20 meters in table 26. More data for intervals greater than 20 meters would be useful to resolve this difference.
Correlation
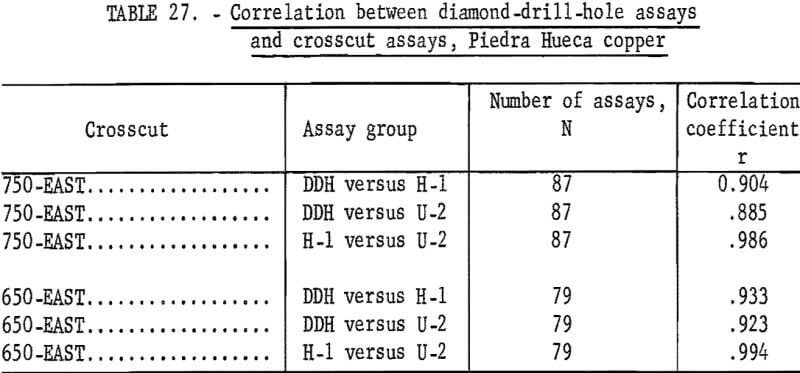
Test results for correlation between the NX core, H-1, and U-2 assays are given in table 27. All combinations show high correlation within individual crosscuts. Tests were tried on assays from between crosscuts, but virtually no correlation existed. Also, there was no success in trying to match assays between crosscuts as was shown in the discussion of the San Manuel sampling.
The high correlation between H-1, U-2, and NX assays indicated that the sampling plant used to crush and split the crosscut rounds produced assay results virtually equivalent to the NX drill core assays. Also, the results indicate that the NX core was adequate to determine grade of ore at least in the area of the crosscuts.
Butte Copper Deposit
Two sets of sample and assay data were obtained from the Butte deposits. One set is typical of one of the vein areas; the other represents the so-called horsetail area. Several individual chip samples, representing different grades of ore, are usually taken in the faces of drifts, in raises, and in the stopes. Individual assays from these samples are used to make up a weighted average grade of ore representative of a mining width by multiplying the assay times sample interval length. These mining-width average grades have been used in this study.
Assays from chip samples, taken across the vein in the face of a drift at approximately 6-foot intervals as the drift is advanced, provide a series of test values in one dimension, and raise assays from channel samples taken across the vein in the ends of each raise floor at about 8-foot vertical intervals, provide test values in a second dimension.
In the horsetail area, drifts and crosscuts are driven through the mineralization. Channel samples are cut along the sides of the crosscuts, usually on both sides. Raises from the drifts or crosscuts provide test data for a second dimension. Stope assays consisting of chip samples along the face of the stopes, provide a set of test data for a third dimension because these particular stopes were mined at right angles to the crosscut axis. With these three sets of data, tests for independence between successive assays and, therefore, estimates of the area of influence of an assay, can be made for three dimensions within the horsetail vein area.
Mean-Square-Successive-Difference Tests
Results of the first tests for independence between successive assays are given in table 28 for the three sets of drift assays from a vein deposit. Data for drift 1 (drift numbers are purely hypothetical) show only 1 test out of 9 as being nonsignificant. Drift 2 has only 2 significant tests out of 7, and drift 3 has 4 significant tests out of 10. Drift 3 data show what may be called a typical test pattern and indicate an area of influence of an assay of 30 feet. Drift 2 test results show an area of influence of only 12 feet with a possible cyclical occurrence of grade of ore. Data from drift 1 show a completely different result. The three sets of data are really too few to give positive clues to the differences in results. This could be a result of differences in vein characteristics or even in differences between sampling procedures.
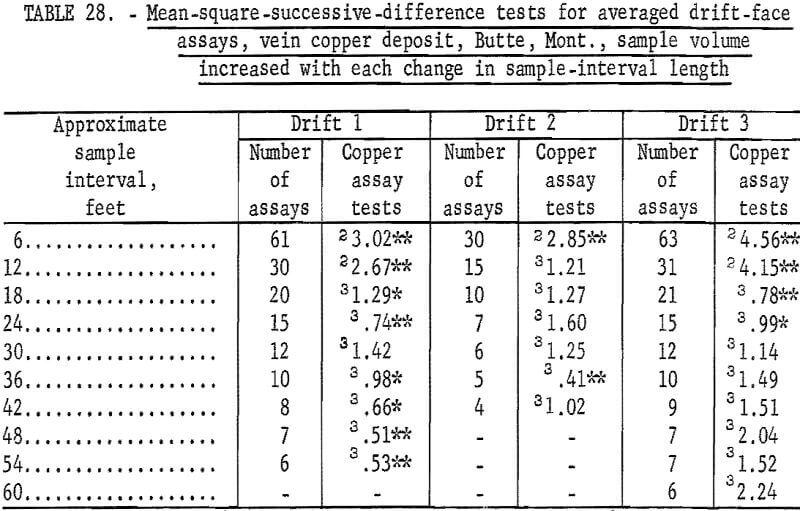
Table 29 lists the results of the second set of tests for independence between successive assays for the three sets of drift assays from the vein deposit. Drift 1 data show significant tests in all but one grouping. In table 29 there are 54 tests for the 10 groupings, and there are 10 tests that are significant at the 90-percent level and 4 tests significant at the 98- percent level. This is more than would be expected on the basis of 1 in 10 for the 90-percent confidence level and 1 in 50 for the 98-percent level. This is virtually the same result as given in table 28 for the same data.
Drift 2, table 29, shows 6 tests as being significant out of the 27 made on this data. The only group not showing a significant test is that for an interval of 18 feet. These test results are more significant than the results shown in table 28 for Drift 2.
Data for Drift 3 indicate good comparability for the two sets of tests. Table 28 data indicate independence beyond an interval of 24 feet. Table 29 data can be interpreted as confirming this, even though there are 2 tests significant at the 90-percent level and 1 test significant at the 98-percent level among the 45 tests for groups from intervals of 30 to 60 feet inclusive. This is less than would be expected for 45 tests at the levels used.
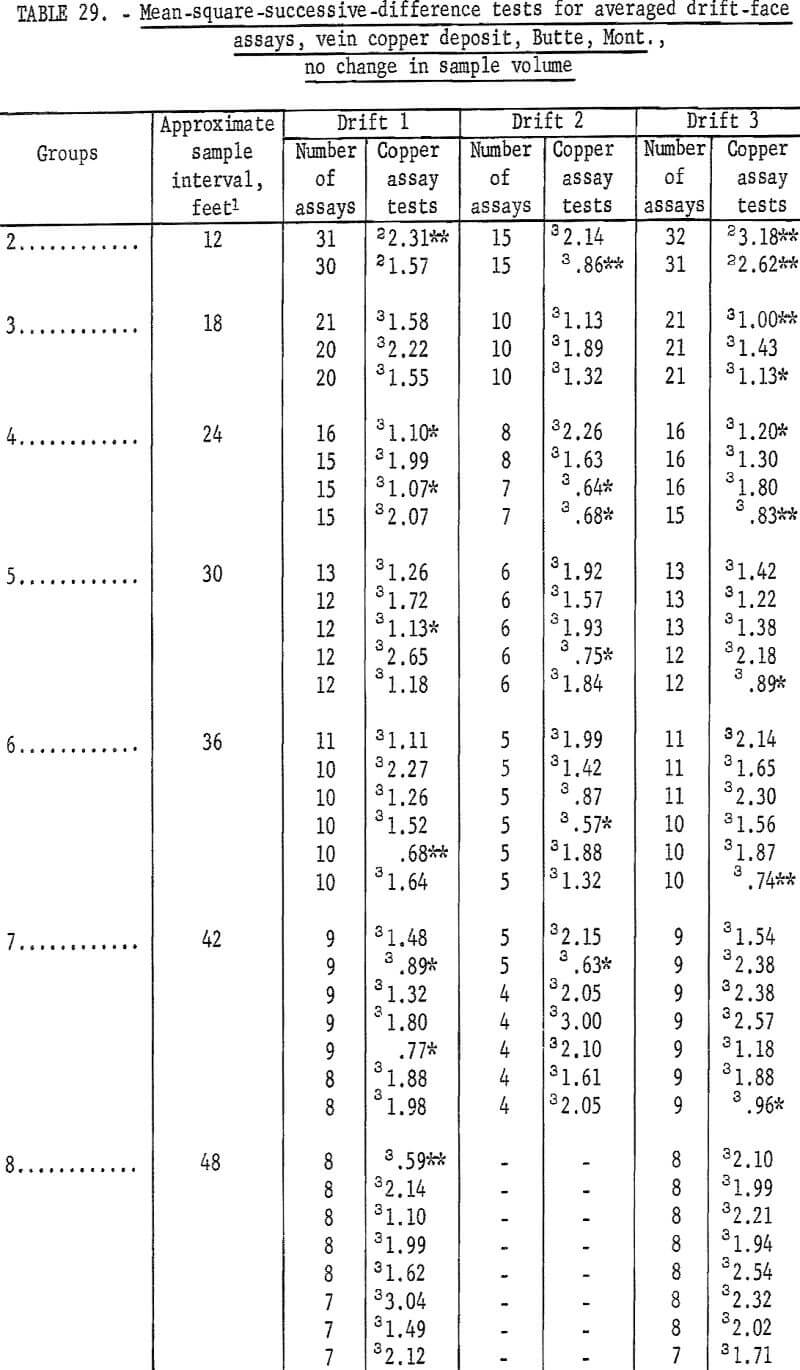
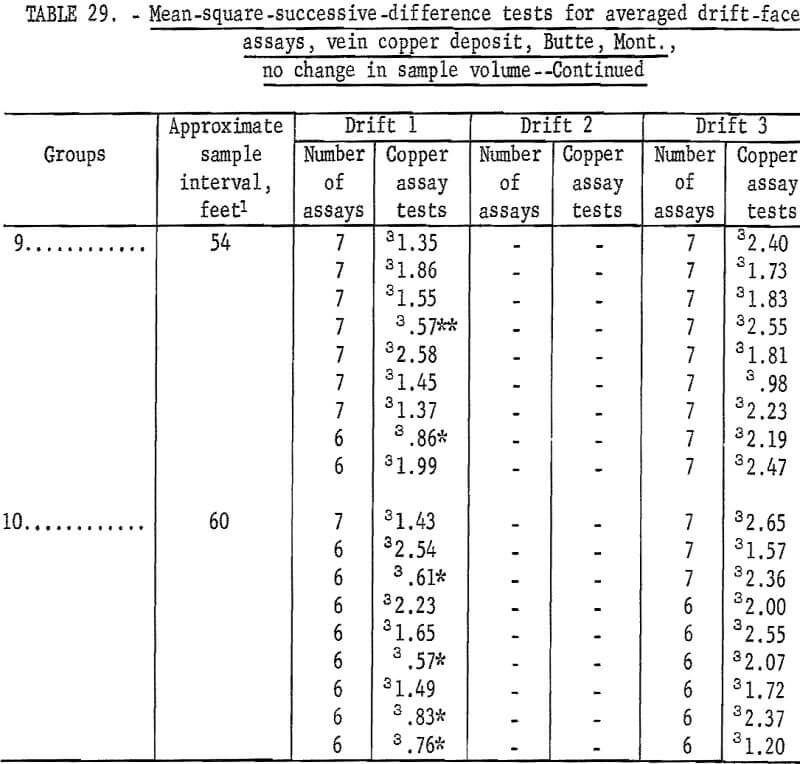
Table 30 shows the results of tests for the assay data from crosscuts in the horsetail-vein area. Crosscut No. 4 has only 1 significant test out of 10 on the south wall and no significant tests out of the 10 groupings for the north wall. This indicates complete independence between successive assays. Crosscut 5 has a grouping of 3 significant tests at a distance of 20, 25, and 30 feet on the southwest wall and the rest of the 16 groupings are nonsignificant on this wall. However, the first 9 out of 16 groupings on the opposite or northeast wall of the crosscut are significant. This particular result is rather inconsistent when all the other crosscut data are examined. Crosscut 6, although having only a few assays, did not show any significant test values. Crosscut 7 has only two significant test values in one wall. Crosscut 8 also has only two significant test values. Thus, with the exception of the one set of data from crosscut 5, the indication of independence between successive assays is reasonably evident.
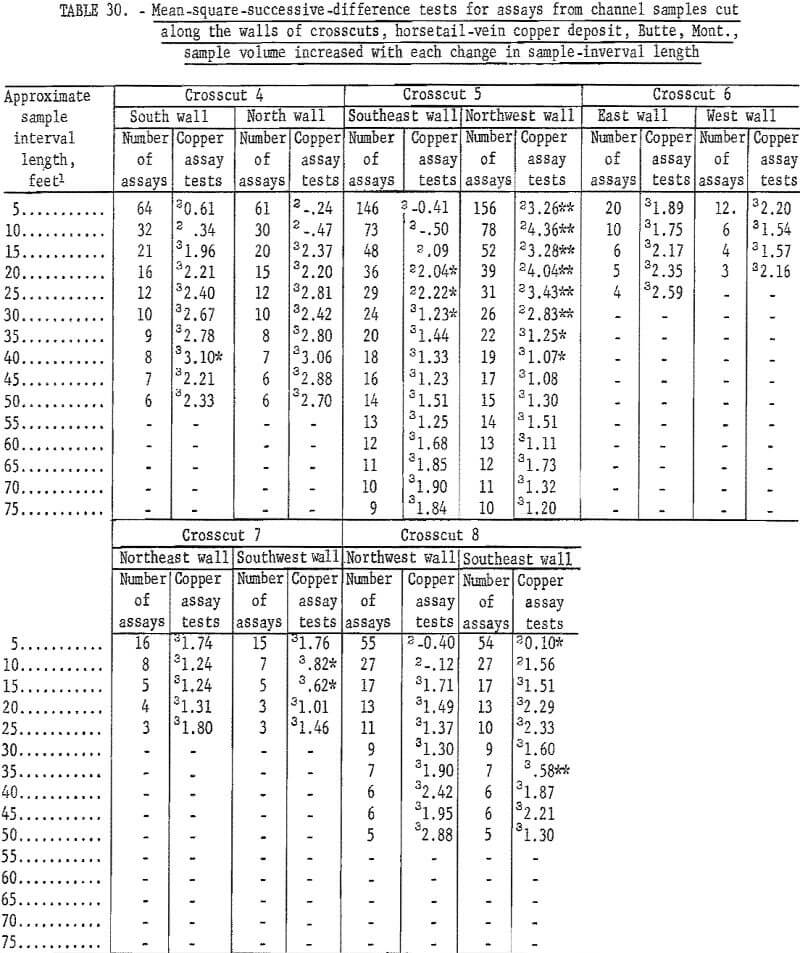
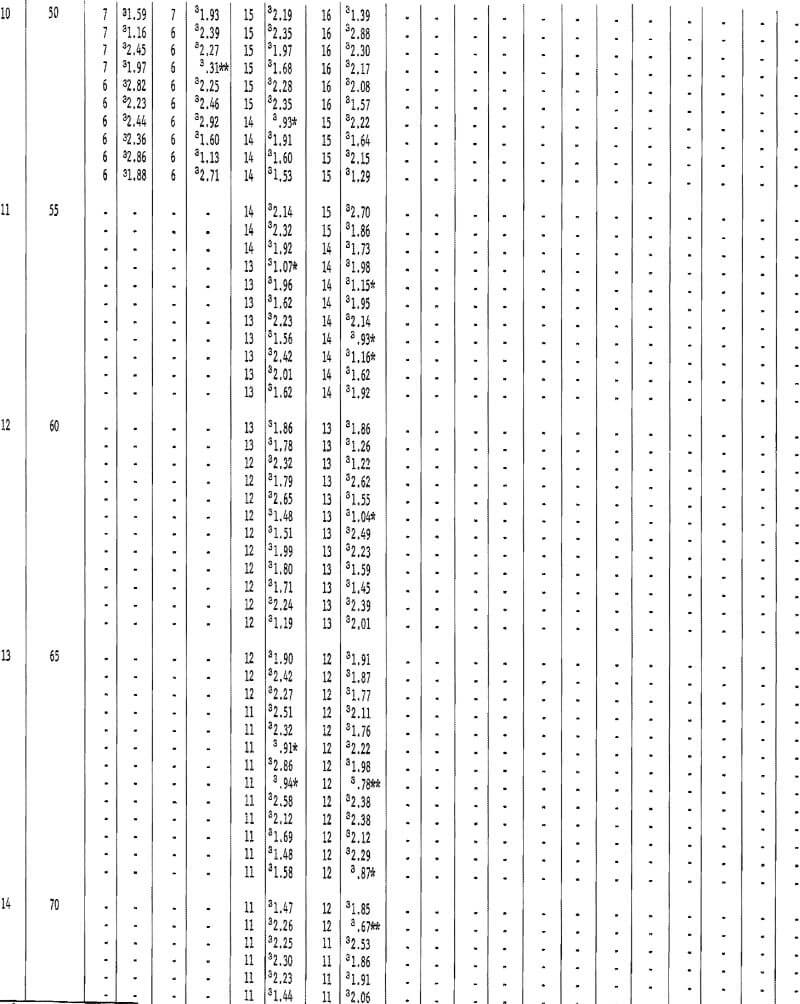
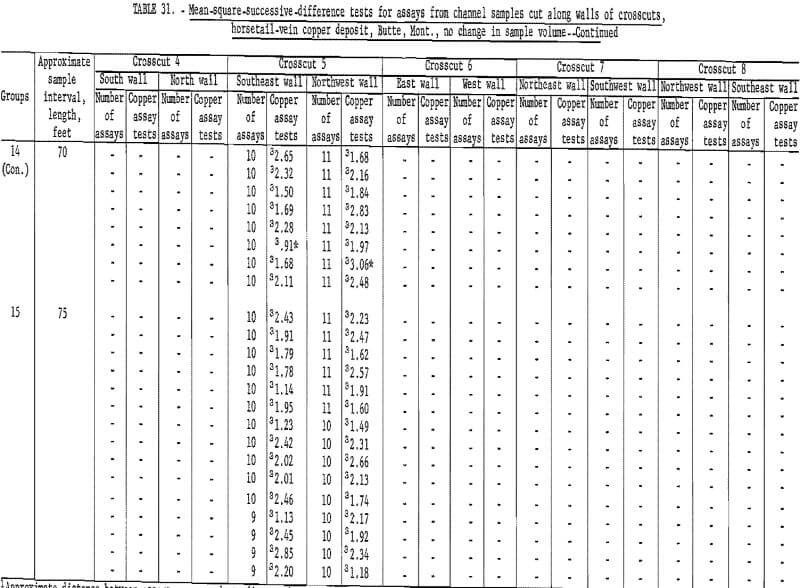
Table 31 gives data for the grouping of crosscut assays where no change in sample volume is considered. Test results are virtually the same as in table 30. Again, the northwest wall in crosscut 5 indicates an interval of about 45 feet before the number of significant tests is acceptable. There are, however, 3 tests out of 11 significant at the 55-foot interval.
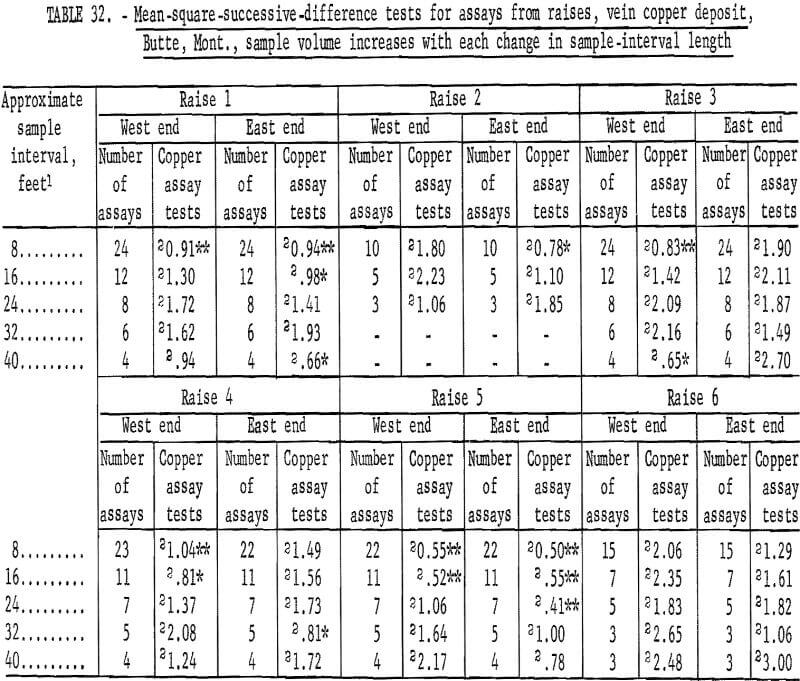
Results of tests on assays from six raises driven on the veins over the three drifts (table 28) are given in table 32. With the exception of raises 1 (East end) and 5 (East end), the area of influence of an assay is indicated as being 8 to 16 feet. This could be extended to as much as 24 or 32 feet when raises 1 and 5 are considered. This range in results could be a result of differences in mineralization in the raise. More detailed studies on more data would be required to search out the causes of the differences. There are a total of 60 tests included here and there are 14 significant tests. This is more than would be expected by chance so there must be some source of differences in the data.
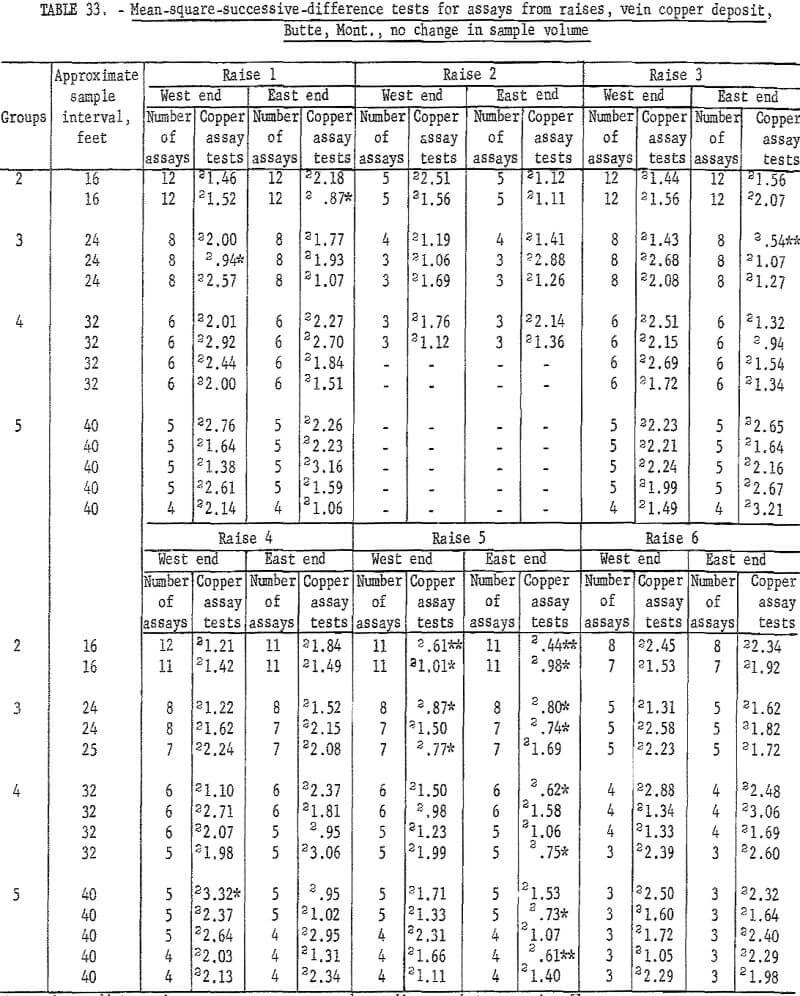
Table 33 lists the results for the assay groupings for raises on veins where there is no increase in sample volume. Raise 1 has an acceptable interval of 24 to 32 feet, and raise 5 requires an interval of 32 feet for the West end and more than 40 feet for the East end. These data for raises 1 and 5 give greater intervals than the data in table 32, but the results are essentially similar.
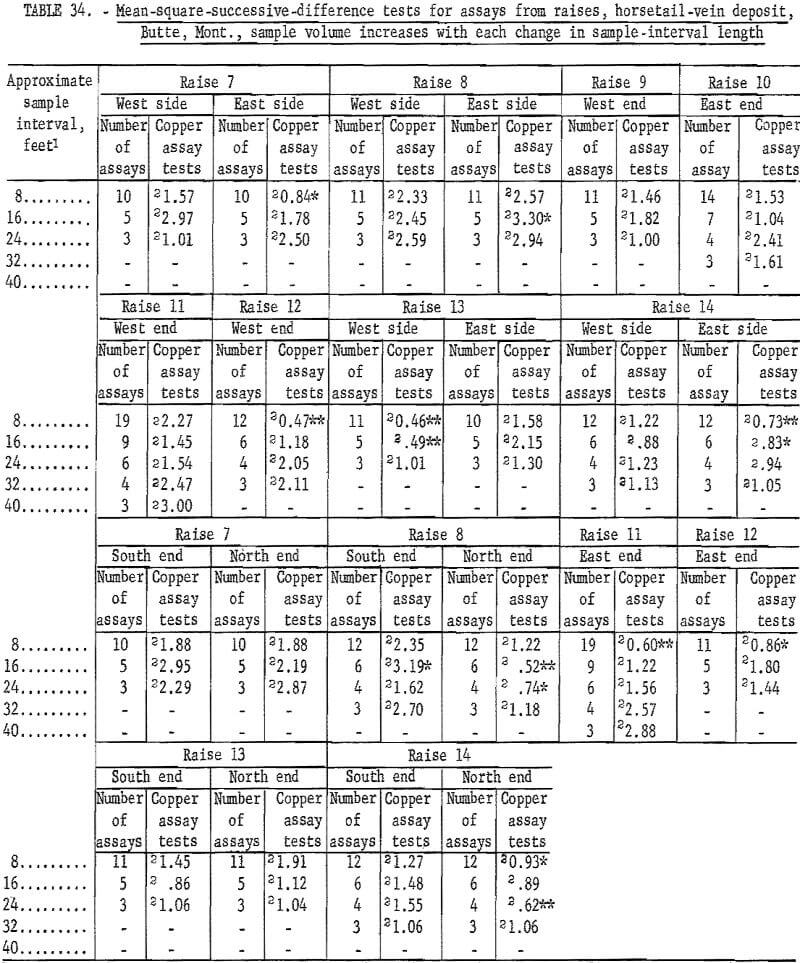
Results of similar tests for raise assays from the horsetail-vein area are given in table 34. There are only 11 significant tests out of 89. This is approximately what would be expected (10 percent) at the 90-percent level of confidence used. This indicates that the assays are essentially independent, thus confirming the similar conclusion for the drift assays in the horsetail-vein area. However, 6 of these 11 significant tests are at the 98- percent level, which is 3 times what should be expected as a result of chance alone.
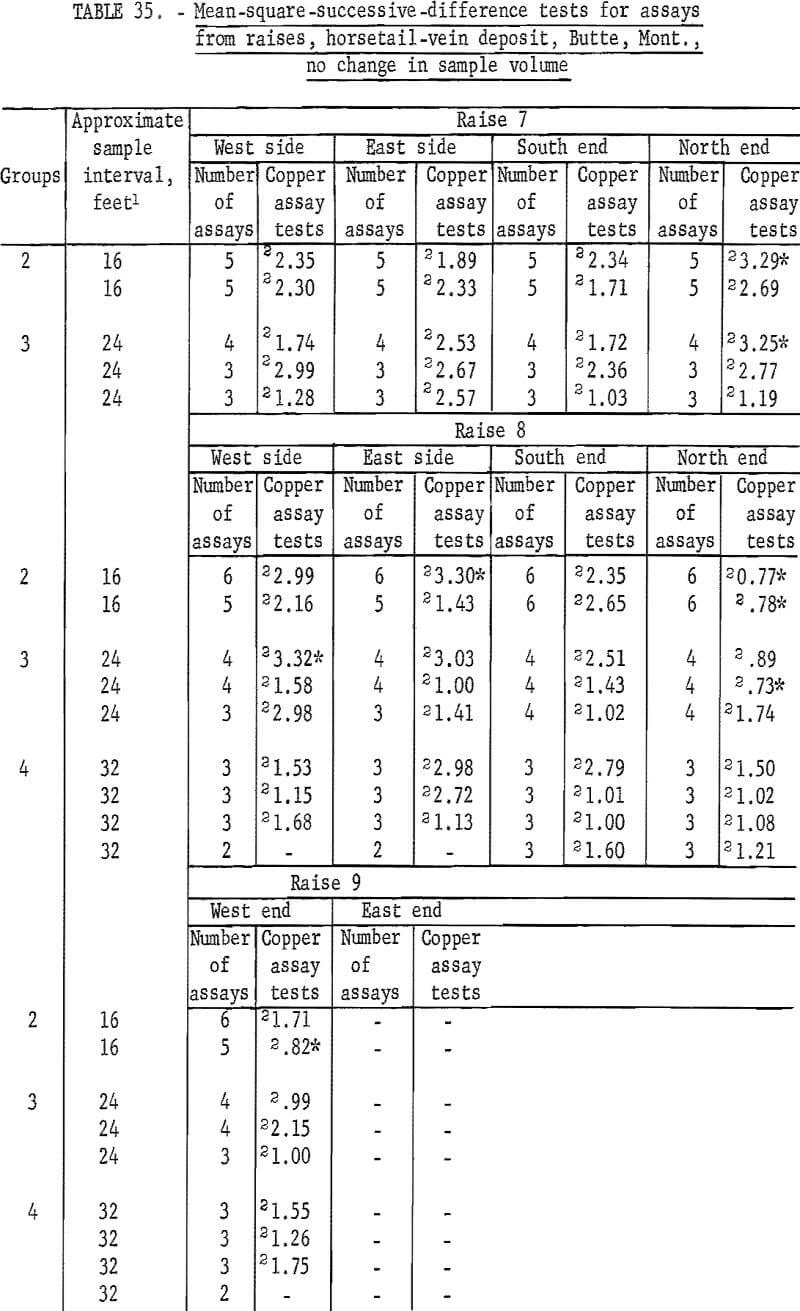
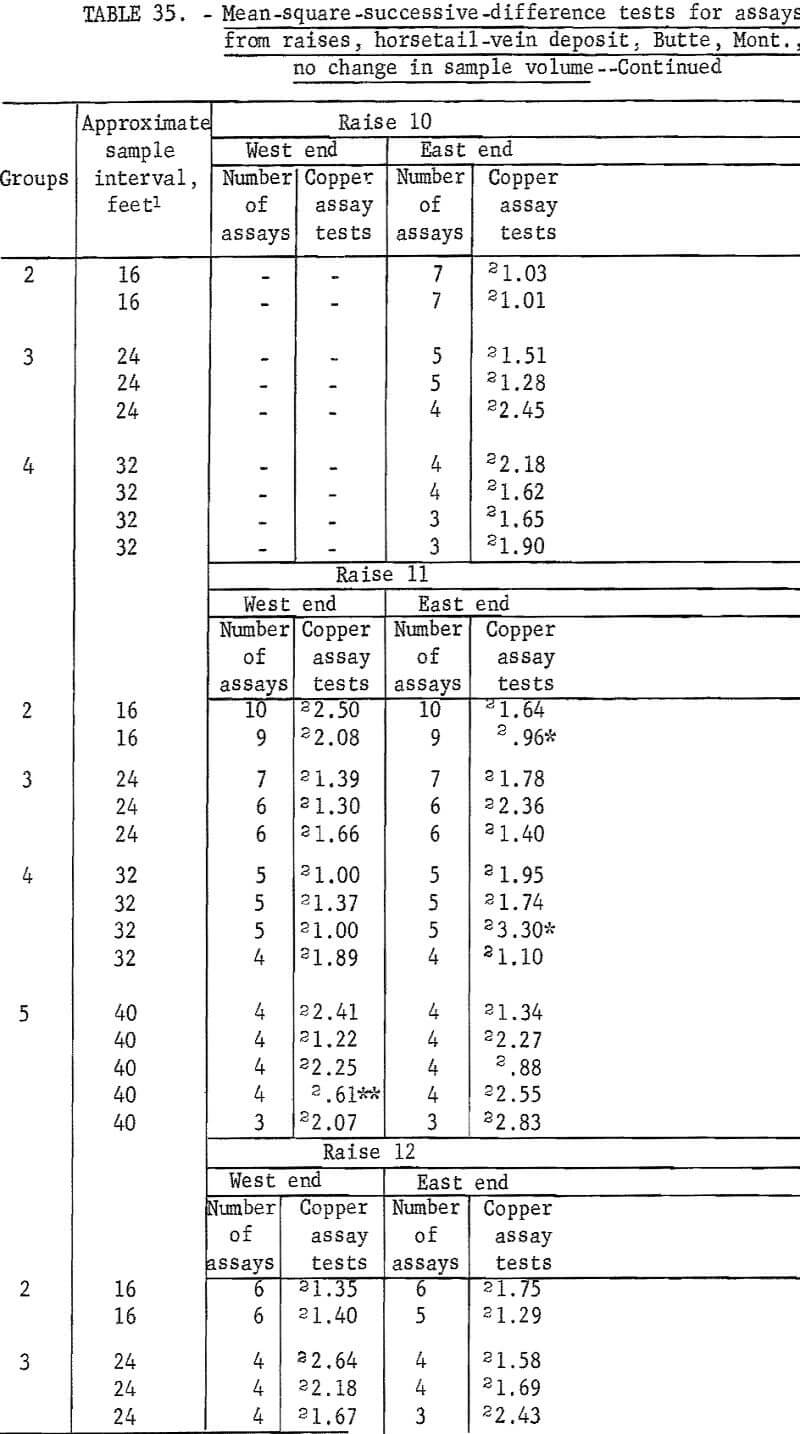
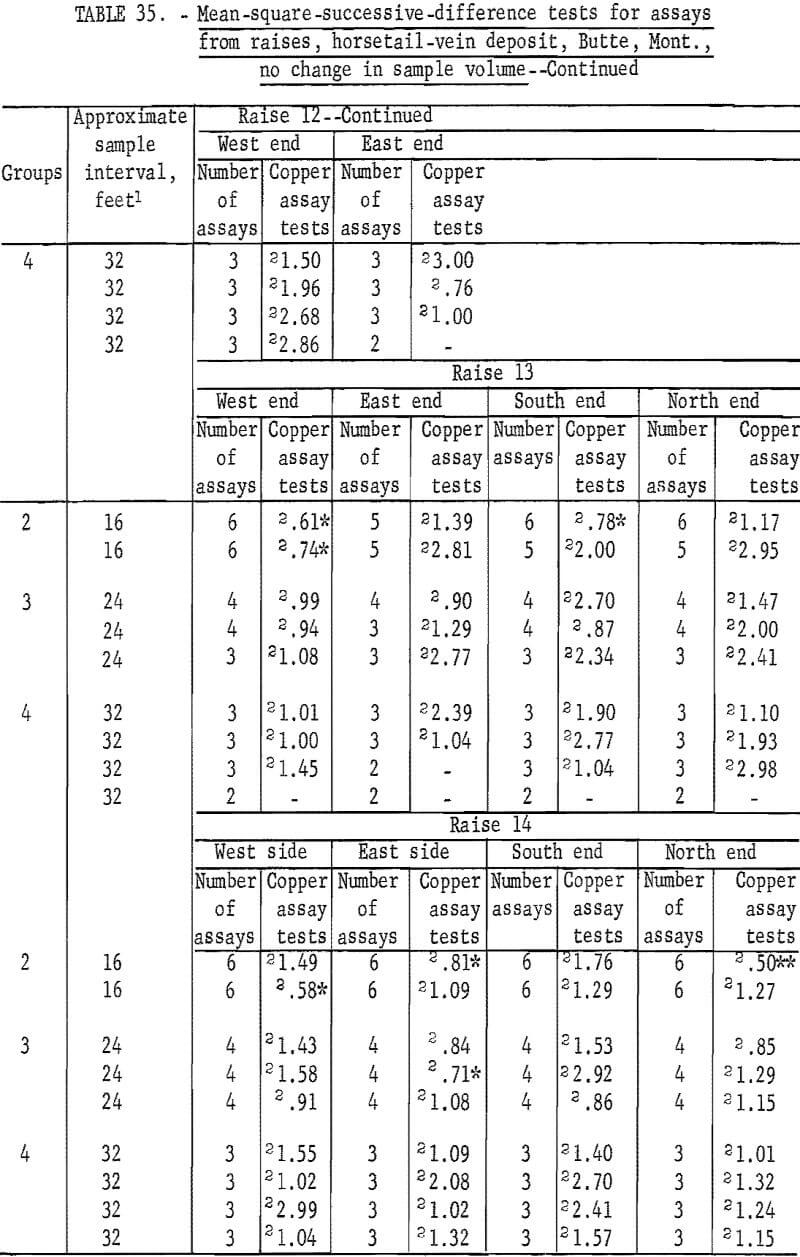
There are 183 tests on the same assay data for raises in the horsetail vein when they are regrouped for considering no change in sample volume (table 35). There are 18 significant tests out of the 183; 2 at the 98-percent level and 16 at the 90-percent level. Most of the significant tests are in group 2 and 3 for the shorter intervals. These results are more consistent with the expected probability of 10 significant per 100 tests at the 90-percent level than the test results in table 34 for the same data but different groupings for increased sample volume.
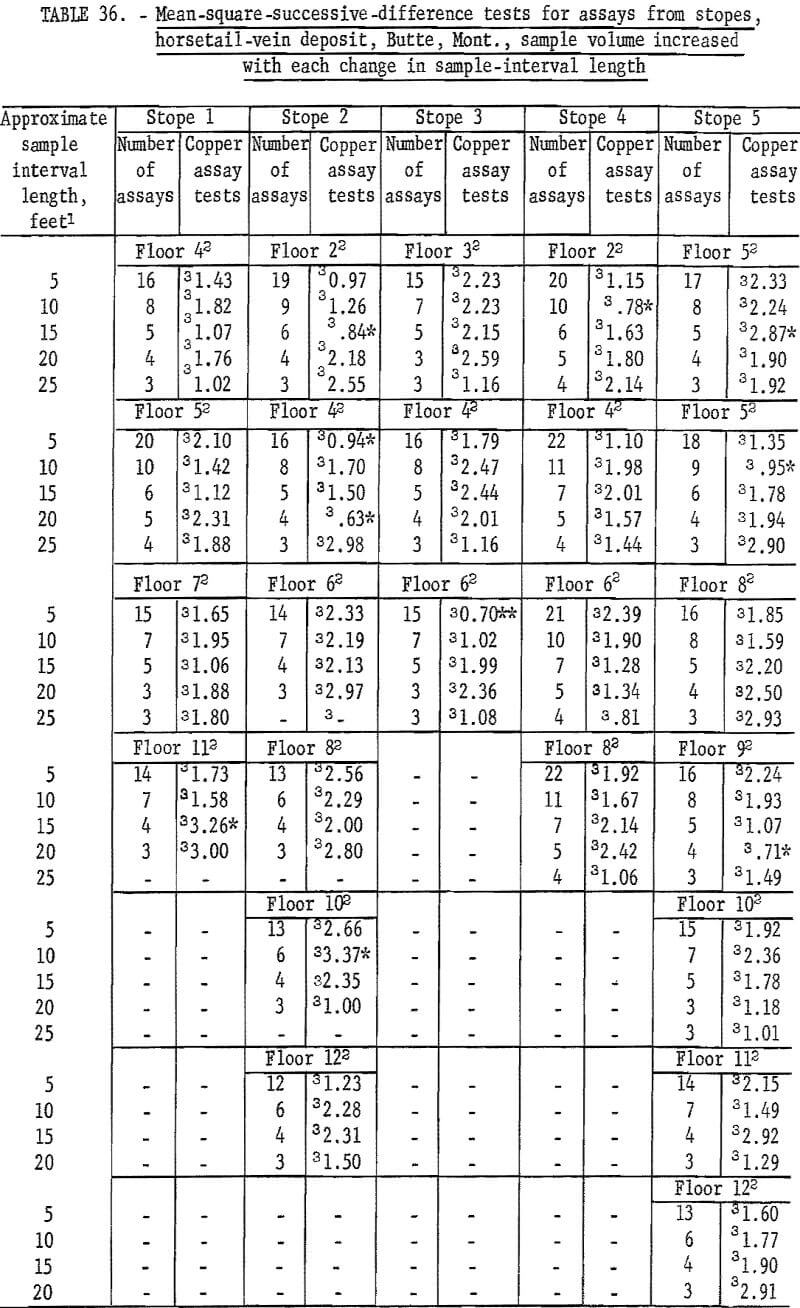
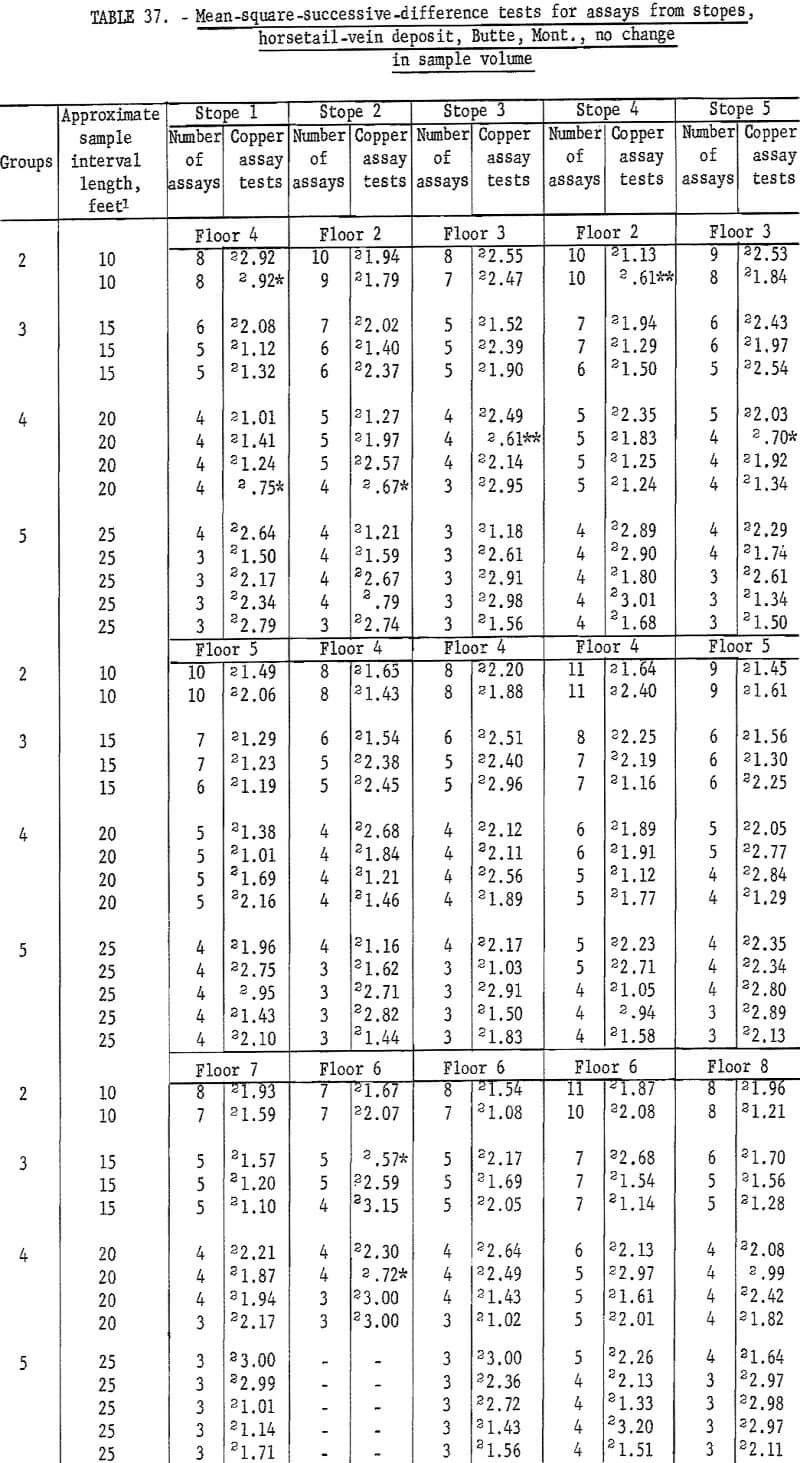
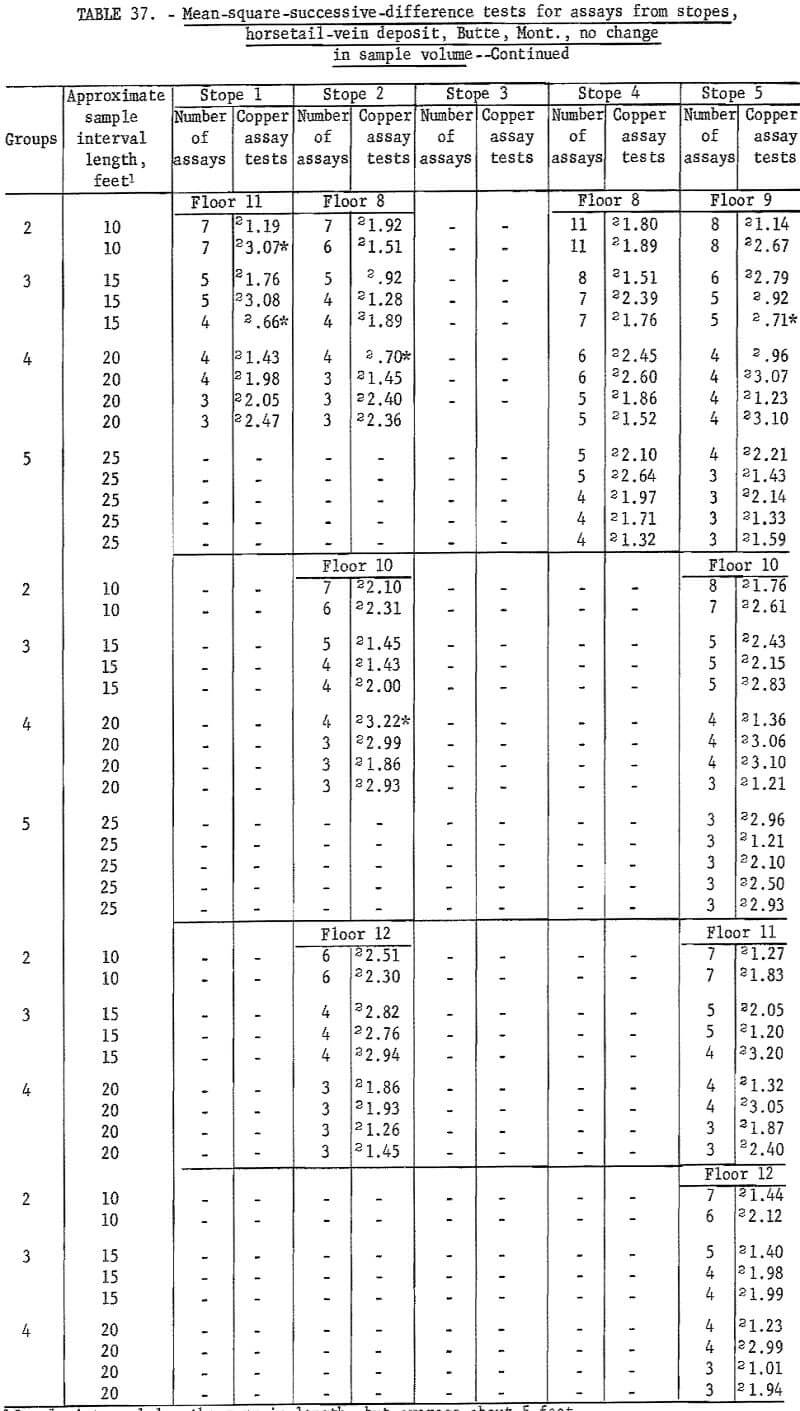
Table 36 gives the results of tests on stope assays from the horsetail-vein area. Again, independence of assays is indicated. Table 37 gives the results on stope assays from the horsetail vein regrouped for no change in sample volume. There are 10 significant tests at the 90-percent level and 2 at the 98-percent level. This is less than expected at these test levels, so the results of both tests confirm those of table 36. Thus, successive assay data for all three dimensions (along crosscuts, in raises, and in stopes) in the horsetail-vein area are independent with respect to each other. Data from the veins do not show such positive evidence of independence. Some assay data appear to indicate differences between veins for an area of influence of an assay.
Correlation
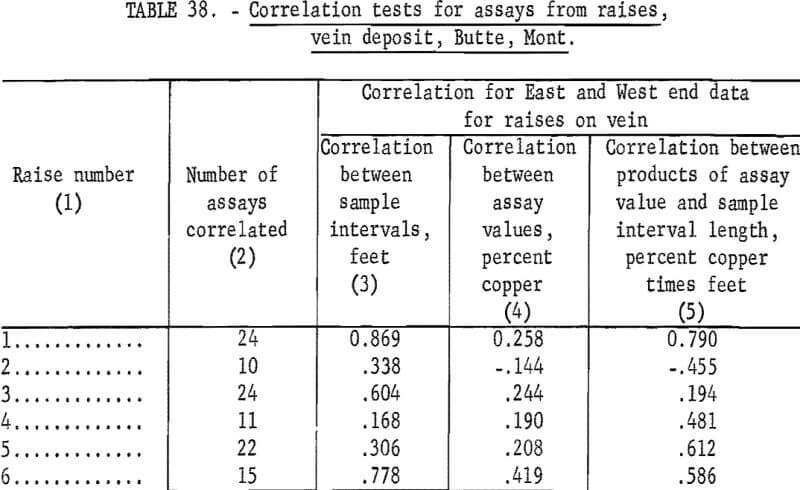
No formal correlation tests were made on the Butte data. The independence indicated between the weighted average width assays in the horsetail-vein area would preclude the presence of correlation. Preliminary correlation runs on raise copper assays (one end versus the other end) from the vein deposit were not statistically significant (table 38, column 4). Individual channel assays taken over smaller interval lengths than the weighted average assays gave erratic results in correlation tests. This indicates small lens like concentrations of ore rather than continuous lenses.
Summary and Conclusions
Results of studies made on the five sets of assay data from hydrothermal deposits are summarized in table 39.
The mean-square-successive-difference test can be used on successive runs of assays to define a sample interval length at which independence exists between the assays. When independence occurs, as shown by the test, this is considered to be the limit for projecting the area of influence of an assay value. Tests can be made on consecutive assay runs from drill holes, drifts, raises, and stopes. Arrangement of the data into groups representing changes in sample volume and representing no change in sample volume give about the same results.
The mean-square-successive-difference test is applied to the square of the differences between successive assays. Correlation tests are applied directly to the assay values. Although there can be a relationship between the two results, the mean-square-successive-difference test apparently measures some factors related to the characteristics of the mineralization, while correlation apparently measures some factor related to the intensity of mineralization.
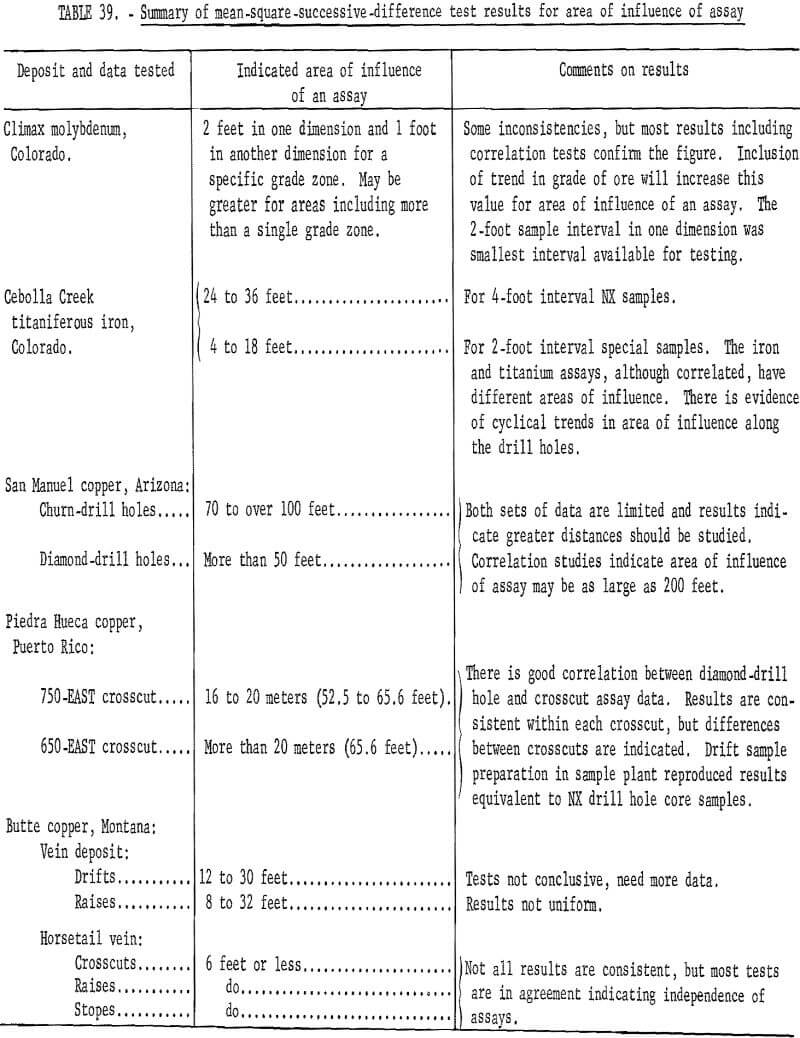
Each deposit tested in this study has different characteristics of mineralization, and although the test results are not entirely consistent, the results are related to the nature of the mineralization and the structural environment.
Obviously, much more study is needed, particularly on individual deposits where all assay data is included in the study. Each deposit will have differences which could be related to rock type, alteration patterns, enrichment zones, and so forth.
Although specific distributions of the actual η and z values obtained in the assay tests have not been made, it is believed that these are more small values; that is, the mean of the distribution of experimental values for η would fail below 2 and for z would be less than 0. This could happen as a result of some bias in the sampling. Previous work has indicated that low core recovery, nonrandom errors in assaying, and so forth, can cause a bias in the assay data. If there were a bias and the experimental mean were below the theoretical distribution, this would be reflected in the test results. This can be demonstrated by drawing two overlapping frequency distributions and shifting one distribution and its mean to the left of the other. Test limits (90 and 98 percent for example) placed on the right hand (theoretical test distribution) would not be the same for the left hand distribution (shifted by bias in the experimental data).
On future work where many sets of assay data are tested for a specific mine, it would be advisable to make distribution of the η and z test values to determine if they actually conform to the theoretical distribution used for the test limits.
It is recognized that this initial investigation has only demonstrated the possible application of these two techniques. However, the hypothesis that independence between assay intervals may be used as a measure of the area of influence of an assay has developed as a result of several years of related investigation, and it is hoped that the technique can be tested by geologists and engineers at operating mines where much larger sets of assay data are available.
