Table of Contents
Evaluations of mineral beneficiation circuits and concentrators require information on mineral liberations, on mineral recoveries and on behaviours of liberated and partly liberated mineral grains. A qualitative evaluation of mineral, liberations can be made by examining polished sections of ores with an optical microscope, but the data are not accurate enough to calculate mineral recoveries and behaviours. In contrast relatively accurate quantitative mineralogical data can be determined by image analysis for minerals displayed in polished sections. A slicing effect which modifies mineral interrelations is, however, produced by mounting and polishing ore pieces in briquettes. Nevertheless image analysis data obtained from polished sections can be evaluated without corrections to determine relative mineral behaviours, and with mathematical corrections to determine absolute mineral behaviours.
Predicting Grind by Analyzing Unbroken Ores
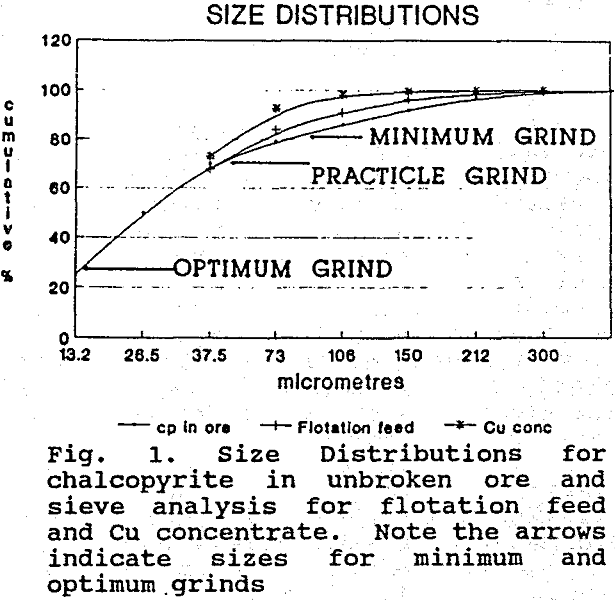
Ores are ground to liberate minerals. Mineral processing engineers generally determine the grind for liberating the minerals by a series of grinding and mineral beneficiation tests, but for some ores the “grind” is difficult to establish. In contrast, approximate grinds for liberating minerals can be predicted by determining the size distributions of minerals in an unbroken ore by image analysis. The predictions provide a broad target where none is available.
Weakly bonded grains tend to separate readily during grinding (preferential breakage) and to produce liberated grains that are nearly the same size as the grains in unbroken ore. On the other hand, well bonded grains break randomly and liberation is not achieved until the grains are broken into smaller sizes than the grain sizes in unbroken ores. It has been found that polished sections of poorly bonded grains display incipient fractures and pits along grain boundaries, whereas polished sections of well-bonded grains do not. T
Mineral Liberation and Optimum Recovery
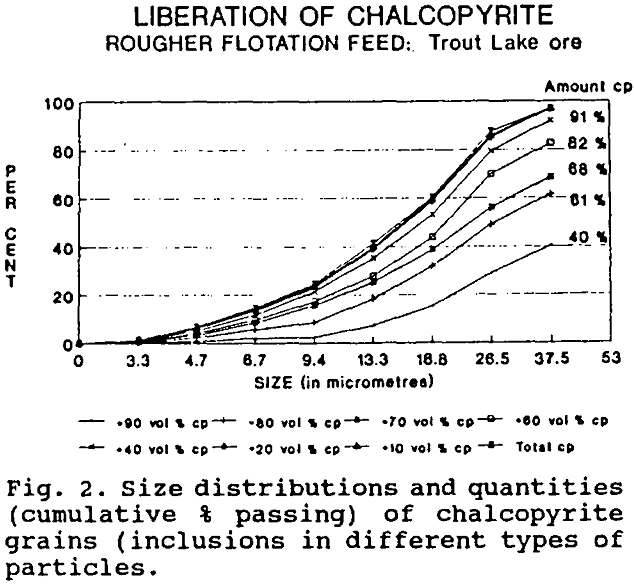
It is assumed that the maximum percentage of mineral that can be recovered from an ore is equal to the percentage of mineral that is in types of particles which are recovered in the concentrate. In particular iron ore concentrates grading around 65 wt % Fe (out of about 70 wt % Fe in hematite-magnetite) tend to recover particles which contain more than 90 vol % iron oxides; zinc concentrates grading 50 to 54 wt% Zn (out of about 60 wt % Zn in sphalerite ) tend to recover particles containing more than 70 vol % sphalerite; and chalcopyrite concentrates grading 20 to 24 wt% Cu (out of 34 wt% Cu in chalcopyrite) tend to recover particles containing more than 50 vol% chalcopyrite.
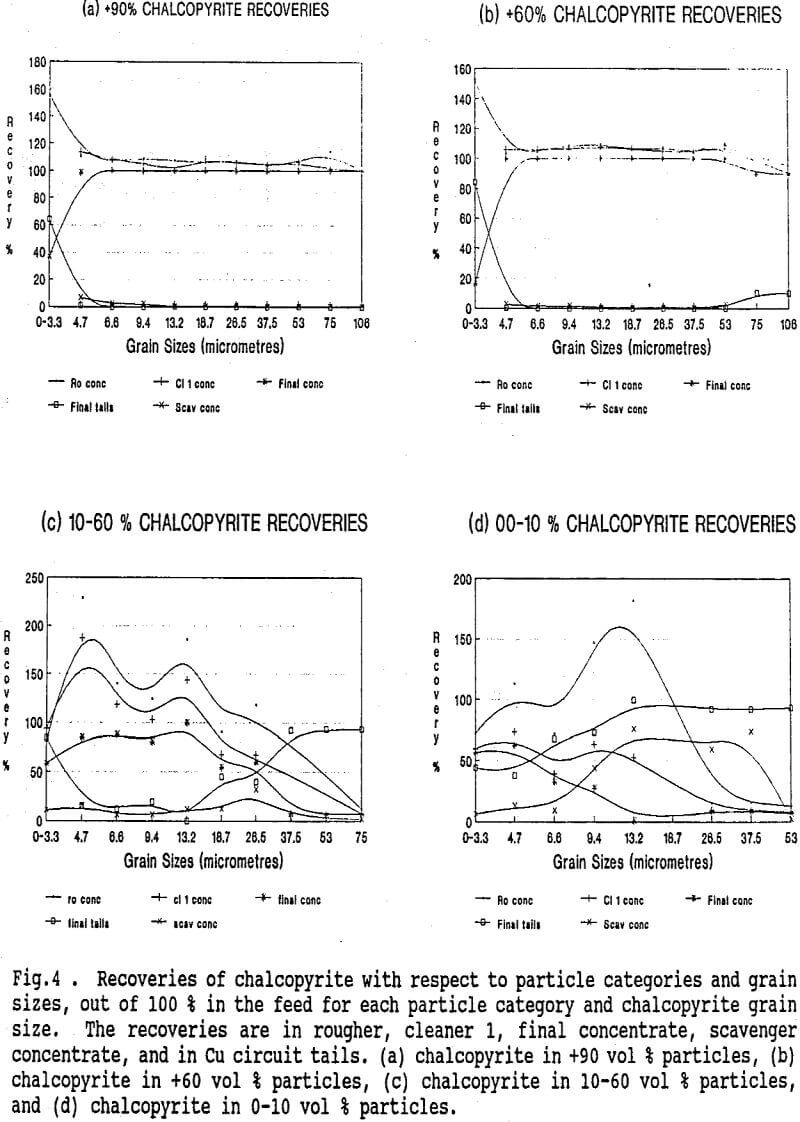
The types of particles recovered in concentrates can be determined by analyzing a suite of samples, including feed, concentrate and tailings from a circuit and calculating, by materials balance, the recovery of each type of particle in the concentrate. Results for chalcopyrite recovery in the Cu concentrate from Trout Lake ore are show that 98 to 100 % of the chalcopyrite is recovered in 3.3 to 75 µm particles containing more than 90 vol % chalcopyrite, and in 10 to 53 µm particles containing 60 to 90 vol % chalcopyrite.
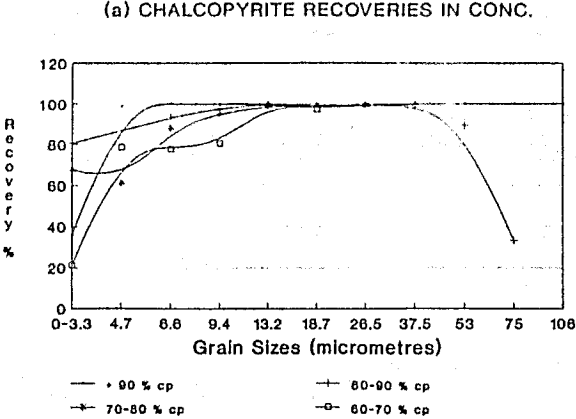
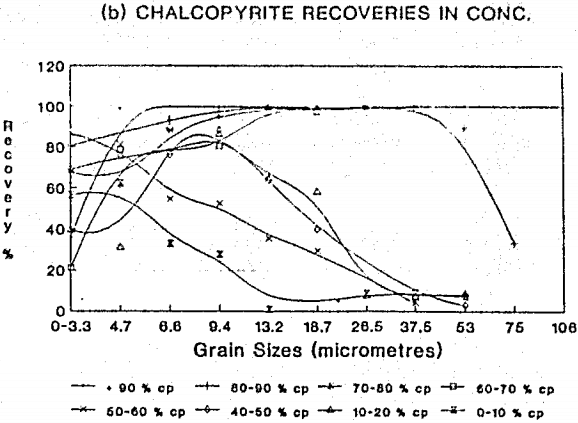
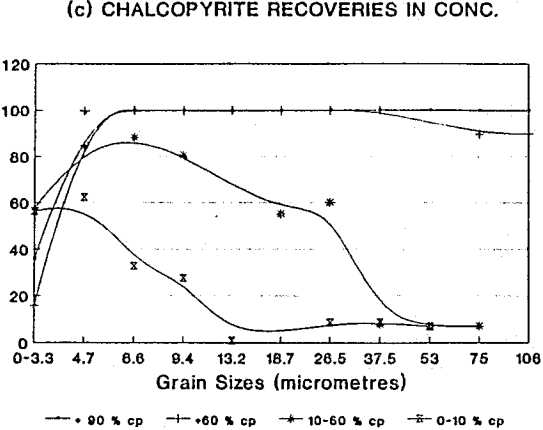
Fig. 3. Recoveries from flotation feed in Cu concentrates with respect to different sizes of chalcopyrite grains and particle types: (a) chalcopyrite grains in particles containing more than 90, 80-90, 70-80 and 60-70 vol % chalcopyrite, (b) chalcopyrite grains in particles of all types from 0-10 to more than 90 vol %., and (c) summary diagram.
Determining the Behaviour of an Ore in a Circuit or Concentrator
When it is desirable to determine the behaviour of an ore in a circuit a complete quantitative mineralogical analysis needs to be done. Representative samples of feed, concentrate and tails are taken from each cell over a period of time. The samples are analyzed chemically and materials balances are performed to determine and fix the flow of material through each sample point.
