Table of Contents
Increasing the relative motion of the electrolyte with respect to the electrode surface has long been recognized as a means by which the mass transport of ions to the electrode can be increased to allow operation at higher current densities. Basic theories and early experiments were discussed by Nernst, Brunner, Lin, Denton, Gaskill, and Putnam, Eisenberg, Tobias, and Wilke, and Levich.
High mass transport cells also permit electrowinning from dilute solutions. The ability to electrowin metals from dilute solutions acquires particular significance as a result of recent trends to use hydrometallurgical processes as a means to avoid pollution problems associated with smelting and to recover metals from low grade ores by in situ leaching. Increasing interest has also been shown by the electroplating industry in conserving metal values ordinarily lost through “drag out” of solution on the plated parts. Barker and Plunkett studied the electrolytic recovery of nickel at concentrations of 0.001 to 0.02 g/l Ni²+ in both planar electrode and fluidized bed electrode systems. Bettley, Tyson, Cotgreave, and Hampson evaluated a combination forced flow, fluidized bed electrowinning cell as a method for recovering nickel from dilute electroplating effluents having concentrations of 0.3 to 1.25 g/l Ni²+. Landau investigated the distribution of copper ion transport rates along planar electrodes at concentrations of 0.32 to 6.3 g/l Cu²+ and electrolyte flow rates up to 4.6 m/s (Reynolds number (Re) = 100,000). Kovacs studied the mass transfer and hydrodynamic phenomena on planar electrodes during the electrowinning of copper from 3 g/l Cu²+ solution circulated at 9.2 m/s. Skarbo and Harvey and Harvey, Miguel, Larson, and Servi applied air agitation to increase mass transport in copper electrowinning from dilute solutions and showed that a current density of 32 A/m² was possible for each gram per liter of copper in solution.
The principal objectives of the research described in the present report were (1) to establish the hydrodynamic and electrodeposition parameters for electrowinning nickel in a channel cell utilizing synthetic, dilute (1 to 5 g/l Ni²+) electrolytes, and (2) to evaluate electrolyte purification procedures required to electrowin nickel in a channel cell from an actual dilute leach electrolyte. The latter solution was prepared from a bulk sulfide flotation concentrate of Duluth gabbro ore which contained significant concentrations of Cu, Ni, and Fe; and lesser quantities of Co, Pb, Zn, and precious metals. Studies with this concentrate and related leach solutions represented an introduction of the metal recovery process at an early stage in the mineral processing procedure. Successful implementation of a process to recover metals from dilute solutions by electrowinning is an alternative to pyrometallurgical processing and hydrometallurgical solvent extraction stages.
Experimental
Channel Cell
The channel cell used in this study is shown schematically in figure 1. Electrolyte was circulated through the cell with a 95 l/min positive displacement pump from either a 30- or a 225-liter-capacity reservoir corresponding to the use of either leach or synthetic, dilute solution. A 400-mm- long, 200-mm-diam cylindrical chamber preceded the electrolysis channel and served to minimize turbulence eddies associated with the transition from the 32-mm-diam connecting pipe and the 1,200-mm-long, 13-mm-wide, 50-mm-high channel electrolysis section. The cylindrical chamber contained three successively finer screens (8, 14, and 20 mesh) positioned perpendicular to the flow to act as manifolds for distributing the flow evenly across the entrance to the channel. A shorter chamber (200 mm) containing no screens was positioned after the exit from the channel. Each end of the channel was tapered and projected about 75 mm into the adjacent cylinder to further aid in minimizing eddy effects. Electrolyte velocity through the test cell was computed from the volumetric flow that was monitored with a meter in the return section of the circuit. The rate of flow was adjusted with in-line valves as well as with a bypass circuit that also contained a gas venting chamber. Velocity profiles in the channel were measured with a laser-Doppler anemometer. Figure 2 shows two velocity profiles measured at a cross section 20 hydraulic diameters from the entrance and at mid-height. They represent linear flow rates of 0.10 and 1.4 m/s corresponding to Reynolds numbers of 3,000 and 43,000, respectively. The corresponding shape of each curve is similar to that which is typically obtained under fully developed laminar and turbulent flow conditions. Velocity distribution across the channel becomes more uniform with increasing turbulence because of decreasing viscous effects and increasing inertia forces in the bulk solution.


The electrolytic cell was constructed of 25-mm-thick polyacrylic plastic. The lid was connected to the cell body with steel reinforced polyacrylic clamps, and sealed with a neoprene 0-ring gasket. Materials of construction for the cylinders and the bypass chamber were 6-mm-thick polyacrylic and PVC, respectively.
Quartz immersion heaters (up to 3.75 kw) were mounted within the reservoir to thermostatically control the electrolyte at desired temperatures up to 50° C.
Equipment
Figure 3 shows a detailed schematic of the electrolytic cell configuration and associated electrochemical measuring system. The reference electrode was connected via a salt bridge to a 0.5-mm- diam Luggin capillary probe positioned 1.3 mm from the nickel 200 alloy cathode surface. Accurate positioning of the probe was accomplished by means of a micrometer mounted on the outside wall opposite that of the cathode. The Luggin capillary passed through this wall and a small hole in the Pb-6Sb anode. Three individual nickel cathodes, 20 mm high and 45 mm long, were mounted in the sidewall 20, 30, and 40 hydraulic diameters from the channel entrance. This permitted three independent potentiodynamic sweep measurements or electrolytic tests to be made simultaneously at a chosen velocity. Fully developed flow is generally accepted to exist between 25 and 75 hydraulic diameters. Three separate anodes were mounted on the opposite wall and each had a surface area 50 pct larger than the cathodes. The edges of the removable cathodes were sealed with a rubber based filler. Electrical connection to the cathodes and anodes was made through 3.2-mm-diam brass rods threaded into the back of the electrode.
All potentiodynamic sweep measurements were made at a position near the center of the cathode (22 mm downstream from the leading edge) and represented only an average polarization in view of the fact that the convective diffusion profile changes along the length of an electrode in a flowing electrolyte.
Electrolysis circuits for the three electrode pairs consisted of a constant current power supply, a shunt for current measurements, and an ampere-hour meter. Anode-cathode and cathode-calomel potentials were measured with high input impedance voltmeters.
Preparation of Solutions
Synthetic Electrolyte
Synthetic dilute nickel electrolytes were prepared using reagent grade salts and deionized water (p =10 Mohm-cm). Nickel sulfate hexahydrate was used to supply the nickel ions in concentrations ranging from 1 to 5 g/l. The supporting electrolyte consisted of 35 g/l sodium sulfate (Na2SO4) and 20 g/l boric acid (H3BO3),

Leach Electrolyte
To prepare a representative leach solution, a bulk flotation concentrate of the Duluth (Minn.) gabbro ore obtained from the Twin Cities (Minn.) Research Center was leached following closely the procedure of Vezina. The concentrate was composed primarily of pyrrhotite (FeS) and chalcopyrite (CuFeS2), with lesser amounts of pentlandite (FeNi)9S8. Its elemental composition is listed in table 1. The concentrate was ground to 100 pct minus 20 mesh, mixed with a 20 g/l H2SO4, 20 g/l H3BO3, 35 g/l Na2SO4 solution to a pulp density of 17 pct solids, and then leached in an autoclave, under 100 psi oxygen pressure at a temperature of 110° C, for 5 to 8 hr. H3BO3 and Na2SO4 were utilized in the leaching procedure to provide supporting electrolyte in subsequent electrowinning experiments. The concentrate and solution were continously mixed during leaching by means of 75-mm-diam stainless steel paddles rotated at 575 rpm. Decomposition reactions that occur during leaching are expressed by equations 1 through 3.
The postleaching procedure included shutting off the external oxygen pressure, slowly releasing the internal autoclave pressure to the vapor pressure of the solution, cooling to -60° C, and finally disassembling and filtering the resulting slurry through acid resistant paper in a Buchner type funnel.
Deposit Evaluation
Cathodes were prepared for deposition by polishing with 240-grit alumina cloth, rinsing with water, wiping with ethyl alcohol, and drying in air. At the completion of an electrolysis period, nickel deposits were removed from the cell, washed in water, air dried, and weighed to obtain current efficiency values. For physical
(FeNi)9S2 + 4.5O2 + 9H2SO4 → 4.5NiSO4 + 4.5FeSO4 + 8S° + 9H2O………………………………….(1)
FeS + 0.5O2 + H2SO4 → FeSO4 + S° + H2O……………………………………………………………………….(2)
CuFeS2 + O2 + 2H2SO4 → CuSO4 + FeSO4 + 2S° + 2H2O…………………………………………………..(3)
evaluation, the deposits were stripped from the cathode and examined using photomicrography and scanning electron microscopy (SEM). For determining grain structure and the sizes and distributions of voids, cross sections were cut from the geometrical center of the deposits, mounted in clear plastic, sanded to a 600-grit surface, polished with 20- then 5-µm alumina powder, and finally etched at 50° C in a sulfuric acid hydrogen peroxide solution for 5 to 10 min. Photomicrographs were obtained at magnifications up to 600. SEM examinations were used to evaluate the uniformity of deposit growth, crystalline size, and evidence of the initiation of nodular formations.

Results
Synthetic Electrolyte
Electrochemical Studies
In order to determine the effect of electrolyte flow rate on the electrochemical parameters for nickel deposition from dilute solutions, slow (5 mv/s) potentiodynamic sweeps from the open-circuit potential to approximately the hydrogen evolution potential were carried out at a number of flow velocities between 0 and 2.1 m/s. The electrolytes contained either 5 or 1 g/l Ni²+, and the temperature was 50° C.
Immediately prior to the potentiodynamic sweeps, a thin coating of nickel was deposited on the blank nickel 200 alloy cathode to ensure that the resulting polarization curves would be representative of Ni-Ni²+ deposition reaction. Following this procedure, the open circuit potential still remained somewhat unstable, varying between 0 and 0.1 v (SHE). This instability can probably be attributed to the lack of a truly reversible equilibrium for the Ni- Ni²+ couple and to the existence of other electrochemical reactions such as
NiO2 + 4H+ + 2e- ↔ Ni²+ + 2H2O…………………………………………………….(4)
and O2 + 4H+ + 4e- ↔ 2H2O…………………………………………………………….(5)
so that the open-circuit assumed a mixed potential value.
Potentiodynamic current-voltage (I-V) curves for a nickel electrolyte containing 5 g/l Ni²+ are shown in figure 4. Similar results were obtained at all three electrode locations along the length of the cell. Each curve has been corrected for the resistive voltage (IR) component of the electrolyte using a measured resistivity of 19.53 ohm-cm and a Luggin probe distance of 1.3 mm.

The onset of nickel deposition occurs at 0.65 to 0.75 v. The thermodynamic potential for nickel deposition at this concentration is -0.31 v, and the relatively large over voltage (0.34 to 0.44 v) can probably be attributed to a large activation over voltage.
The I-V curve for zero flow exhibits a well-defined limiting current density (iL) of approximately 100 A/m² extending from ∼-0.65 to -0.9 v as expected for deposition under diffusion limited conditions. At potentials more negative than -0.9 v, the rise in current density corresponds to hydrogen evolution, as evidenced by visible gaseous evolution at the electrode surface.
With flow rates in the laminar range (0.05 and 0.10 m/s), somewhat less defined plateaus are observed. Above flow rates of 0.10 m/s, the current density over the diffusion limited region develops a finite slope that increases with increasing velocity. Finite slopes over this region also have been observed for copper deposition in channel type cells. This characteristic of the diffusion limited region has been attributed to a larger current density (thinner diffusion layer) towards the leading edge of the electrode than towards the trailing edge. Under controlled potential conditions, this current density gradient along the electrode obscures the plateau normally associated with a diffusion limited current.
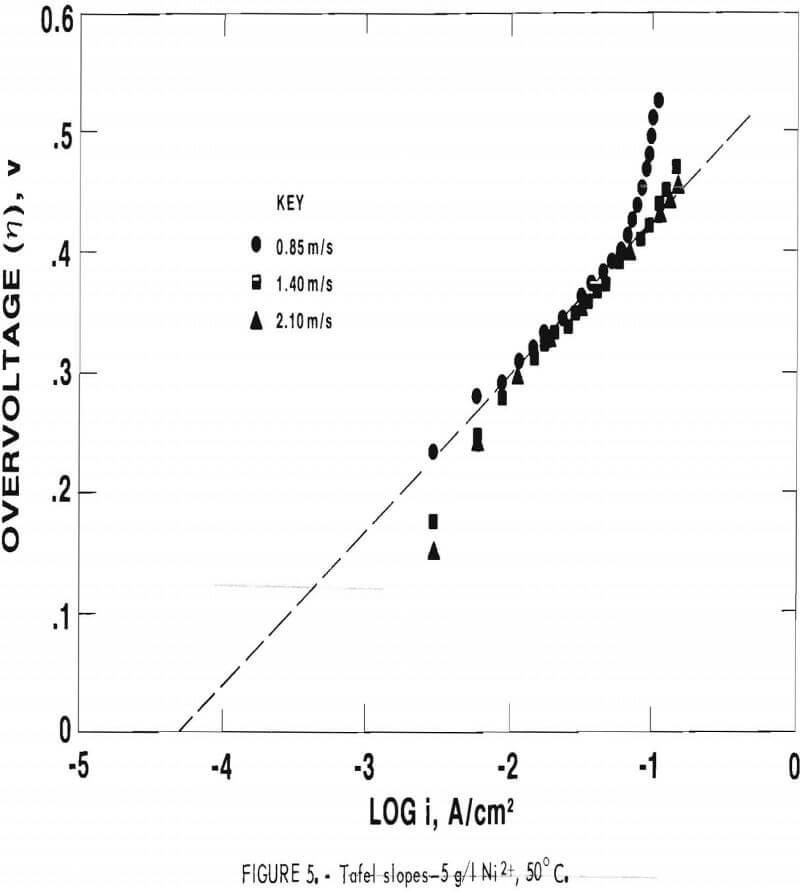
Analysis of the I-V curves using the relationship n – a + b log i (where n is overvoltage, a and b are Tafel constants, and i is current density) for the 5 g/l Ni²+ electrolyte at velocities of 0.85, 1.4, and 2.1 m/s (fig. 5) yields a Tafel slope (b) of – 0.13, an exchange current density (i0) of 5 X 10 -5 A/cm², and a transfer coefficient (α) of =0.24. These values are reasonably close to values reported in the literature.
At the onset of the diffusion limited region (fig. 4), the deposition rate is controlled by the flux of nickel ions to the electrode surface. This flux increases with increasing velocity owing to a thinning of the diffusion layer and thus, increases the range of current densities where nickel can be deposited. At low velocities, in the range of laminar flow, the limiting current density (iL) and the diffusion layer thickness (δ) for deposition onto a plate electrode at a position x from the leading edge of flow are given (1) by

where U is the velocity of the electrolyte parallel to the electrode plane at an infinitely large distance from it, v is the kinematic viscosity of the electrolyte, D is the diffusivity, C is the concentration of nickel ions in the bulk solution, Z is the number of electrons transferred, and F is the Faraday constant.
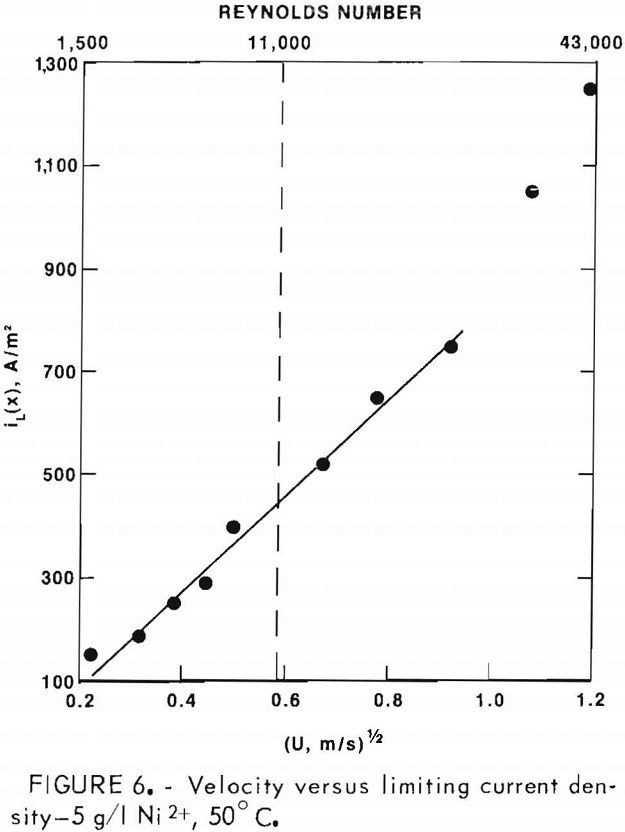
Figure 6 shows a plot of the experimental iL(x) values versus U½ where the iL(x)’s represent those obtained at the onset of the diffusion limited region (fig. 4). The laminar and turbulent flow regions are defined in terms of Reynolds number (Re) which is related to factors such as cell geometry, flow rate, and kinematic viscosity of the solution. Re values under 3,000 are generally considered to be indicative of laminar flow, whereas Re values above 11,000 are considered to be characteristic of fully turbulent flow. A mixed transition region exists between these two values. The experimental values of iL(x) were found to depend on U½ and to extend significantly into the turbulent region.
Using equation 6 and the slope obtained from figure 6, the diffusivity value for the nickel ion was calculated to be 3.7 x 10 -5 cm²/s. A diffusivity value of 3.9 x 10 -5 cm²/s was obtained using a rotating disk electrode, further substantiating the reliability of the experimental iL(x) values even though clearly defined limiting current plateaus were not observed with increasing velocity.
In another series of potentiodynamic sweeps with the 5 g/l Ni²+ electrolyte, the activation energy (EA) for the deposition of nickel was determined from the I-V curves at 30° , 35°, and 40° C using a velocity of 0.85 m/s. The effect of temperature on the rate (i) of an electrochemical reaction is expressed by the Arrhenius equation
ln i = (EA – ZαηF)/RT…………………………………………………………(8)
and EA must be determined at constant overvoltage (η). An Arrhenius plot (ln i verses 1/T) at a constant overvoltage of 0.41 v, assuming a shift of -0.01 v in reversible electrode potential from 30° to 40° C, shows the expected linear relationship (fig. 7) and yields an activation energy of =19.8 kcal/mole. A value of 21 kcal/mole has been reported for a 0.5M NiSO4 electrolyte utilizing reversible potential data obtained at 25° and 45° C.
Potentiodynamic I-V curves for a nickel electrolyte containing 1 g/l Ni²+ with a thermodynamically reversible potential of -0.33 v are shown in figure 8. Similar results were again obtained at all three electrode locations. Each curve was also corrected for the IR component of the electrolyte (resistivity = 18.80 ohm-cm), A well-defined limiting current density plateau was observed only at zero flow and the onset of nickel deposition was

essentially in the same voltage range as for the 5 g/l Ni²+ electrolyte. Analysis of the I-V curves for the 1 g/l Ni²+ electrolyte at several velocities yielded a Tafel slope of 0.13, an exchange current density of = 3 X 10 -5 A/cm², and a transfer coefficient of -0.24.
The Tafel region extended to current densities of 1,400 and 200 A/m² for 5 and 1 g/l Ni²+ electrolytes, respectively, using the maximum flow rate of 2.1 m/s. Accuracy of the exchange current density value determined for these electrolytes is limited by the accuracy of the Tafel slope and the reversible potentials at each Ni²+ concentration. There is some uncertainty in the Tafel slope because of the existence of some diffusion control and codeposition of hydrogen in the Tafel region for nickel deposition.

Deposit Evaluation
5 g/l Ni²+ Electrolyte
Nickel electrodeposits were prepared for evaluation at flow rates and current densities corresponding to the letters A through F on the I-V curves (fig. 4). Cross section photomicrographs of the respective deposits are shown in figure 9. Excellent deposits exhibiting a coarse-grained columnar structure typical of sulfate electrolytes were obtained using deposition conditions where essentially no mass transport limitation of the nickel ions existed, that is, the deposition region characterized by the sharp increase in current density near -0.65 v.
Deposits B, D, and F (240 A/m², 0.15 m/s), (530 A/m², 0.60 m/s), and (800 A/m², 1.40 m/s), respectively, correspond to deposits prepared in this region. Deposit A produced at 320 A/m² and 0.15 m/s was nonconsolidated and exhibited large voids and nodular formations, reflecting growth in the limiting current region. Deposit C produced at 750 A/m², 0.60 m/s was a more compact deposit than A containing small voids. It was also produced in the mass transport limiting region but under less stringent polarization conditions. Current efficiencies for deposits prepared in the mass transport limiting and the activation controlled deposition regions ranged from 80 to 95 pct.
The nonconsolidated character of deposit E, (1,400 A/m², 1.40 m/s) indicated that it was prepared at conditions outside of the activation controlled region, although the transition from activation control to mass transport limiting conditions was difficult to detect from the I-V curves. Apparently, at this high flow rate the gradient in current density along the length of the electrode almost totally obscures the diffusion limited current. SEM photographs of the surface of deposits A, C, E, and F are shown in figure 10. Deposit F shows the expected smooth, consolidated surface whereas deposits A, C, and E show varying degrees of nodular formation and crystal growth.
In addition to the poor physical quality of deposit E, the current efficiency decreased to 65 pct, indicating that the overvoltage for hydrogen evolution decreases with increasing flow rate. Decreases in current efficiency were also observed for deposits prepared at 450 and 600 A/m² (not designated on figure 4) when the flow rate was increased from 0.85 to 1.40 m/s, although for these deposits the microstructure remained consolidated and columnar.
Yeager also reported a decrease of 0.35 v in the overvoltage for hydrogen evolution on a nickel substrate when ultrasonic waves were used to agitate solution in the region near the


electrode surface. In comparison, there appeared to be a decrease of =0.075 v in the overvoltage for hydrogen evolution when the velocity was increased from 0 to 2.10 m/s (fig. 4) in the high mass transport channel cell.
Numerous theories have been advanced regarding the rate-determining mechanism of hydrogen gas discharge at a solid electrode surface. These include the combination of atomic hydrogen into H2 molecules, the formation of hydrogen bubbles, the diffusion of H+ to the electrode, as well as adsorption-desorption phenomena associated with hydrogen atoms, molecules, and ions. The kinetics of one or all of these mechanisms could be affected in the transition from free convection to laminar to turbulent flow in the electrowinning cell, but it is beyond the scope of this report to discuss these kinetic factors. However, the practical significance of a decrease in hydrogen overvoltage is to limit the range of acceptable deposition currents.
1 g/l Ni²+ Electrolyte
Electrodeposits were also produced for physical evaluation from an electrolyte containing only 1 g/l Ni²+. Photomicrographs and SEM photographs for two electrodeposits produced at G and H (fig. 8) are shown in figure 11. These deposits were prepared using a velocity of 1.40 m/s. Deposit G, produced in the activation controlled deposition region at 210 A/m² was well consolidated while deposit H, produced at conditions where significant mass transport limitation existed (450 A/m²), was poorly consolidated showing large voids and dendritic growth. A decrease in current efficiency from 76 to 68 pct was observed as the current density was increased from 210 to 450 A/m².
The rates of deposition of satisfactory nickel deposits from a 1 and 5 g/l Ni²+ electrolyte flowing at 1.40 and 0.15 m/s, respectively, are similar to those obtained for industrial nickel electrowinning from a 60 g/l Ni²+ electrolyte operated under essentially static conditions.
Leach Electrolyte
After establishing the hydrodynamic and electrodeposition parameters for producing satisfactory nickel deposits from synthetic electrolytes, the results were used to test the feasibility of utilizing the high mass transport cell to electrowin nickel from a dilute leach solution. These experiments involved (1) preparing a bulk quantity of leach electrolyte by pressure leaching, (2) removing some of the metal ion impurities from the electrolyte using appropriate purification procedures, and (3) conducting preliminary nickel electrowinning experiments with the resultant leach liquor.
Leaching
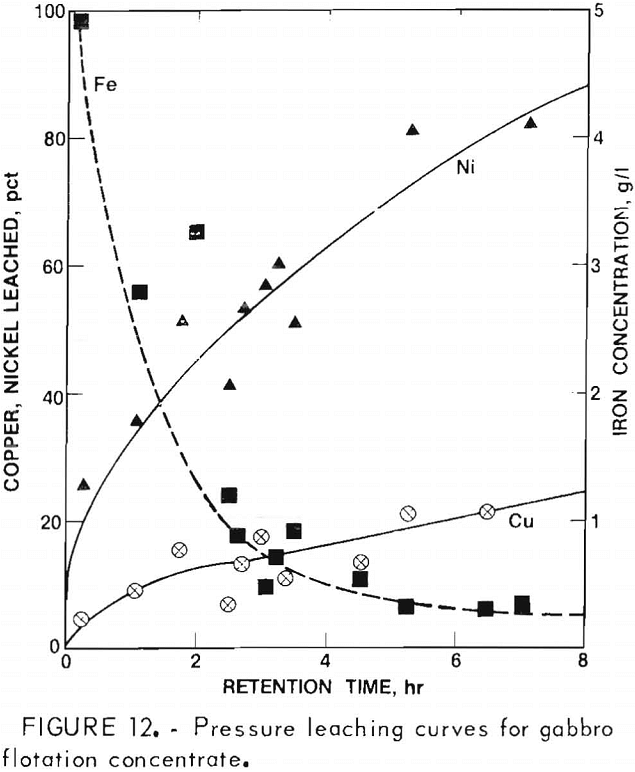
Typical leaching results for Ni, Cu, and Fe are shown in figure 12. In a 7-hr leaching test, 80 pct of the nickel and approximately 20 pct of the copper were leached. As acid was consumed during leaching the pH increased from 1 to 1.7. Correspondingly the dissolved Fe²+ was oxidized, hydrolyzed, and precipitated as ferric oxide (Fe2O3·xH2O) which decreased the iron content of the solution to 0.3 g/l. Using a solution-to-ore-concentrate weight ratio of 5, the nickel and copper leached from the ore corresponded to concentrations of 3.4 and 4.8 g/l, respectively. Between 30 and 40 percent of the Co, Zn, and Mn was also dissolved during this leaching period, as well as 2 to 5 pct of the Ag, Pb, and Cd.
After combination of several leach liquors and dilution with Na2SO4- H3BO3 solution to obtain the desired volume of 45 1, the final concentration of electrolyte was, in g/l: 1.0 Ni, 1.5 Cu, 0.084 Fe, 0.05 Co, 0.06 Zn, 0,01 Mn, 0.004 Pb, 0.003 Cd, and 0.0001 Ag.

Purification
Although the leach solution obtained from the complex bulk flotation concentrate contained several metallic ion impurities, studies to remove iron and copper prior to nickel electrowinning experiments were given particular attention.
Controlled potential electrowinning was studied as a method for removal of copper from the leach solution. The channel cell system was utilized with the only modification being an increase in electrode size for increasing the total current through the cell. One large titanium cathode and an equally large Pb-6Sb anode spanning the height and length of the electrolysis section replaced the three independent smaller electrode pairs used for studies with synthetic electrolyte. An electrolyte flow rate of 1.40 m/s was maintained.
Sixty-five percent of the initial 1.5 g/l Cu in the leach solution was removed by potentiostatically electrowinning (-0.28 v (SHE)) at an average current density of 120 A/m² and a cathode current efficiency of 80 pct. The physical quality of the electrowon copper was excellent (fig. 13), and the purity of the copper was about 99.9 pct. The deposit contained 25 ppm (0.0025 pct) Ag. Copper remaining in solution was reduced to 0.003 g/l in an additional electrolysis at an average current density of 48 A/m², but the quality of this material was dark and powdery and it was deposited at much lower current efficiencies.

The iron impurity remaining in solution after leaching was removed by a subsequent procedure that consisted of oxidation of the iron with O2 air, or another suitable oxidizing agent such as H2O2, adjustment of the pH to 3.5 with calcium carbonate or caustic, and finally heating the solution to 85° C to effect a more complete hydrolysis and precipitation. The leach electrolyte initially containing 0.084 g/l Fe was decreased to 0.020 g/l Fe using this procedure. Some hydrolysis and coprecipitation of nickel also occurred, resulting in a 7-pct decrease of nickel in solution.
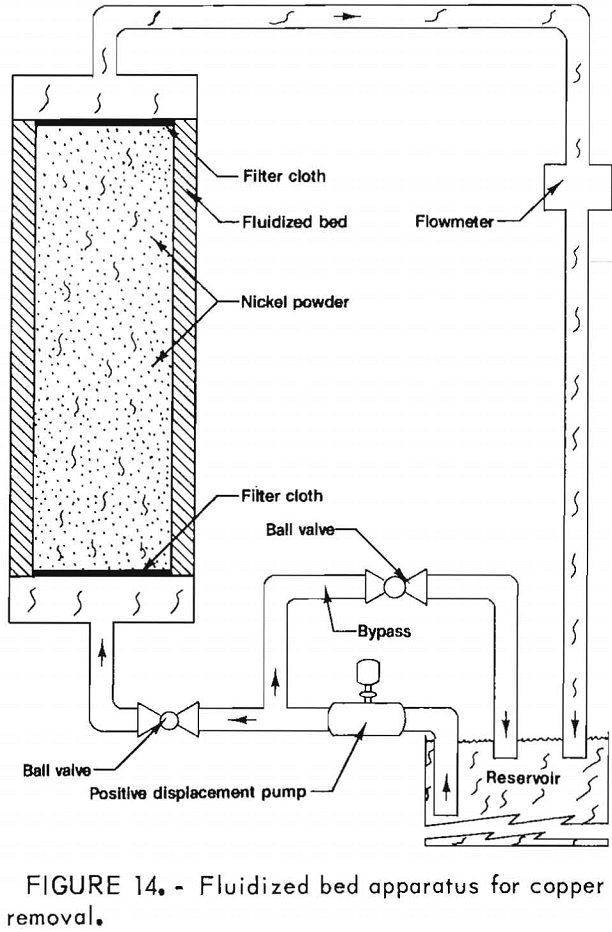
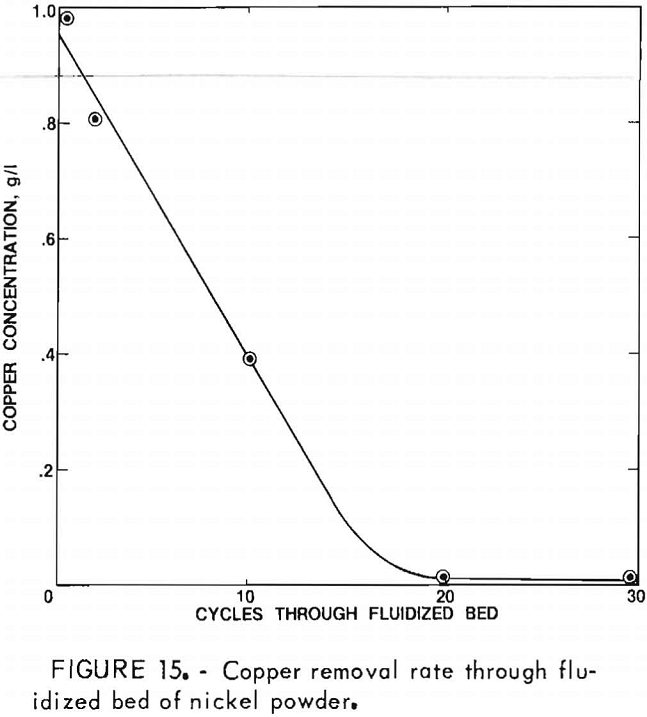
In addition to the purification steps conducted on the leach solution, associated tests were conducted with a synthetic solution to establish a rapid, efficient method for removing low concentrations of copper. A solution containing 5.0 g/l Ni and 1.0 g/l Cu was decreased to 0.0002 g/l Cu after 30 cycles of the solution through a fluidized bed (fig. 14) of active nickel powder (<100 µm), using a flow rate of 0.003 m/s. A weight ratio of 10:1 nickel powder to total copper was employed. Most of the copper was removed after 17 cycles as illustrated in figure 15.
The removal of small quantities of lead was accomplished using controlled potential electrolysis in the channel cell. Electrodeposits containing 70 pct Pb were obtained at a potential of -0.6 v from a synthetic solution containing 3 g/l Ni and 0.005 g/l Pb flowing at a velocity of 1.40 m/s. The potential for lead deposition was about 0.05 v less electronegative than for deposition of nickel. The flow of electrolyte increased the limiting current density for lead deposition so that a practical current density of 20 A/m² could be obtained.
Nickel Electrowinning
Electrowinning experiments were conducted to recover nickel from the dilute leach electrolyte that had been purified of copper and iron to the levels of 0.003 and 0.02 g/l, respectively.
After a few preliminary electrolyses an electrodeposit containing 84 pct Ni was attained from a solution containing 0.75 g/l nickel ion (table 2). Major impurities were Zn, Co, Cu, and Fe. Hie cathode current efficiency for Ni reduction was -65 pct. This deposit was produced at 200 A/m² using an electrolyte flow rate of 1.40 m/s. These conditions were similar to those established for satisfactory deposition from a synthetic electrolyte containing 1.0 g/l Ni.

Deposits produced at a lower current density (100 A/m²) and a higher velocity (2.10 m/s) contained 30 pct Ni , 15 pct each of Pb and Zn, and less than 1 pct of each of Cd, Co, Fe and Mn.
The total metal content in each of these deposits was less than 100 pct. The balance was apparently related to the coprecipitation of a yellow solid during electrowinning. Recovery of a sample of this material and subsequent analysis by proton induced X-ray emission showed it to contain about 40 pct Ni, 15 pct Fe, and a substantial quantity of O2 (likely a mixed oxide).
In a continuing series of electrowinning experiments with the leach solution, further studies were conducted to determine the deposition rate of the remaining impurities, To conduct these experiments the concentration of the nickel ions was increased from 0.75 to 2,80 g/l by addition of nickel sulfate hexahydrate.
Results of nickel electrowinning experiments at 300 A/m² with this leach solution predictably showed, under constant hydrodynamic conditions (0.85 m/s), that the rate of codeposition of impurities decreased nearly proportionally with the concentration of impurities in solution (table 3). Progressive purification of the solution and gradual deposition of higher purity nickel would likely occur in subsequent electrolysis stages; however, an optimum nickel purity would not be attainable by this method until the nickel ion concentration in solution also had decreased significantly.
Results in table 3 also show that coprecipitation of oxides again occurred during these electrolyses as evidenced by the metal content of less than 100 pct. Apparently the amount of nickel as oxide was greater in the first deposit but the reason for this difference was not established. It is assumed that additional measures must be taken to insure adequate buffering near the electrode surface. This would prevent locally high pH regions where the nickel ion might tend to hydrolyze and precipitate.
Since mass transport of impurities as well as nickel is affected by the hydrodynamics of the solution, several experiments were conducted at 200 A/m² to determine the effect of velocity on the impurity deposition when electrolyzing at conditions established to be in the range of satisfactory nickel deposition (table 4). When the velocity was increased from 0.85 to 1.40 m/s, the percentage of the more electropositive impurities, Pb, Cu, and Cd increased in the deposit by 6, 5.5, and 4 times, respectively, while that of iron remained essentially unchanged. The percentage of zinc, a more electronegative metal not normally expected to codeposit, actually increased by a factor of 2.5 as the velocity was increased. The presence of zinc ions increases the overvoltage for nickel deposition by as much as 0.3 v, leading to coreduction of zinc and nickel ions. Apparently this increase in overvoltage is due to the adsorption of a zinc hydroxide layer on the cathode. Zinc hydroxide may actually shift the deposition potential for nickel slightly more electronegative than that for zinc, since the zinc deposition rate increased with velocity in a manner similar to the more electropositive impurities. These results suggest that with careful control of the cathodic potential and the electrolyte velocity, a more selective removal of zinc could be achieved.

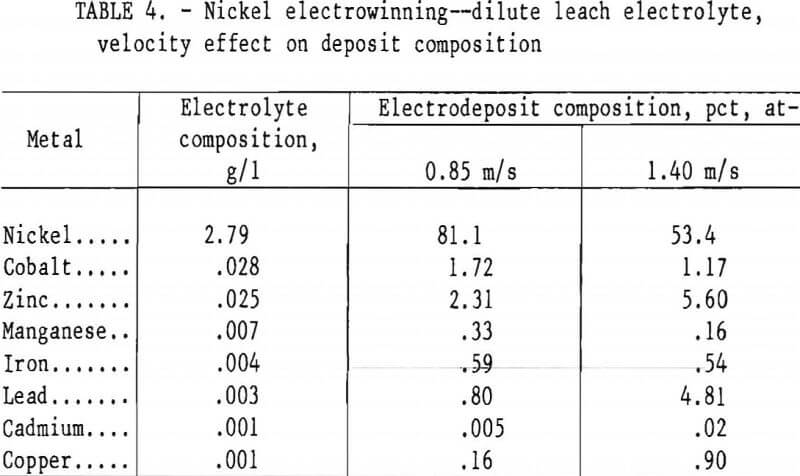
Some codeposition of manganese was observed even though the thermodynamic potential for Mn²+ reduction is an additional 0.12 v more electronegative than for the coreduction of zinc and nickel. This may result from potential gradients on the electrode surface of sufficient magnitude to deposit small quantities of manganese. Deposition of manganese decreased by 52 pct as the velocity was increased from 0.85 to 1.40 m/s.
The overvoltage for cobalt deposition is probably increased by the presence of zinc ions in a manner similar to nickel. According to the results in table 4, the percentage of cobalt in the electrodeposit was decreased by 32 pct as the velocity was increased, indicating its retention in solution at properly controlled potentials and velocities; thus allowing for its subsequent recovery. Cobalt could, of course, be removed by precipitation as cobaltic hydroxide after oxidation with chlorine or nickelic hydroxide, a common practice in purifying nickel electrorefining solutions.
Conclusions
Electrochemical data for nickel deposition from dilute solutions, including Tafel constant, exchange current density, transfer coefficient, and activation energy values, compared closely with values reported in the literature.
Limiting current density plateaus are not clearly defined on the I-V curves at increasing velocities due to a current density gradient along the length of the electrode which obscures the plateau. However, using the value obtained at the onset of the diffusion limited region as the limiting current density value, it was observed to vary as the square root of the velocity significantly into the turbulent region.
Hydrodynamic and electrodeposition parameters were established for producing suitable nickel electrodeposits from pure dilute (1 to 5 g/l Ni) electrowinning type solutions, utilizing a high mass transport channel cell. Cathode current efficiencies for favorable deposits ranged from 75 to 95 pct. Excellent nickel electrodeposits, free of voids and exhibiting a columnar crystal-line structure, were obtained at -210 and 800 A/m² for 1 and 5 g/l Ni electrolytes, respectively, using an electrolyte flow of 1.40 m/s. Corresponding current efficiencies were 76 and 83 pct.
Electrowinning studies conducted with an impure dilute leach solution prepared from the Duluth gabbro ore flotation concentrate yielded an electrodeposit containing 84 pct Ni. In related electrolyte purification studies, copper and iron were removed effectively from the leach solution to levels as low as 0.003 and 0.020 g/l, respectively, using electrowinning and precipitation techniques.
Selective electrolytic removal of lead ions was also demonstrated to be possible using a closely controlled cathodic potential and a rapid flow of electrolyte to increase mass transfer of lead ions. At an electrode potential of -0.6 v, deposits containing 70 pct Pb were obtained using a synthetic electrolyte.
The presence of zinc ions in solution reportedly increases the overpotential for nickel electrowinning by -0.3 v causing the codeposition of significant quantities of zinc. Electrolytic removal of zinc from the leach solution was increased by a factor of 2.5 as the electrolyte flow rate was increased from 0.85 to 1.40 m/s, suggesting that, with careful control of the cathodic potential and the electrolyte velocity, a more selective removal of zinc impurity would be achieved. The deposition rate for removing the more electropositive impurities, Pb, Cu, and Cd, increased by factors of 4 to 6 when the velocity was increased from 0.85 to 1.40 m/s.
Electrolyte purification and nickel electrowinning studies demonstrated the feasibility of applying dilute solution electrowinning technology to the hydrometallurgical processing of complex low-grade ore concentrates. Advances in the technology for electrowinning from dilute solutions would provide a method whereby direct recovery of metals could be accomplished at a very early stage in the mineral processing procedure.
