Table of Contents
This report briefly reviews the essential features of moment analysis and describes extension of this method to size reduction by ball mill grinding.
Method of Analysis of Size Distribution Data
Size analyses of mineral products are usually made by screening with a set of sieves having mean apertures arranged in the Tyler scale, which is a geometric progression with a constant ratio equal to the square root of two. For this reason it is convenient to represent particle size as a logarithmic function of the particle diameter
X = l/log√s log(d/do)……………………………………………………(1)
where s = l/√2
d = particle diameter,
and do = reference diameter.
The variable, x, may be defined as the logarithm to the base s of the ratio of the particle diameter to the reference diameter, d. The inverse of the transformation given in equation 1 is given by equation 2:
d = dosx…………………………………………………………………(2)
The reference diameter may be any convenient standard length such as the mean aperture of the largest standard sieve used in the screen analyses.
The kth moment about an arbitrary axis, xo for a set of size distribution data is defined by equation 3:

where yi is the weight fraction in the size interval between xi-l and xi; N is the total number of size intervals. If the reference diameter is equal to the maximum sieve aperture represented in the screen analysis and this is taken as the axis for the first moment, xo is zero and the first moment is the value of x corresponding to the mean particle size:
vl = x………………………………………………………………(4)
The first moment or mean provides a unique axis for determining all higher moments.Moments about the mean are represented as follows:

These higher moments contain the essential information concerning the form of the distribution function; that is, they are parameters that measure various aspects of the way in which the weight fraction is distributed about the mean. The second moment, or variance, measures the width of the distribution; the third moment measures the skewness or asymmetry; the fourth moment measures the kurtosis or peakedness; etc. Obviously, higher moments are increasingly dependent on values of the weight fraction remote from the mean which represent only a small fraction of the sample. For this reason, moments beyond the fourth are usually not considered. The third and fourth moments are usually represented as dimensionless ratios with respect to the second moment:

Moment analysis is a well-established method for analyzing and characterizing statistical distribution. Quoting from one of the standard treatises in mathematical statistics: “For all ordinary purposes, therefore, a knowledge of the moments, when they exist, is equivalent to a knowledge of the distribution function: equivalent, that is, in the sense that it should be possible theoretically to exhibit all the properties of the distribution in terms of the moments.The procedures that have been developed for computation of moments and deriving distribution functions that best fit the data are fully discussed in a book by Elderton which has recently been published in a new edition. The application of moment analyses to particle size distribution data is discussed in a previous paper by the author.
Size Reduction by Impact Crushing
When uniform sized samples of cryptocrystalline quartz were crushed by impact in a drop-weight machine, the reduction in size, as measured by the change in the mean value of x, was found to follow the relationship in equations 8 and 9

Equation 8 is an empirical relationship derived by multiple regression analyses of various combinations of independent variables from the data on the impact crushing experiments. The logarithms of E, the impact energy per unit weight of mineral, and d0, the initial mean particle diameter, gave the greatest decrease in variance between the observed and expected values. The threshold energy, Eo, which is the energy corresponding to zero size reduction, varies approximately inversely as the diameter of the particle being crushed.
Analyses of other data obtained by Hukki, using a double pendulum apparatus for impact crushing, gave slightly larger values for the coefficients in equations 8 and 9 and the exponent of do was slightly larger than one. If the exponent of do is assumed to be unity, the equation derived for the combined data from the Hukki and Bureau of Mines experiments gives the equations 10 and 11

These equations represent a best fit of data from 39 experiments on impact crushing of quartz particles ranging in size from .156 to 5.75 cm in diameter. The standard error for Δx is .387 as compared with 1.192 for the observed data.
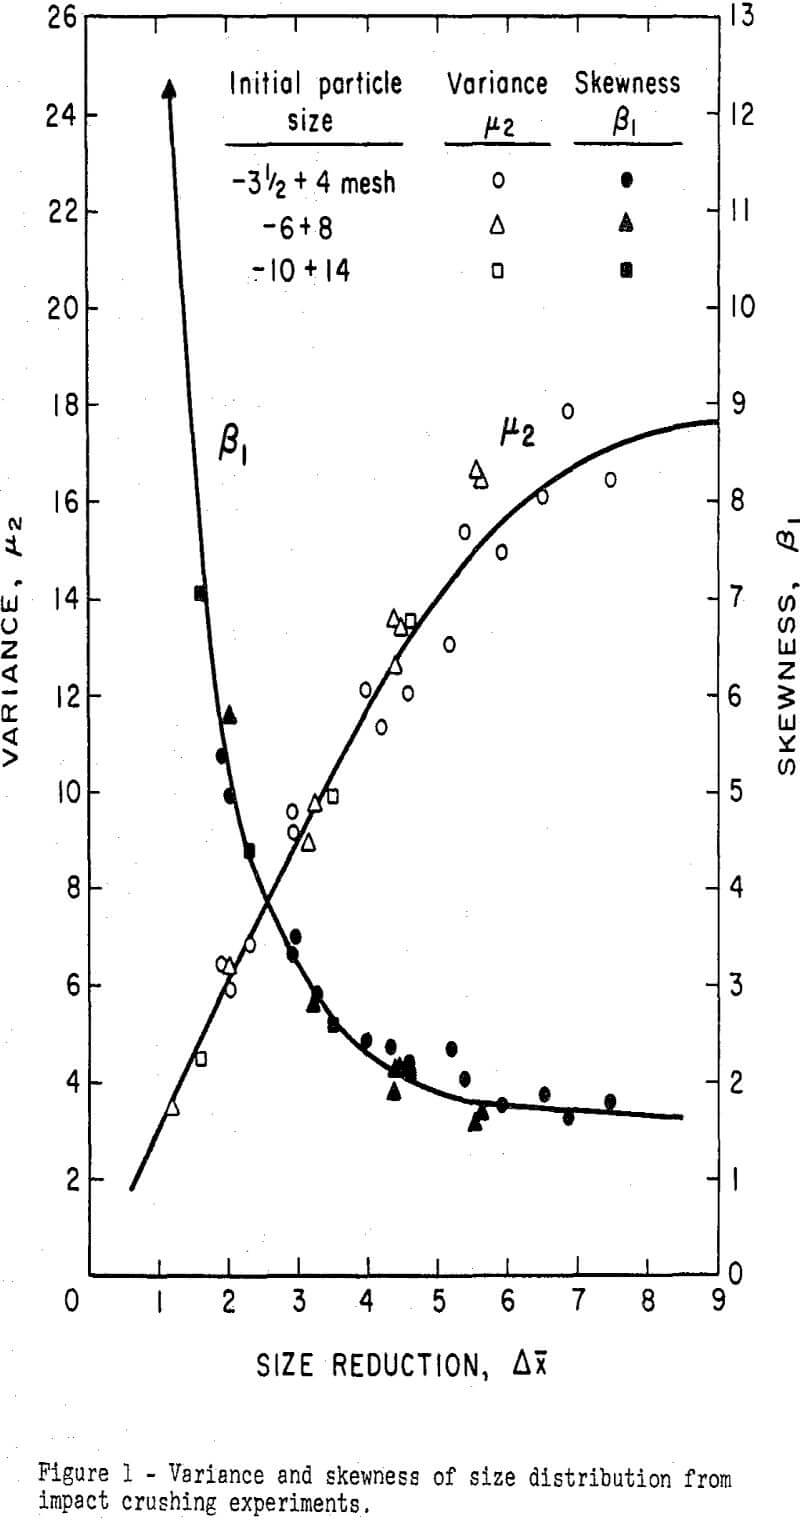
The form of the distribution curve was found to be primarily a function of the size reduction. The distribution function of the initial uniform sample is a delta function. As soon as any size reduction occurs, there is a transfer of material to a wide range of sizes thereby increasing the dispersion. The change in distribution is asymetric since crushing transfers material only to the finer sizes, and so the skewness, as measured by β1, initially has a very large value. In other words, as a uniform sample is progressively decreased in size, there is a progressive increase in dispersion as measured by µ2 and a decrease in skewness as measured by β1.
These changes are shown in Figure 1 which depicts the changes in distribution that occur in size distribution when quartz samples are subjected to increasing impact energy. As size reduction proceeds, the effect of the initial uniform distribution is gradually obliterated and both ant! tend to approach steady values. The variance tends to approach a steady value of 18 which corresponds to a standard deviation of 4.25 or a little more than four intervals in the Tyler sieve scale. The skewness levels off at a value between 1.6 and 1.8.
Size Reduction by Ball Mill Grinding
The manner in which energy is employed in a ball mill to effect size reduction is much more complex than in simple impact crushing. The application of energy in a drop-weight machine is similar to that occurring in a stamp mill, in which a considerable size reduction is produced by a single impact of relatively high energy input. In a tumbling mill, such as a ball mill, the size reduction occurs by repeated application of kinetic energy of less intensity by impact and rolling action of a large number of crushing media, in certain circumstances an appreciable amount of size reduction may occur by abrasion.
A series of studies has been made at the University of California in Berkeley on the grinding of dolomite in a ball mill. These tests were made in a specially designed mill in which the input energy can be measured.
Berlioz has reported data on the size distribution at successive stages of size reduction in this mill.
A series of impact crushing experiments was made on a sample of the same dolomite used by Berlioz. The results of those experiments are summarized in Table 1. The results of these experiments permit comparison of the size reduction by impact and by ball mill grinding for the same energy input. Differences in the behavior of the particle size distribution may also be observed.
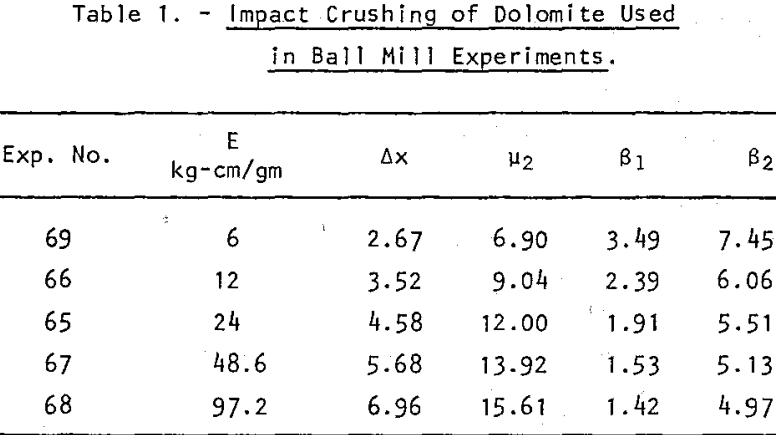
The reduction of size of dolomite particles is expressed by equations 12 and 13:

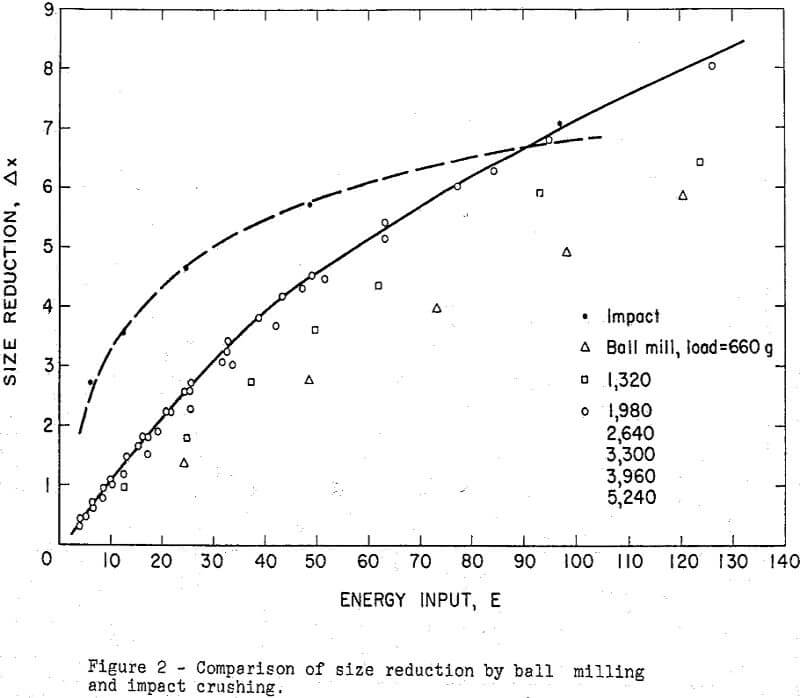
A comparison of the size reduction by impact and ball mill grinding is shown in figure 2. The ball mill experiments show the size reduction versus energy input for 7 series of experiments in which the weight of dolomite was 660, 1320, 1980, 2640, 3300, 3960, and 5420, respectively. The charge was composed of equal portions of -7 +8 and -8 +10 size fractions. The ball load was 455 stainless steel balls one inch in diameter, having a total weight of 30 kg. The particle size distribution was observed after 20, 40, 60, 80, 100, 150, 200 and 300 ball mill revolutions. The energy input was calculated from the net torque (corrected for the torque for the empty mill) and the number of revolutions.
For light ball loads the ball mill is less efficient as might be expected. As the load exceeds 1980 gm it has no influence on size reduction. The relationship between size reduction and input for optimum grinding in the ball mill is represented by the solid curve. The corresponding relationship for crushing by impact is represented by broken lines.
It is evident, as might be expected, that for moderate size reduction (Δx<5) the input energy is utilized much more effectively in the drop-weight machine than in the ball mill. For example, reduction to one-half of the original particle size requires about 4-3 kg cm per gm by impact as compared to 18.5 kg-cm by ball mill; that is, the energy requirements are less than 25 percent as much for impact crushing as for ball milling. For great size reduction the application of energy by a single impact becomes less effective so that there would be no advantage in applying more impact energy than would be required for about a four-fold reduction of particle diameter; this is equivalent to Δx = k. The energy required would be about percent that required for an equivalent size reduction in the ball mill.
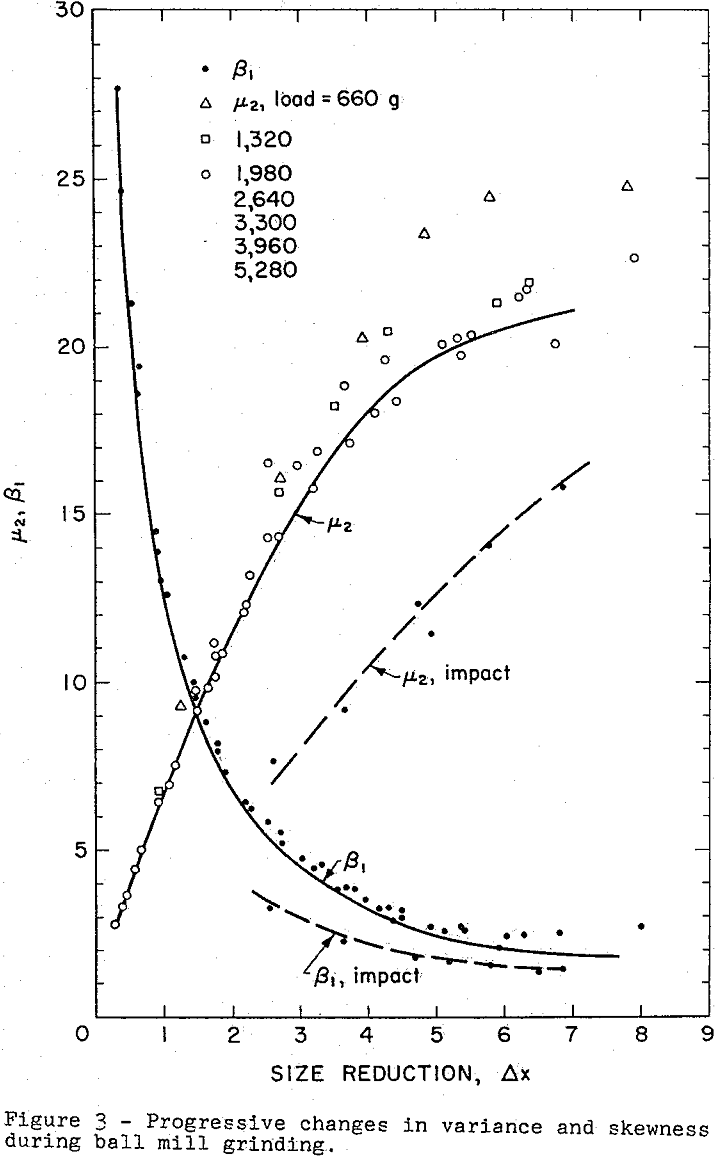
The change in particle size distribution during ball milling is shown by the graphs of the variance and skewness in Figure 3. Here again, the points representing variance for those experiments with light ball mill loads show a noticeable divergence from those for optimum loading. The skewness is not affected by the load.
The differences in distribution between the products from the ball mill and those from impact crushing can be observed by comparing the solid lines, which represent the ball mill products, with the broken lines, which represent the products from the drop-weight experiments. The greatest difference is in the variance. The products from the ball mill show considerably greater dispersion over the size range and this dispersion develops sooner as the mean size is decreased. On the other hand, the skewness decreases earliest for impact crushing. The differences in size distribution are essentially difference in degree of dispersion and asymmetry. Actually there is a surprising similarity in the evolution of the distribution from uniform particle size to a typical skewed bell-shaped curve as the size is reduced whether by the ball mill or impact crushing.
Summary
The comminution process may be represented mathematically in terms of a set of state variables that define the mean size and size distribution of the feed to and product from a grinding machine. Three variables are required to specify the particulate state of the mineral undergoing size reduction; these variables define quantitatively the mean particle size, degree of dispersion and asymmetry of the distribution. Such a set of variables may be calculated by moment analysis of the screen analysis of the aggregate being studied. Conversely, if the mean, variance, and skewness of a size distribution are known, a gamma distribution function may be derived that will approximate the weight fraction in any given size range.
If a known amount of impact energy is applied equally to an aggregate of particles of a given particle diameter, do, the resulting size reduction is given by the equations
Δx = A log(E/Eo)
and Eo = B/do
The experimentally determined values of A and B for cryptocrystalline quartz were 1.90 and 0.8; for dolomite, 1.54 and 0.3.
When a sized fraction of particles is subjected to comminution, the size distribution undergoes progressive change characterized by a steady increase in the variance or second moment and an abrupt decrease in skewness or third moment. As size reduction proceeds further, both the variance and skewness approach steady values and the form of the distribution becomes more and more stable.
