Table of Contents
During the course of an investigation of the plastic flow of aluminum aircraft sheet under combined loads, several problems arose in which analyses of the conditions leading to unstable plastic flow were needed. In order to provide these analyses, and in the hope of attaining a better understanding of the general problem of unstable plastic flow, the present study was undertaken. It is well known that unstable plastic flow is associated with a form of mechanical instability frequently observed during the plastic deformation of ductile metals. This instability is characterized by the fact that, at its onset., plastic straining will proceed at a constant magnitude of the externally applied forces. It is further typical that the resulting unstable flow is generally accompanied by the formation of a neck, a local bulging, or some other form of heterogeneous deformation.
Perhaps the most familiar example of unstable plastic flow to the metallurgist is the formation of the neck in the ordinary tension test. It is well known that in this test most metals exhibit a maximum in the externally applied load, followed by the process commonly referred to as “necking down.” Instability in the simple tension test has been frequently discussed and numerous investigators have derived the criterion for instability in terms of a critical rate of strain hardening. It is the purpose of the present study to extend the criterion for unstable flow to the more general case where the body undergoing flow is subjected to combined loads. It is hoped that the problems considered will provide a more consistent picture of the general features of this important form of mechanical instability.
The most practical implications of instability in plastic flow arise in connection with sheet metal forming operations. In the formation of a great many sheet metal parts, the deformations are produced primarily by stretching. If the conditions which lead to unstable flow are fulfilled in such a formation, and if the resultant instability leads to a pronounced localization of flow, then the useful limit of ductility of the material will have been reached.
It is also essential that the effects of instability be taken into consideration in any study of the plastic flow and rupture of metals under combined stresses. In general, when unstable plastic flow is initiated, straining becomes localized, the geometry of the test specimen changes, and the state of stress in that portion of the specimen undergoing plastic flow is no longer under external control. In many past studies of the effects of combined stresses on flow and rupture, account has not been taken of the fact that, although a given test may be started under constant stress ratio conditions, these conditions cannot be preserved after the onset of instability, and the stress ratio varies in some unknown manner from the point of instability to rupture. As a result, in many cases conclusions regarding the nature of flow and fracture of ductile metals have been drawn which are not warranted. For example, the significance of the work of Maier, which is frequently quoted in support of the critical normal stress criterion for rupture, is almost completely obscured by the failure to take into account the complex stresses introduced during unstable flow.
A further practical problem in which unstable plastic flow may be of importance is in the design of structures in which some plastic deformation may occur. Caution must be exercised so that the allowable deformation is not great enough for unstable flow to occur, since this would obviously lead to failure of the structure.
It should be pointed out in introduction that the analyses to be presented herein only indicate the conditions under which unstable flow will be initiated for some particular methods of loading. Although it is known that in general the deformation will become localized at the onset of instability, the problem of predicting the shape which the body will assume while undergoing unstable flow is too complex for solution at the present time.
Instability in Simple Tension
Since the conditions leading to unstable plastic flow are well typified by the formation of the neck in simple tension, this problem will be reviewed in order to introduce more properly the more complex problems to be treated subsequently. The form of the load-extension diagram for the simple tension test is well known: the load rises at a gradually decreasing rate, passes through a maximum, and falls off, the diagram being terminated by fracture. At the maximum load, deformation becomes localized, and the specimen necks down. The physical picture of the events leading up to necking in simple tension has been frequently discussed and appears to be quite clear.
Two opposing tendencies are active in the simple tension test. One of these is strain hardening which tends to increase the load carrying capacity of the specimen. Acting against the strengthening effects of work hardening is the decrease of cross section of the specimen caused by its elongation in the direction of the test. This latter process obviously tends to decrease the load carrying capacity of the specimen as straining proceeds.
True stress-strain curves show that the rate of strain hardening (slope of the true stress-strain curve) decreases continuously with increasing strain, at least up to the maximum load. When the rate of stress increase caused by work hardening has decreased to a value below the rate of stress increase caused by the decrease in cross section, deformation will proceed under constant load and becomes localized. In other words, the rate of increase of load carrying capacity of the specimen effected by work hardening falls below the rate of decrease of load carrying capacity caused by the decreasing cross section.
This problem can be treated analytically quite readily. The load, L, on the specimen is given by
L = Aσ,
where A is the instantaneous area of the specimen and σ is the corresponding true stress.
The instantaneous area, A, is given by
![]()
where e is the natural logarithmic base, δ is the true strain in the axial direction given by

The condition for instability is that flow shall proceed at constant load, i.e. when
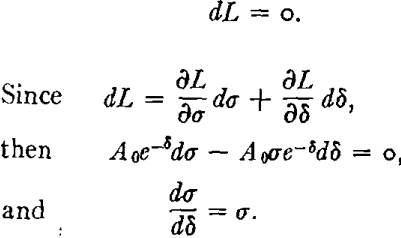
That is, necking will begin when the slope of the true stress-strain curve becomes numerically equal to the stress at the point of measurement. This condition can be imposed on the stress-strain curve graphically or, more conveniently, by use of an analytical expression for the stress-strain curve.
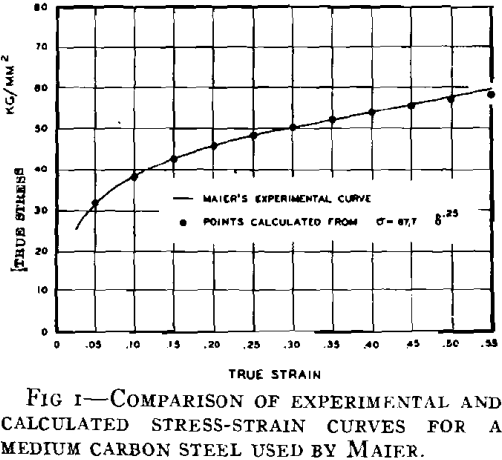
The true stress-strain curve for most metals can be approximated quite closely by the following relationship:
![]()
where k and n are material constants. The use of this empirical form for the true stress-strain curve has been discussed recently by Gensamer, Hollomon, and others. Since the form of the curve is determined by the two constants k and n, this power relationship provides a very convenient basis for comparison of flow curves of different materials. As an example of the close degree of approximation provided by this relationship, an experimental curve for one of the materials considered later in the paper is shown in Fig 1 along with points calculated using the k and n values found to give the closest fit to the experimental curve. The fit can be seen to be almost exact up to strains of about 0.5. Since the strains of interest in a discussion of instability are much smaller, the power relationship can be used quite safely in the analyses presented here.
Since σ = kδn.

The condition for instability as derived above is that
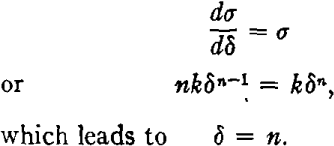
That is, the strain at the limit of uniform extension for a given material is equal to the value of the strain hardening exponent. A comparison of predicted and observed uniform elongations is shown in Table 1 for some aluminum alloys.
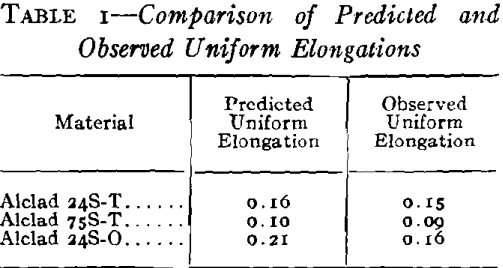
The observed uniform elongation values were determined on fractured 12 in. long by 2 in. wide tensile specimens by averaging elongations over several 1-in. gauge lengths outside the necked region of the specimen. It will be noted that for 24S-O, the observed value is considerably lower than the predicted value. This is a consequence of the tendency for deformation to be prematurely localized in this material, thus preventing theoretical uniform elongations from being attained over long gauge lengths. Strain markings (“Luder’s Lines”) which form during the test reduce the specimen section at numerous points. The strain at the point at which final necking down sets in will agree with the theoretical limit of homogeneous strain, but because of the effect mentioned, the elongation at regions away from the neck will be somewhat lower.
This analysis of necking in the simple tension test provides the basis for subsequent analyses of more complex loading methods. The critical rate of change of stress with strain at which instability occurs for each particular loading method is first determined and then imposed on the stress-strain curve in order to determine the limiting uniform strain.
Instability under Direct Tensile Loading in a Plane
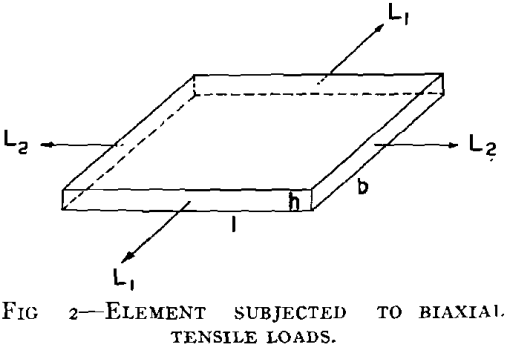
Consider an element of a body subjected to direct tensile forces as in Fig 2.
Assume that necking occurs in the direction of the greatest load. This load is given by

from the constancy of volume condition), we can write
![]()
or again making use of constancy of volume
![]()
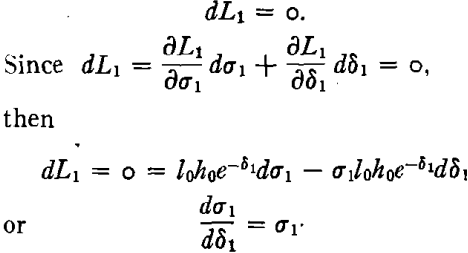
Instability will occur when L1 passes through a maximum, i.e. when
In considering combined stress problems it will be necessary to make use of a generalized stress strain relationship applicable to all states of stress. It is generally agreed that in the plastic range an in-
variant relationship exists between the following functions of stress and strain:
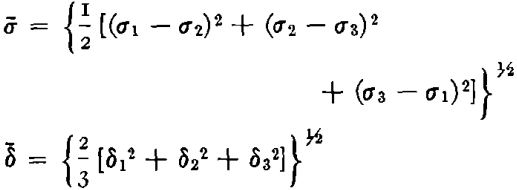
The σ-δ relationship, herein referred to as the “significant” stress-strain relationship, can usually be established most readily from the true stress-strain curve in simple tension. It can be seen that σ and δ reduce to σ1 and δ1 respectively for this state of stress, so that the σ-δ curve is equivalent to the ordinary true stress-strain curve. Since we have shown that the true stress-strain curve in simple tension can be represented in the form
![]()
it follows that the same relationship can be employed for the “significant” stress-strain curve, i.e.
![]()
For stales of biaxial tension (σ3 = 0), σ can be expressed as a function of σ1 and α, where α is the ratio of σ2 to σ1. Similarly by use of the following relationships between the principal normal stresses and strains, which are at least approximately valid for isotropic polycrystalline metals,
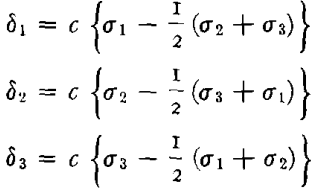
δ can be expressed as a function of δ1 and α. Low has carried out the analysis of this problem in this manner. Actually, however, it is not necessary to carry out the manipulations necessary to express σ as a function of σ1 and α and δ as a function of δ1 and α according to the above relationships, as long as it is recognized that some such functional relationships exist. Thus, we can write

where ∅1 and ∅2 are functions of α only. The expression
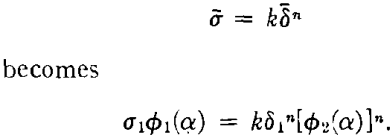
Combining the two functions of α into a third function, we have
![]()
We can now apply the necking criterion
dσ1/dδ1 = σ1
which for a constant stress ratio becomes
(∂σ1/∂δ1)α = σ1
Applying this condition to Eq 1 we find that
δ1 = n
This result predicts that for directly applied tensile loads in a plane, the limit of uniform extension in the direction of the greatest strain is a constant independent of the stress ratio and equal to the uniform extension in simple tension.
The limiting deformation in a forming operation involving stretching should therefore be approximately given by the uniform elongation in a simple tension test. There is very little data available to check this hypothesis although a few stretch forming tests carried out by Sachs, et al. seem to support it. In these tests, sheet metal blanks were stretched over a contoured form block so that biaxial tensile stresses were set up in the blank. A fair correlation was observed between the limiting strains in this test and the limits of uniform elongation in simple tension for the various metals tested.
Instability in Thin Walled Tubes Subjected to Combined Axial Loading and Internal Pressure
By subjecting a thin walled tube to the proper combination of axial force and internal pressure, it is possible to produce any desired state of stress in the biaxial tension field, ranging from pure longitudinal tension to pure circumferential tension. This technique has been employed in a large number of combined stress studies on metals, both to study stress-strain relationships in the plastic range and the effects of combined stresses on ductility. It is important that the effects of instability always be taken into account in the interpretation of the results of such tests.
In examining the experimental results of previous investigators, it appears that instability in tubes under combined axial loading and internal pressure can be manifested in one of two ways: either by a maximum in the total axial force or a maximum in the internal pressure, depending on the particular state of stress under consideration. In the following analysis the loading equations have been examined for the conditions leading to maxima in both of these quantities. Critical rates of strain hardening for both cases are derived in forms containing the ratio of the principal stresses as a parameter and are then examined for different values of this ratio. The greater of the two critical rates will be the controlling factor since it will be attained at a lower strain, i.e. if for a given state of stress, the critical rate of strain hardening for a pressure maximum is greater than that for a maximum in the total axial force, then a pressure maximum will occur, and conversely.
Consider a thin-walled tube loaded by a combination of internal pressure and axial load. The pressure, p, will be given by

where στ is the circumferential stress, h is the instantaneous wall thickness of the tube, and r is the instantaneous radius of the tube.
![]()
where δT and δL are the tangential and longitudinal strains respectively,
![]()
where h0 and r0 are the original wall thickness and tube radius respectively. Eq 2 becomes

Now suppose that
σT = ασL
where α ≥ 1 so that σT is the greatest principal stress. From the flow equations
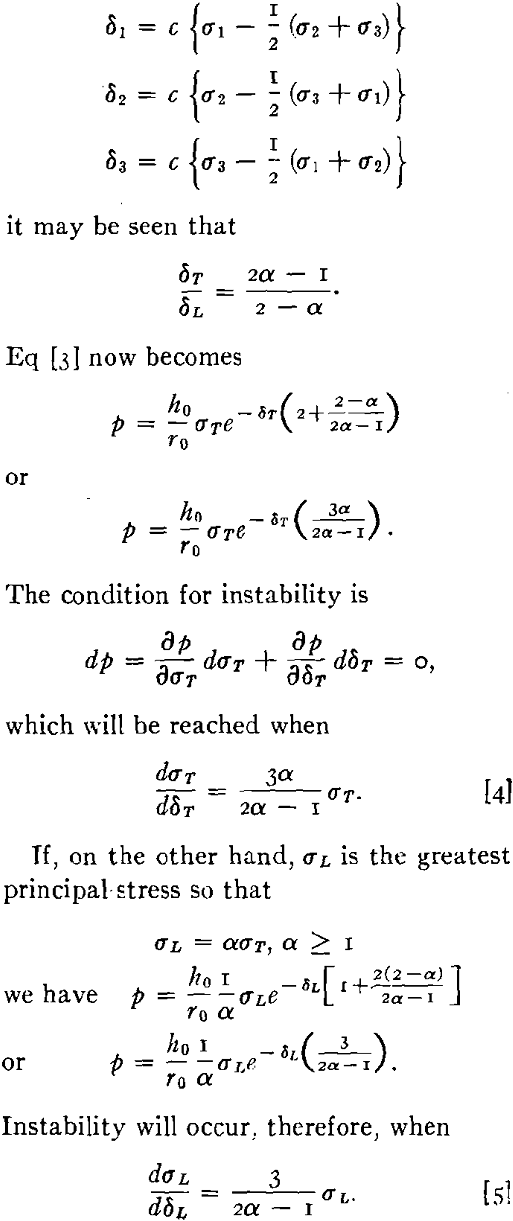
Now consider the conditions for a maximum in the total axial force. This quantity is given by
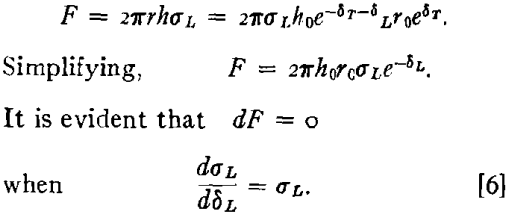
Since the total axial force is composed of two components, one from the external load and one from the internal pressure, a maximum in this quantity will probably

be manifested both as a load maximum and a pressure maximum. This pressure maximum is to be distinguished from a primary pressure maximum which arises directly from application of instability conditions to the pressure-strain relationship. It is interesting to compare Eq 6 with the criterion for a maximum in the externally applied load.
The stress in the axial direction is given by
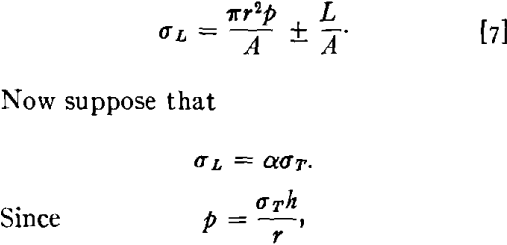
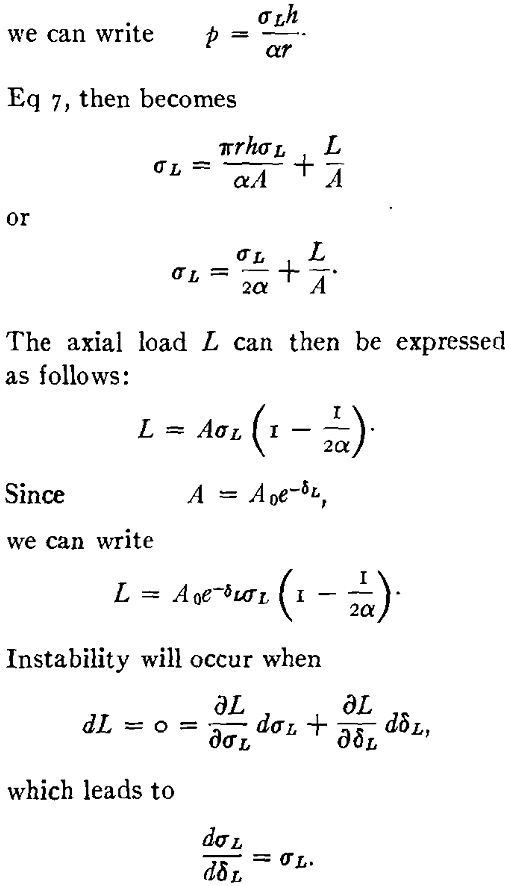
This result is identical to that obtained for a total axial force maximum.
In Fig 3 the critical slopes of the stress-strain curve at which the various types of instability occur have been plotted as a function of the two stress ratios. σL/σT and σT/σL. Pure tension in the axial direction occurs at σL/σT = ∞, and, similarly, pure circumferential tension occurs at σT/σL = ∞. The uppermost points, lying on the heavily inked curve, represent the controlling slopes. It is to be noted that instability in pure circumferential tension occurs at a greater slope and, therefore, a lower elongation than simple tension in the axial direction. This fact has not been fully appreciated in the past.
The value of δ1 at the onset of unstable flow for a given material will be inversely proportional to the slopes plotted in Fig 3. This can be demonstrated by applying the instability criterion equation for a pressure maximum to the significant stress-strain curve.
It will be recalled that if
σL/σT = α,
the generalized stress-strain relationship
![]()
can be expressed for biaxial stress as
![]()
Since for σL/σT = α ≥ 1 the instability criterion is given by
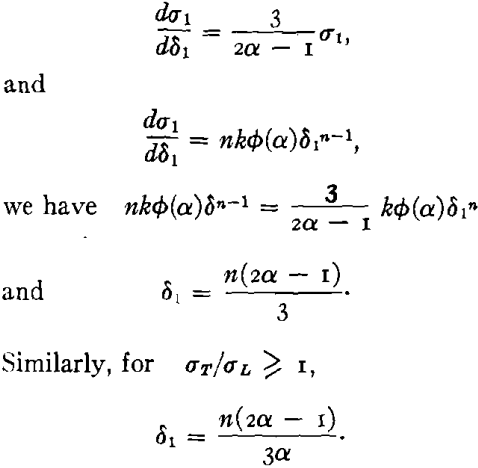
A plot of δ1 values at the limit of uniform flow for various stress ratios would therefore have the form of Fig 3 inverted.
This analysis has been applied to the experimental results of Maier on steel tubes. The steel to be considered is a medium carbon (0.37 C) annealed steel which was shown to have a strain-hardening exponent of 0.25 in Fig 1. Good agreement between observed and predicted results is apparent from Table 2. Much better agreement is obtained in a comparison of the theoretical values in Table 2 with the experimental results of Griffis and Morikawa on a similar material. Their results are also shown in Table 2.
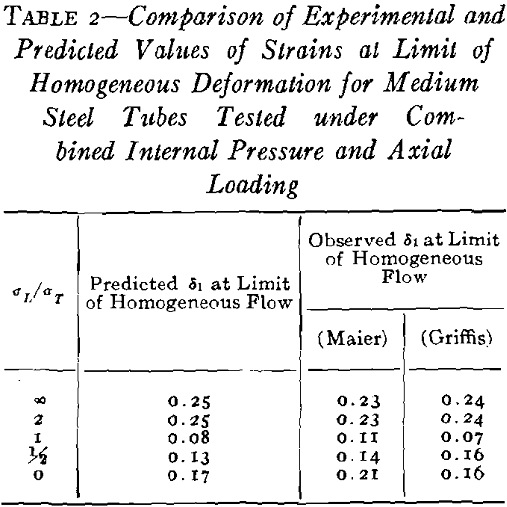
It is interesting to note the form of the region undergoing unstable flow for different ratios of the principal stresses. For pure tension in the axial direction, a circumferential neck is formed as would be expected when the total axial force passes through a maximum. For pure circumferential tension, on the other hand, where a pressure maximum occurs, a one-sided bulge, or “blister,” is formed in which unstable flow occurs over a considerable area of the specimen. A longitudinal crack is then formed at rupture. The change from one mode of failure to the other according to Fig 3 should occur at σL/σT = 2. Actually, differences in longitudinal and circumferential stress-strain curves, i.e. anisotropy introduced in fabrication, can shift this point to other stress ratios. It is generally observed, however, that below a σL/σT ratio of two a local bulging occurs followed by a crack in the axial direction.
Instability in the Circular Hydraulic Bulge Test
It is well known that a thin sheet clamped over a circular opening and loaded by a uniformly applied fluid pressure is deformed into a surface which closely approximates a spherical segment. As loading proceeds, the volume of the segment increases and the radius of curvature decreases. Straining is not uniform over the entire specimen, but varies from a maximum at the crown of
the bulge to zero at the clamping edge. If the ratio of diaphragm diameter to thickness is sufficiently great, stresses can be calculated from simple membrane theory. In the following analysis it will be assumed that membrane conditions prevail, i.e. that edge effects do not extend an appreciable distance into the bulge. This assumption is supported by contour measurements on bulges of 0.040 in. thick Alclad 24S-O sheet which indicate that the deformed surface is spherical except in the immediate vicinity of the clamped edges. It is further assumed that the strain gradient from the crown to the base of the bulge is sufficiently small so as to have no effect. Comparison of results from circular bulge tests conducted in this investigation using 9 in. and 12 in. diam openings with results reported by Sachs of tests using a 6 in. diam opening indicate that below a certain diaphragm diameter at a given thickness a size effect exists. Average limiting uniform elongations at the poles of 9 in. and 12 in. bulges agree almost exactly, while corresponding strains in the 6 in. bulge test are consistently a few per cent higher. Whether this size effect results from a difference in strain gradients or lack of conformity to membrane conditions in the small bulges is uncertain. It is apparent that differences in strain gradients must exist between bulges formed over different size openings, since the maximum strain at the crown of geometrically similar bulges will be about the same. For purpose of analysis, however, it will be assumed that mem-
brane theory is applicable and that any effects of strain gradients are absent.
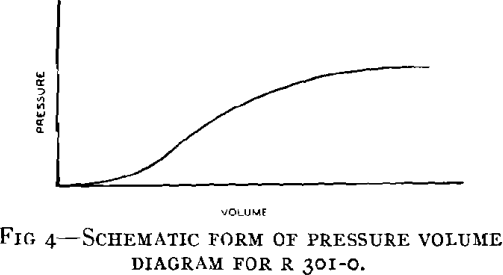
The condition for instability in the circular bulge test is that deformation proceeds with no increase in pressure, i.e. that dp = 0. It was observed in bulge testing the aluminum alloys 24S-O, 75S-O, and R301-0, that the pressure remained substantially constant during the last stage of the tests, suggesting the possibility of the occurrence of instability. The general form of the pressure-volume diagram of these materials is shown in Fig 4.
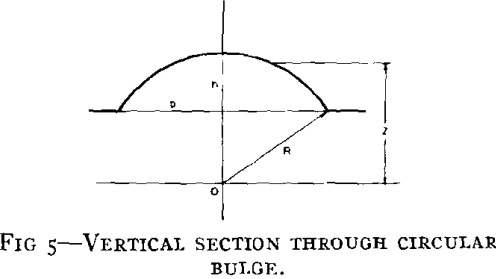
Fig 5 shows a vertical section through the pole of a circular bulge at a particular stage in loading. The radius of the sphere of which the bulge is a segment is represented by R, h is the height of the bulge, 2 is the perpendicular distance of any point on the bulge from a horizontal plane through the center of the sphere, and b is the radius of the circular opening over which the bulge is being blown.
It is known that for a spherical membrane subjected to a uniformly applied hydraulic pressure
N = ½pR………………………………………..[8]
where N is the tension per unit length, p is the pressure, and R the radius of the sphere. Or

where σ is the stress and t is the instantaneous thickness of the shell.
δ1 and δ2 are the principal strains in the plane of the sheet. For the sphere
δ1 = δ2 = δ,
and from the constancy of volume condition,
δ1 + δ2 + δ3 = 0,
we find δ3 = —2δ
![]()
where t0 is the original thickness.
It may readily be established from the geometry of the circular bulge that
R = b² + h²/2h
Substituting this expression for R, as well as Eq 10 into Eq 9 leads to

Saibel has developed an analysis for the strain distribution in the circular bulge in which it is shown that the strain at any point on the bulge is given by

where z is the height of any point on the bulge above a datum plane through the center of the sphere of which the bulge is a portion. Thus, p as given by Eq 11 may be considered as a function of δ and σ since h may be expressed in terms of δ from Eq 12. When this substitution is made, z enters as a parameter which may be held fixed while the necessary condition for p to be an extremum is applied. That is,

is the necessary condition that p be an extremum. Or
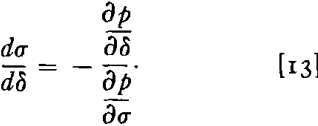
Now Eq 13 will contain z as a parameter and may be examined for the critical value of z at which instability sets in.
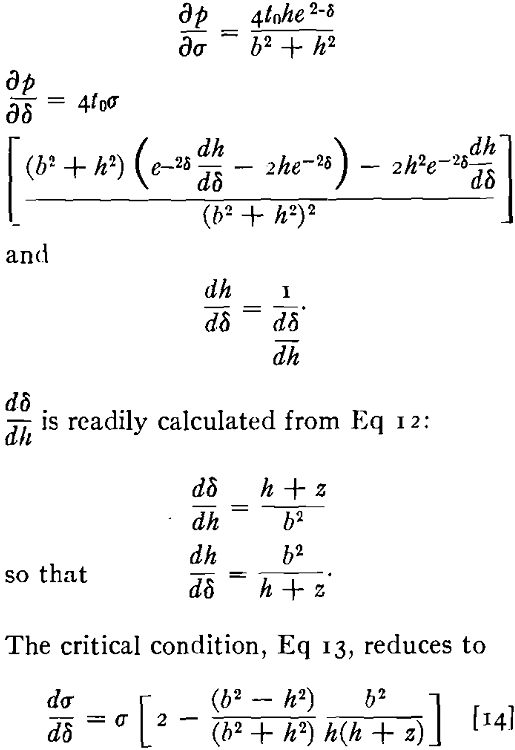
It may now be observed that the condition expressed by Eq 14 is first reached when z has its largest value, that is, at the pole of the bulge, where the greatest strain occurs. This may be seen more readily if the σ1-δ curve is approximated by
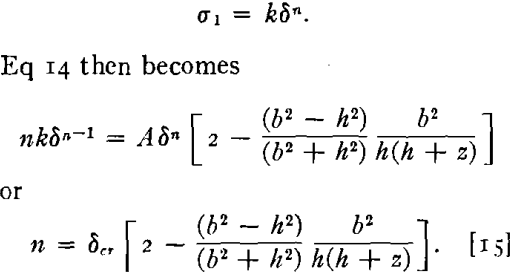
The value of z which first brings about a critical δ is the largest it can have, namely z = R. If, then, in Eq 15 we set
z = R
and substitute

since it is shown in Saibel’s analysis of the strain distribution in the circular bulge that the strain at the crown is given approximately by h²/b² and it is at the crown, z = R, where the critical strain occurs, we obtain

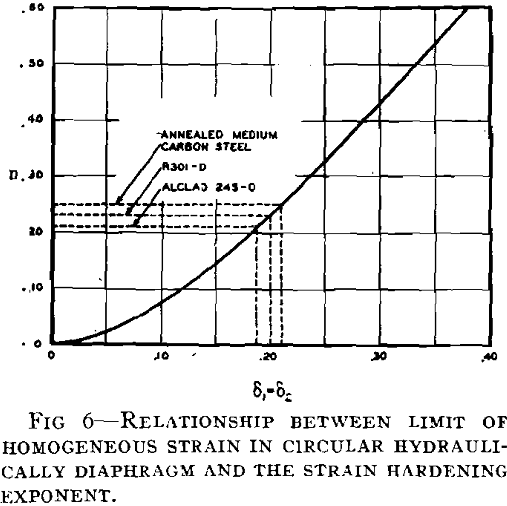
from which the limit of homogeneous strain may be calculated when the exponent of δ in the generalized stress-strain relationship
![]()
is known. Fig 6 is a plot of n versus δ at the limit of homogeneous deformation according to Eq 16. As can be seen from Table 3, excellent agreement is obtained between predicted and observed values for medium carbon steel and 24S-O since apparently these materials neck down so that measurements of strains on fractured bulges represent the limiting uniform
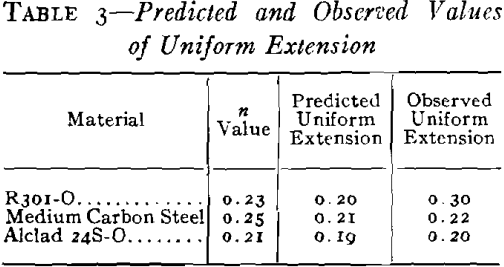
elongation just before instability occurred. For R301-O, however, the measured value is somewhat too high indicating that, if the analysis is correct, unstable flow has occurred uniformly over the dome of the bulge, tending to form a secondary bulge. Therefore, the measured strains on a fractured specimen of this material do not represent the strains at the beginning of unstable flow.
Interesting qualitative conclusions can be drawn from Fig 6 for materials with high yield strength-tensile strength ratios such as 24S-T81 and 24S-T86. These materials have low n values of the order of 0.05, and corresponding uniform elongations of S pct in direct tension. In the circular bulge test these materials do not deform into spheres because of rather high bending stresses at the clamping edge which produce lower curvatures near the clamps than would be required for a spherical shape. The solution shown in Fig 6, although based on a spherical bulge, does indicate that these materials would be capable of much greater extensions in the bulge tests than in simple tension, which is in conformity with observed results.
The question arises as to what configuration the system assumes under unstable flow. Does a local necking similar to that observed in the ordinary tension test occur, or does unstable flow occur over a rather large area near the crown of the bulge, resulting in a uniform thinning and a tendency for the formation of a secondary bulge? Two apparently different modes of fracture were observed among the annealed materials. In the first, typical of 24S-O, a straight crack is opened in the longitudinal direction. Materials such as R301-O, which exhibit the second type of fracture, fail with a semi-circular crack near the crown of the bulge in such a way that a flap is lifted. Examination of fracture cross sections indicates that in the first type, the straight crack, a local necking has occurred, since a very pronounced reduction in thickness is observed at the point of fracture. In the second case, the local reduction is not as marked and the plane of the fracture surface is at about 45° to the plane of the sheet. It seems likely that unstable flow has occurred over a large area of the dome of the bulge leading to very high uniform elongations. This is more evident in some tests on deep drawing automobile sheet where the ductility is sufficiently high that the bulge actually becomes a portion of an oblate spheroid. In those cases where necking is observed, the behavior is similar to that of a very long tensile specimen. The region affected by necking is very small and the elastic potential energy of the remainder of the specimen is so great that fracture occurs very rapidly and with no visible decrease in pressure associated with necking down.
Summary and Conclusions
The conditions leading to unstable plastic flow have been analyzed for several methods of loading and the critical rates of strain hardening at which instability will occur have been derived. The loading methods considered are: direct tensile loads in a plane, combined internal pressure and axial loading of thin walled tubes, and hydraulic bulging of a circular diaphragm. Completely analytical solutions for the limits of homogeneous strain for these loading methods have been arrived at through the use of the power relationship between significant stress and significant strain:
![]()
Hitherto, graphical solutions have been necessary. The theoretical solutions for uniform strains show excellent agreement with experimentally observed values.
The most important conclusion to be drawn from the solutions developed is that the limit of homogeneous deformation does not depend merely upon the state of stress, but is very strongly dependent upon the method and geometry of loading used to produce a given state of stress. For example, if a state of balanced biaxial tension is produced in a thin walled tube under axial load and internal pressure, the uniform strain can be expected to be less than one half the value to be expected in a circular, hydraulically deformed diaphragm. This fact has not been properly appreciated in the past and is to be strongly emphasized.

