Table of Contents
The known domestic reserves of potash feldspar of the quality needed for dinnerware and sanitaryware, as well as for electrical and other industrial porcelain products, are not likely to meet anticipated demand during the rest of the century. However, molybdenite tailings and the prospective tailings from currently undeveloped ore bodies are mineral wastes that have the potential to yield other useful minerals, and potash feldspar is among these minerals. Through laboratory studies at its Tuscaloosa Research Center, the Bureau has investigated the feasibility of recovering potash feldspar and glass sands from molybdenite tailings. This research was done to help achieve the Bureau’s goal of developing new or improved technology to aid in maintaining an adequate supply of minerals for national economic and strategic needs and to promote maximum mineral recovery from domestic sources.
The Bureau has extensive experience in recovering potash feldspar and glass sands from a wide variety of sources. This experience has shown that acceptable grades of feldspar and quartz can be recovered from granites from Missouri and Minnesota and from waste granite fines from South Carolina and Georgia. The Bureau has also investigated methods for recovering high-grade potash feldspar from mica waste tailings near Kings Mountain, N.C.
In the study described in this report, the Bureau investigated the recovery of a potash feldspar concentrate and a glass sand concentrate from the tailings of three operating molybdenite mills and a molybdenite ore body. Several methods used to separate the feldspar from the quartz and to remove certain undesirable minerals (fluorite and topaz, iron minerals, and metal sulfides).
Two methods were successful for removing the bulk fluorine (fluorite and topaz) and metal sulfides prior to the separation of the quartz and feldspar products by feldspar flotation. These methods are described below:
- The first method was to condition the pulp in a neutral circuit, with citric acid used to depress the silicate minerals. The pH was then increased with Na2CO3 and a fatty acid was used to collect the fluorine and metal sulfide minerals.
- The second method was to condition the pulp in an acid circuit at a pH ranging from 2 to 4, with H2SO4 used to lower the pH and to depress the silicate minerals. The fluorine, sulfide, and iron minerals were then floated with petroleum sulfonate.
The HF-amine method previously developed by the Bureau was also used to float the feldspar, sulfide, and iron minerals. After neutralization with NaOH, the sulfide and iron minerals were removed with dixanthogen.
Description of Samples
The four samples used in this study were taken from three operating molybdenite mills and a molybdenite ore body. Sample COA was from an ore body under development in Colorado and was randomly selected from diamond-drill core splits. A mine is now active at the site of this ore body, and it is expected that about 30,000 tons/day of ore will be produced there in the near future. The major mineral constituents of sample COA, in order of decreasing grain frequency, were quartz, feldspar, mica (sericite), topaz, pyrite, and molybdenite. Small quantities of biotite, zircon, rutile, monazite, and spinel were also detected. A screen analysis and partial chemical analysis of the sample are shown in tables 1 and 2, respectively.
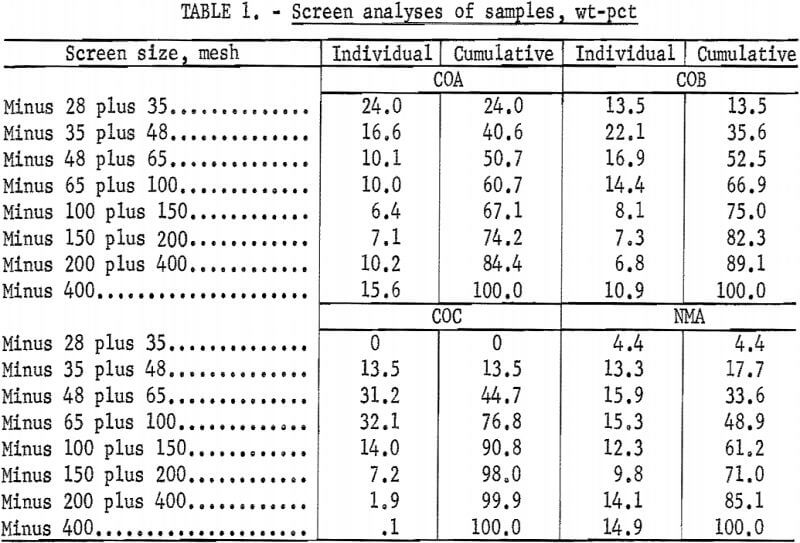
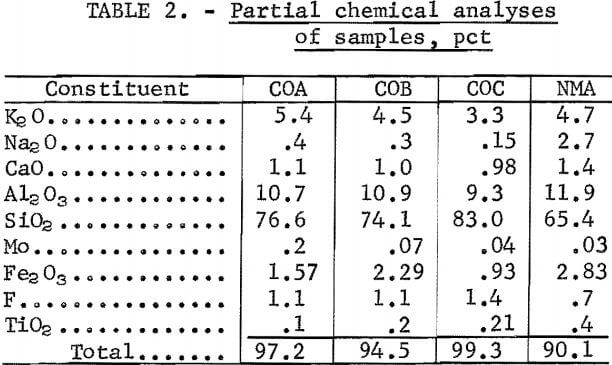
Sample COB consisted of final tailings from an inactive flotation operation in Colorado that had, when it was in operation, a mill capacity of about 7,000 tons/day. The major mineral constituents of this sample, in order of decreasing frequency, were feldspar, saussurite, quartz, muscovite, topaz and fluorspar. Minor quantities of molybdenite, sphene, rutile, ilmenite, biotite, chlorite, pyrite, zircon, monazite, and spinel were also present. Feldspars were predominantly orthoclase, but both sodium and calcium plagioclases were also present. Sample COB contained 27.7 pct saussurite, which is a major alteration product of feldspar that is always associated with finely grained material. A screen analysis and partial chemical analysis of sample COB are shown in tables 1 and 2, respectively.
Sample COC consisted of rougher table tailings from a byproduct section that processes tailings from a Colorado molybdenite flotation operation. This operation currently produces about 1,000 tons/day of table tailings. Petrographic analysis of sized fractions indicated that about 50 pct of the feldspar and quartz particles were locked in the minus 35- plus 48-mesh fraction and that about 20 pct of these particles were locked in the minus 270- plus 400-mesh fraction. The sample contained about 11.0 pct mica, which was mostly sericite with some muscovite and biotite. A screen analysis and partial chemical analysis of sample COC are shown in tables 1 and 2, respectively.
Sample NMA was a waste tailings from a New Mexico molybdenite flotation plant with a capacity of about 15 ,000 tons/day. Petrographic examination indicated that although the quartz and feldspar showed very little locking, each was locked with a dark mineral such as muscovite, biotite, fluorspar, pyrite, or molybdenite. Tentatively identified in the smaller grains of this sample were small amounts of pyrite, covellite, bornite, biotite, molybdenite, hornblende, and ilmenite. A screen analysis and partial chemical analysis of this sample are shown in tables 1 and 2, respectively.
Laboratory Batch Flotation Tests
The Citric Acid-Sodium Carbonate-Fatty Acid Method
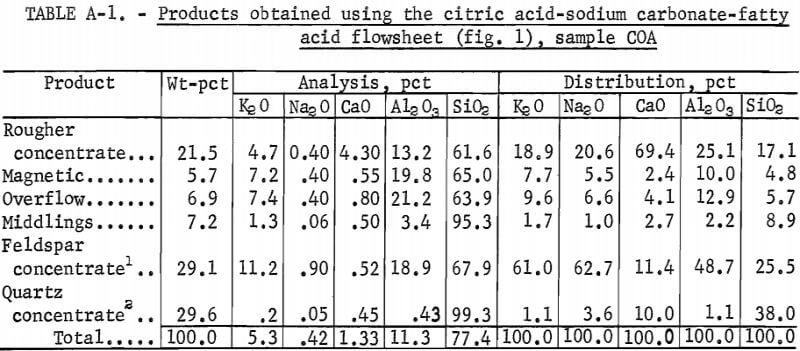
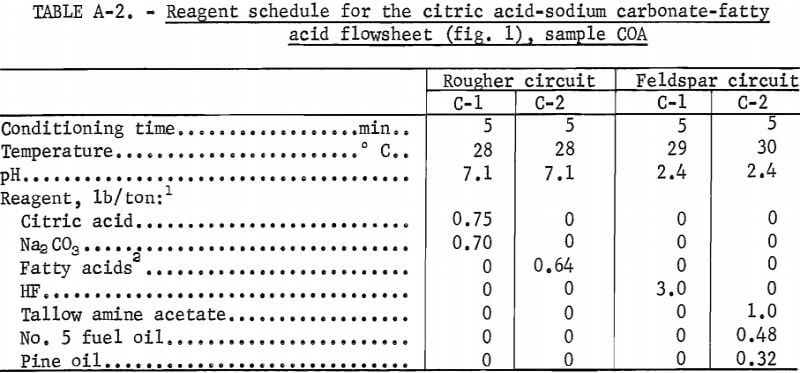
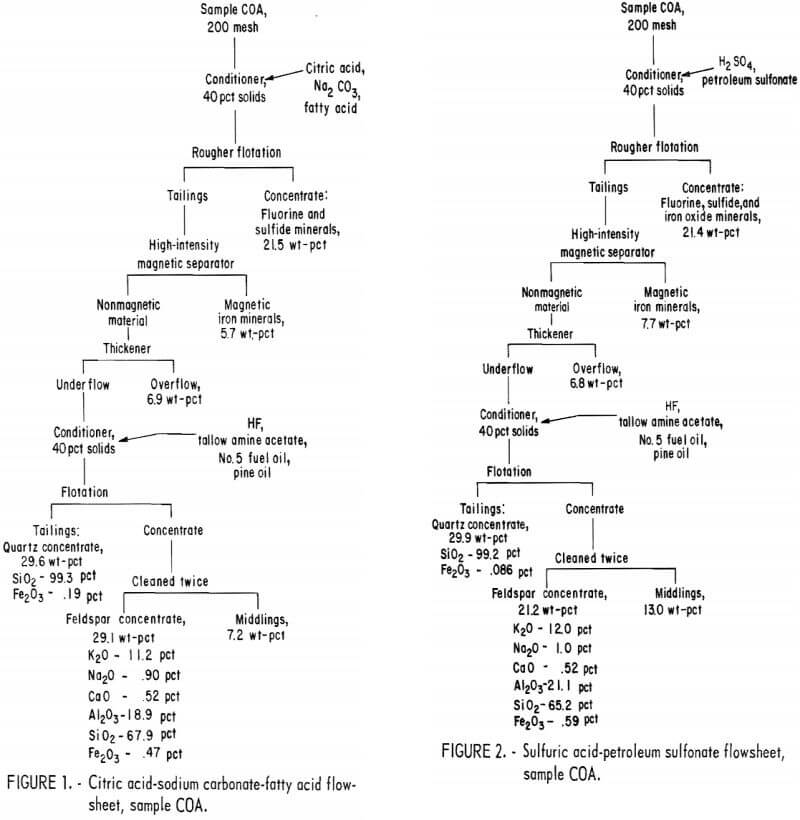
Drill cores of sample COA were crushed to minus 10 mesh and stage ground in a rod mill to minus 200 mesh. The citric acid-Na2CO3-fatty acid flowsheet is shown in figure 1. The product analyses and distributions for this method are shown in appendix table A-1, and the reagent schedule is shown in table A-2. The iron content of the feldspar and quartz concentrates was 0.47 pct and 0.19 pct, respectively. These figures exceed the amounts allowed by the specifications for each of these products.
The Sulfuric Acid-Petroleum Sulfonate Method
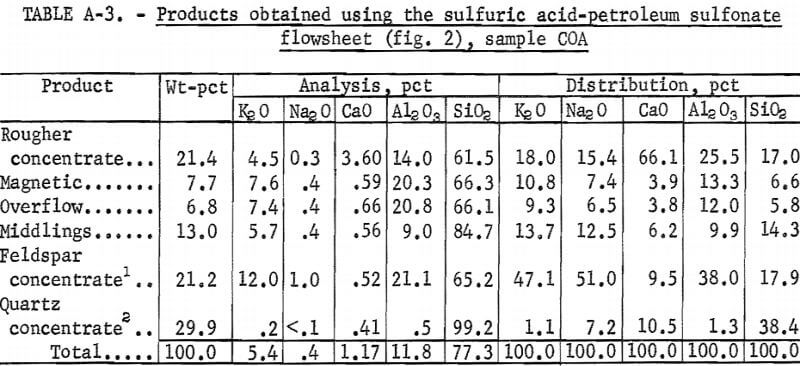
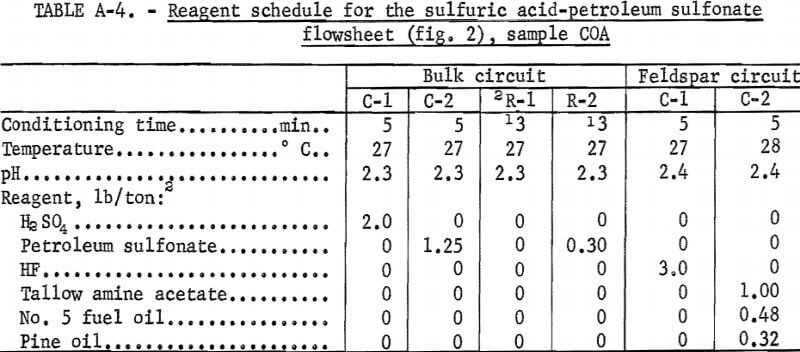
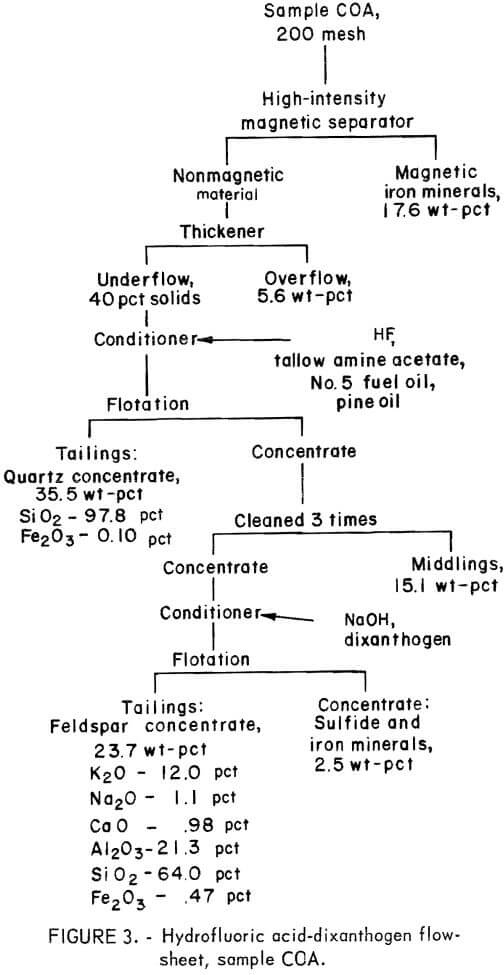
Drill cores of sample COA were crushed and ground to minus 200 mesh as described above. The H2SO4 -petroleum sulfonate flowsheet is shown in figure 2. A summary of the results and the reagent schedule used are shown in tables A-3 and A-4, About the same quantity of quartz concentrate was obtained as in the citric acid-Na2CO3-fatty acid test illustrated in figure 1, but the iron content was somewhat lower, at 0.086 pct. A somewhat smaller quantity of feldspar concentrate was obtained with this method.
The Hydrofluoric Acid-Dixanthogen Method
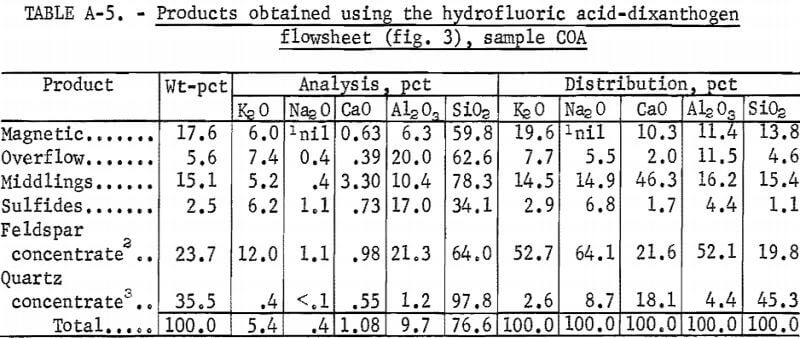
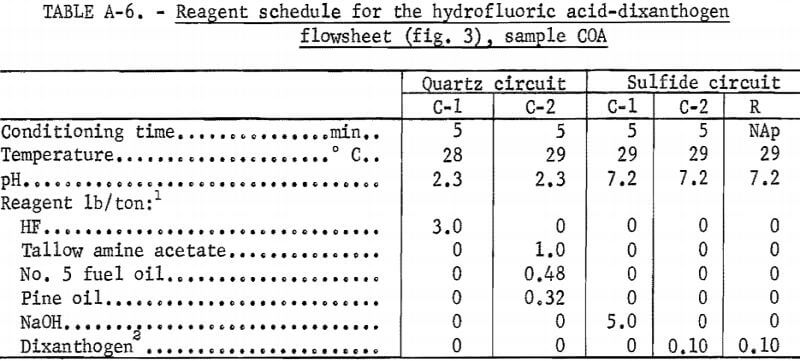
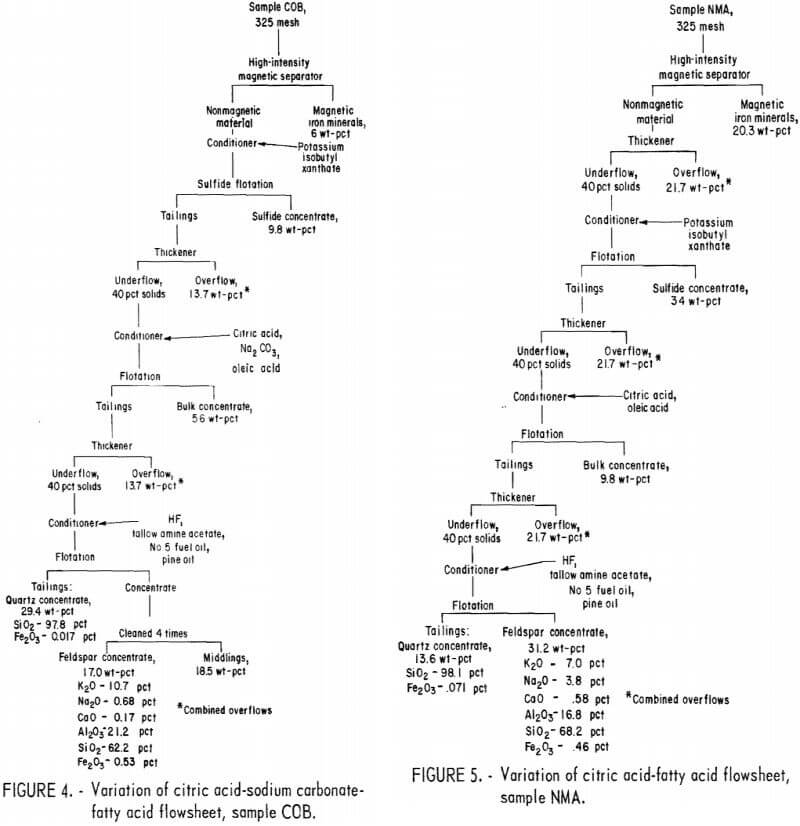
Drill cores of sample COA were crushed and ground to minus 200 mesh in the same way as in the previous two tests. The flowsheet for the HF-dixanthogen method is shown in figure 3. The product analysis and distribution and the reagent schedule for this method are shown in tables A-5 and A-6. The iron content of the glass sand and potash feldspar concentrates was again too high for most specifications.
All three methods produced similar glass sand and feldspar concentrates. Of the three, it is expected that the HF-dixanthogen method would be the least expensive because of lower reagent costs and its simpler flowsheet.
Variation of the Citric Acid-Sodium Carbonate- Fatty Acid Flowsheet
Sample COB
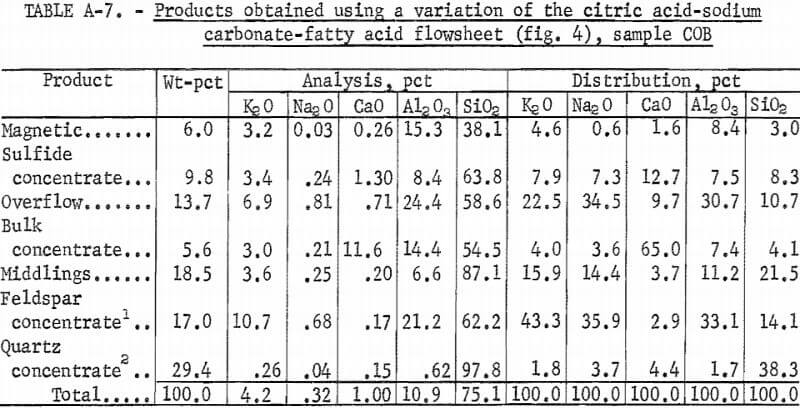
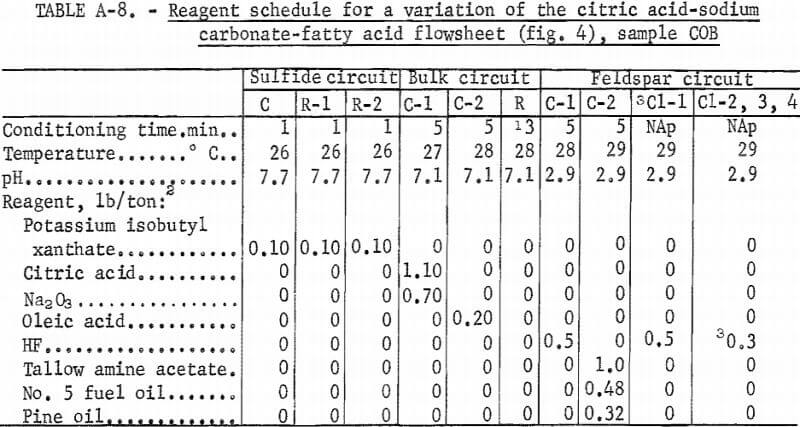
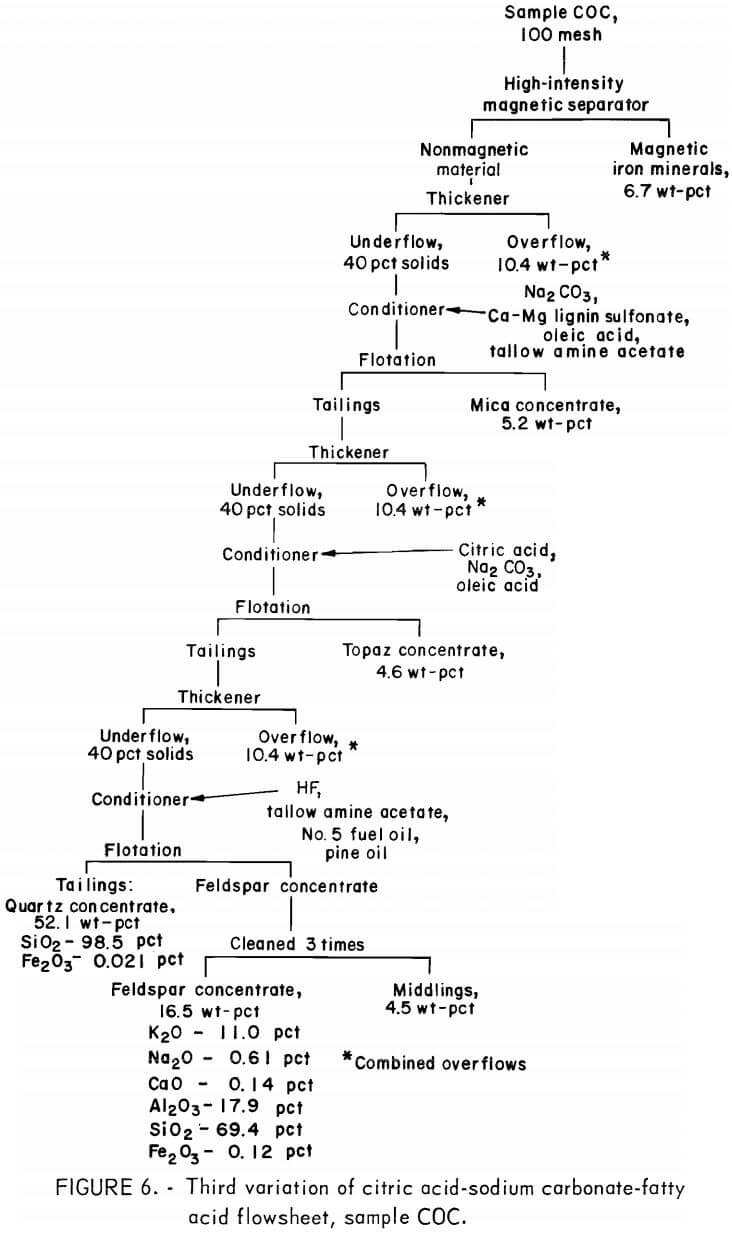
Producing feldspar and quartz concentrates from sample COB was difficult. Variations were made in the citric acid-Na2 CO3-fatty acid method as shown in figure 4. The resultant quartz concentrate was of high quality; it contained 97.8 pct SiO2 and only 0.017 pct Fe2O3. The feldspar concentrate contained 0.53 pct Fe2O3. A summary of the results and the reagent schedule for this variant method are shown in tables A-7 and A-8.
A second variation of this flowsheet was used for sample COB. The sulfides, mica, and feldspar were floated in turn and produced a potash feldspar containing the following, in percent: 9.9 K2O, 0.73 Na2O, 0.97 CaO, 24.6 Al2O3 , and 61.0 SiO2.
Sample NMA
Petrographic analysis of sample NMA showed that dark minerals were locked with feldspar and quartz grains. A potash feldspar concentrate
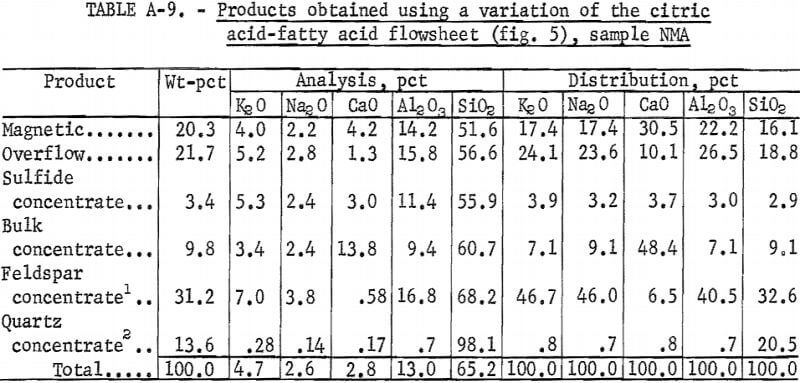
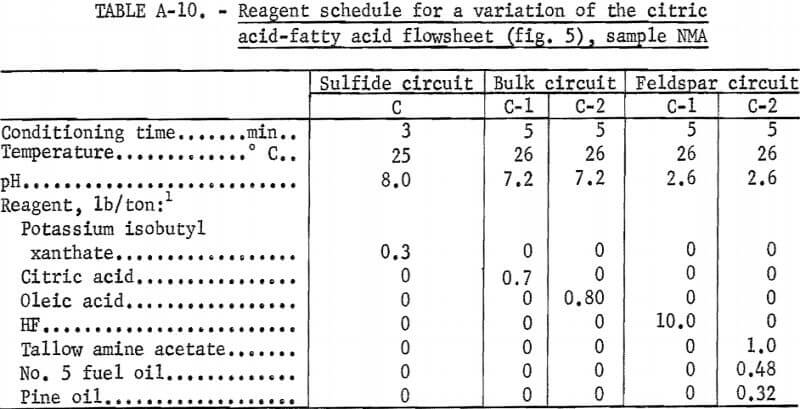
that contained 10 pct K2O (a minimum grade of potash feldspar), could not be produced. However, a marketable grade of mixed feldspar or feldspathic sand was produced using the flowsheet shown in figure 5. A summary of these results and the reagent schedule used are shown in tables A-9 and A-10.
Sample COC
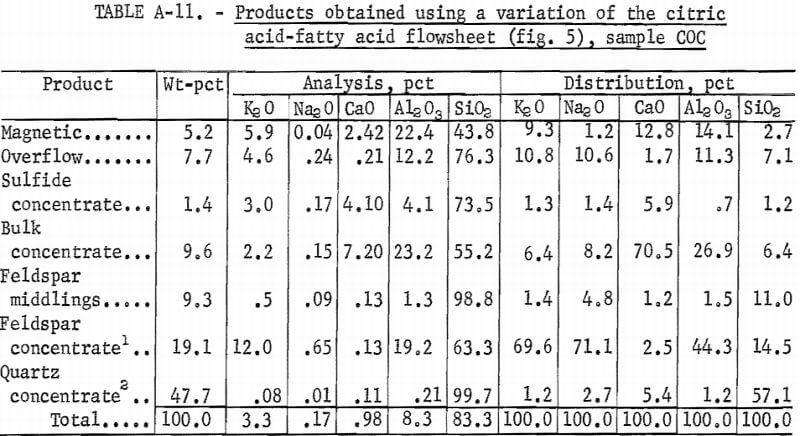
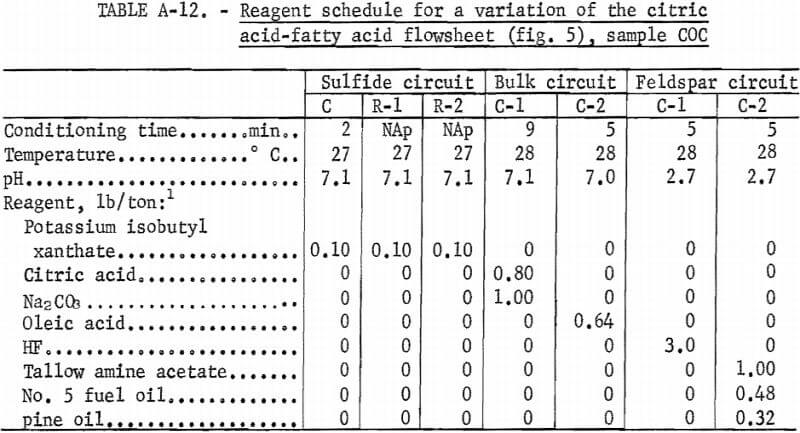
A representative portion of sample COC was treated using the same flowsheet as is shown in figure 5, except that Na2CO3 was used in the bulk flotation, and the feldspar concentrate was cleaned three times. The feldspar concentrate recovered 19.1 pct of the feed weight and was analyzed, in percent, as 12.0 K2O, 0.65 Na2O, 0.13 CaO, 19.2 Al2O3, 63.3 SiO2 , and 0.70 Fe2O3. The quartz concentrate recovered 47.7 pct of the feed weight and was analyzed as 99.7 pct SiO2 and 0.04 pct Fe2O3. A summary of these results and the reagent schedule are shown in tables A-11 and A-12.
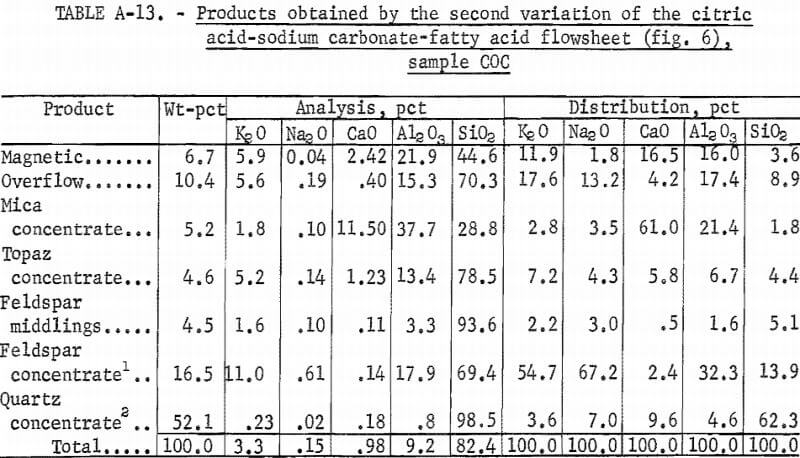
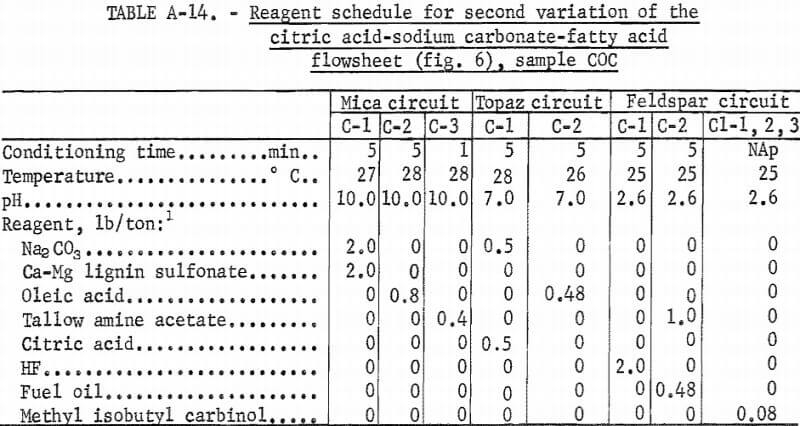
The third variation of the citric acid -Na2CO3-fatty acid flowsheet is shown in figure 6. A summary of results and the reagent schedule are shown in tables A-13 and A-14. Over 95 pct of the Fe2O3 was removed by this process. The potash feldspar concentrate met the specification for electrical insulators, except that the soda content was below the 2.0 pct minimum. This deficiency could be remedied by blending the feldspar concentrate with soda feldspar, which is more abundant and cheaper than potash feldspar. The quartz concentrate produced was a high-quality glass sand.
Microprobe Studies
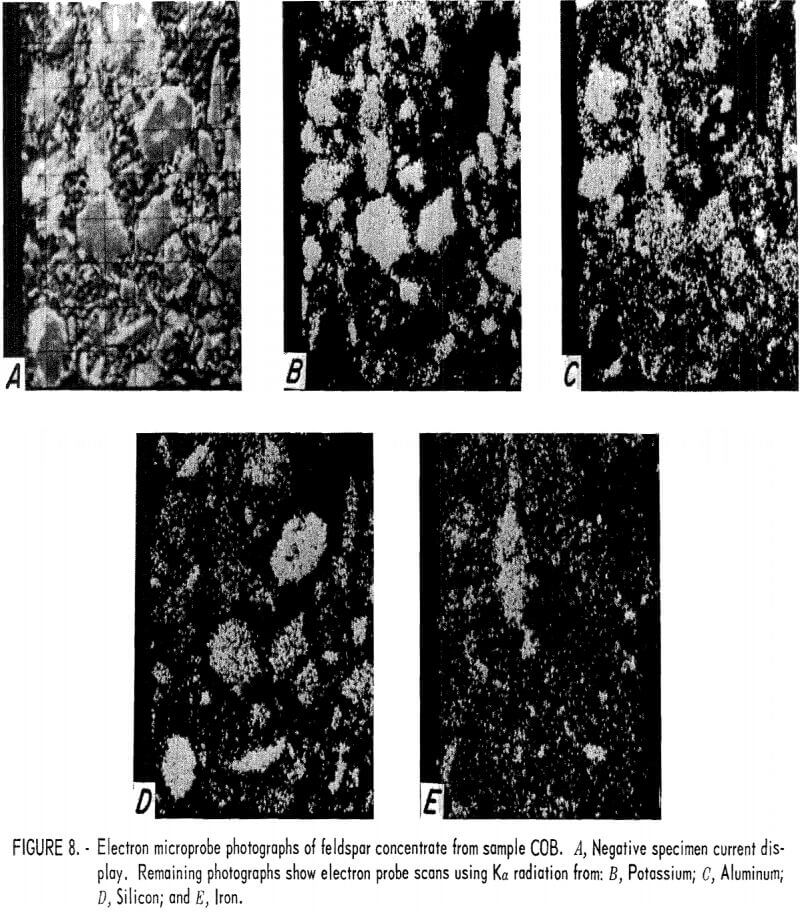
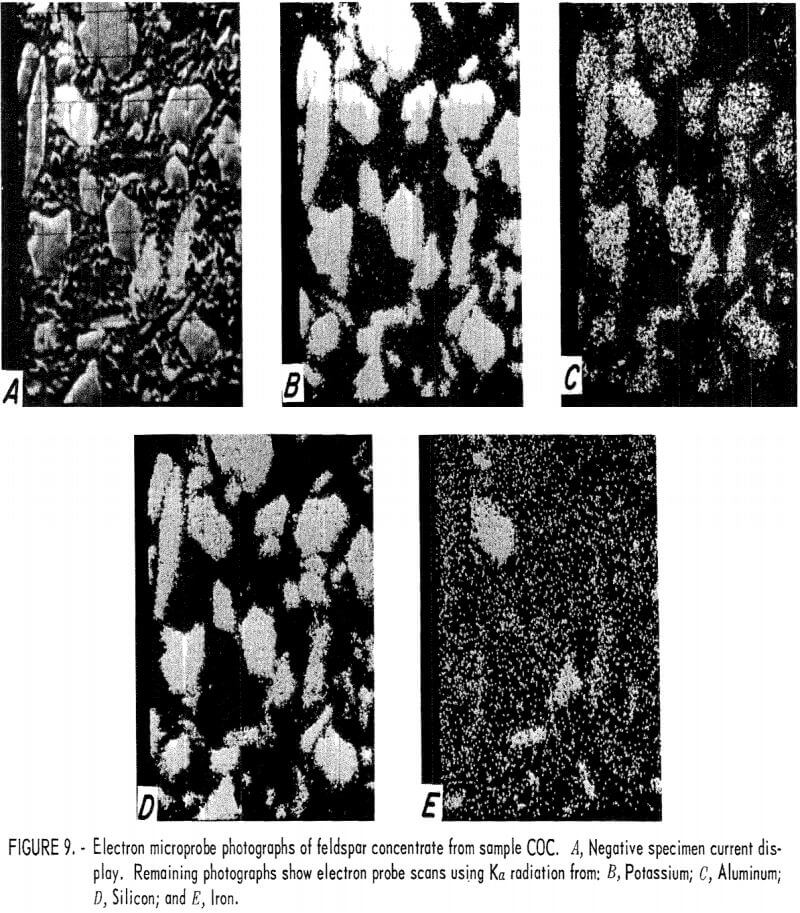
One feldspar concentrate from each of the four tailings was examined using an electron microprobe. Electron probe photographs for samples COA, COB, COC, and NMA are shown in figures 7, 8, 9, and 10, respectively. The first photograph in each set labeled (A) is the image created by the negative specimen current. The negative display was chosen so that plastic mounting materials and holes in mineral grains appear dark and the photo resembles an optical micrograph. The remaining photographs show electron microprobe scans that used Ka radiation from potassium, aluminum, silicon, and iron. Because these displays are positives, their bright, or light, areas indicate concentrations of the radiating element. Very bright grains with dark backgrounds indicate a high concentration of the element. Random dots spread uniformly across the photograph usually indicate that very little or none of the element was present and that the electron probe sensitivity was set at a high level in order to show trace amounts of the element. These X-ray scans can be used for comparative analysis of grains in the same photograph, but comparison between photographs should not be made because the sensitivity can shift spontaneously between photographs or it may have been intentionally changed to improve contrast.
The electron microprobe photographs all show the presence of two types of feldspar, one of which was an iron-bearing feldspar. The COA concentrate (fig. 7) showed free grains of the iron-bearing feldspar and an inclusion of the iron-bearing feldspar in the silica particle at the center of the photograph. (The free grains of the iron-bearing feldspar and the inclusion are visible in each of the displays shown in figure 7; the free silica appears only in displays A and D.)
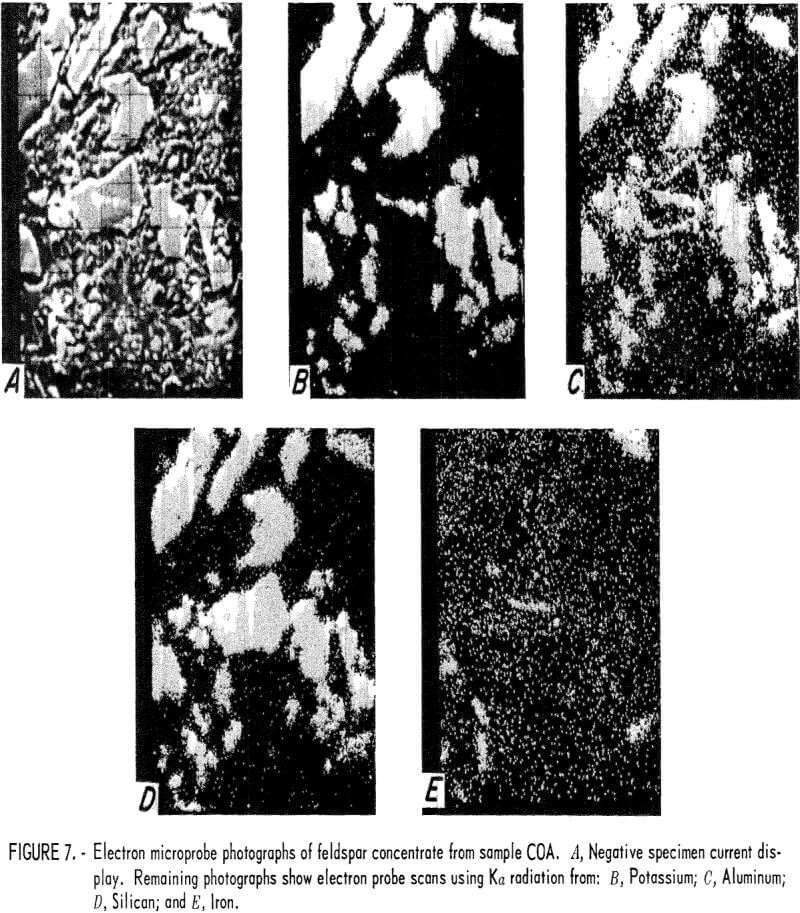
Semiquantitative analyses of the iron-free feldspar yielded aluminum and silicon values that were very close to the nominal values for KAlSi3O8 (potassium aluminosilicate). Semiquantitative analyses of the iron-bearing feldspar showed that it contained from 2 pct to 3 pct iron, 10 pct to 20 pct aluminum, and 13 pct to 20 pct silicon.
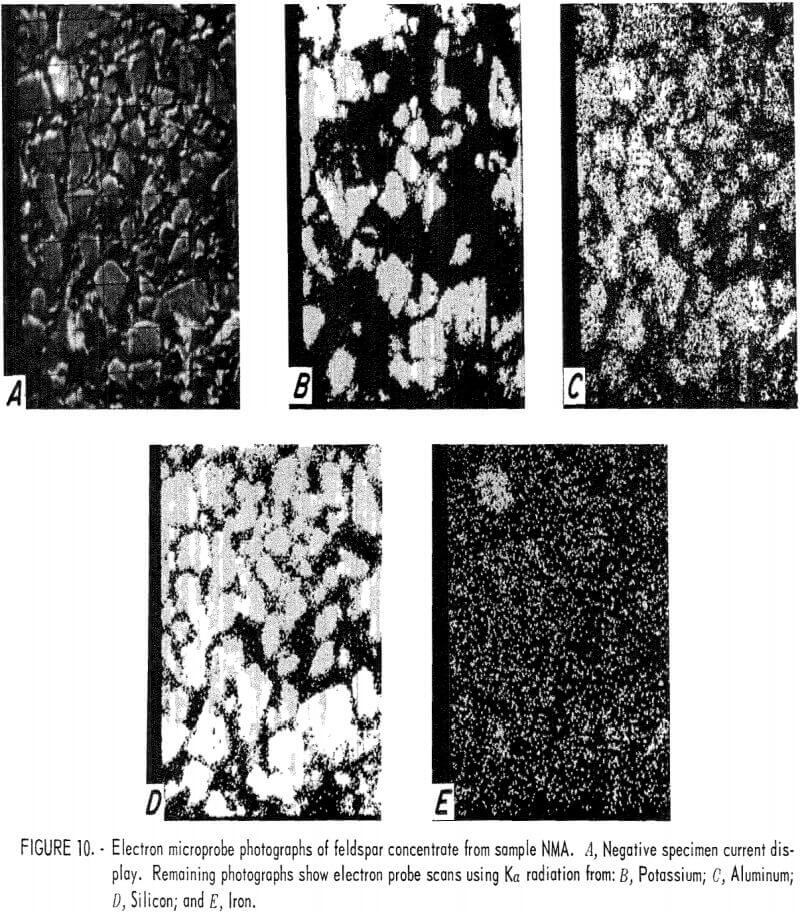
The presence of the iron-bearing feldspar accounted for the difficulty encountered in lowering the iron content of the feldspar concentrates. Magnetic separation or acid leaching may be sufficient to remove iron particles or surface stains, but the iron-bearing feldspar is unaffected and reports into the concentrate. The COB feldspar concentrate (fig. 8) was similar to the COA concentrate except that it appeared to contain a greater amount of the iron-bearing feldspar. The COC feldspar concentrate (fig. 9) was essentially the same as was produced from samples COA and COB. In the NMA concentrate (fig. 10), there were a few small particles of the iron-bearing feldspar. These particles were too small for a meaningful analysis, but their composition was probably similar to that of the other samples.
Conclusions
The combined flotation and magnetic separation methods described in this report produced feldspar concentrates with iron contents that were too high to satisfy most use specifications, but the quartz concentrates recovered by these methods were high-quality glass sands.
Feldspar concentrates containing from 10.7 pct to 12.0 pct K2O were recovered from three of the four samples. The alkali content of the fourth sample met the grade for a mixed feldspar. All of the feldspar concentrates contained more than the 0.10-pct-Fe2O3 specification for most uses. Sufficient quantities of an iron-bearing potash feldspar were detected in each of the feldspar concentrates to preclude them from meeting the iron specification—unless the iron-bearing feldspar can be physically separated.
All four tailings produced quartz concentrates that were high-quality glass sands. The quartz concentrates varied from 97.8 pct to 99.7 pct SiO2 and from 0.017 pct to 0.19 pct Fe2O3.
