Table of Contents
The pressure filtration of flocculated suspension was described as a compressional theology model far evaluation of filtration data. Others divided the filtration process into two stages as compact formation (stage 1) and compact consolidation (stage 2) stages. They developed a conventional engineering approach for analysis of stage 2. In this study, conventional filtration theory was used for analysis of filtration data. The conventional filtration theory is based on Darcy’s equation and expressed as below;

In Equation 1, ΔP is pressure drop across the filter, µ is viscosity of liquid, α is specific cake resistance, w is weight of dry cake solids per unit volume of filtrate, V volume of filtrate, A is area of filtration, and R is medium resistance. Integration of Equation 1 at constant ΔP and A and assuming α constant yields

According to Equation 2 a plot of t/V vs. V gives a straight line, α and R can be calculated from the slope and intercept of the line, respectively.
Various methods have been employed for calculation of cake porosity. Grace, calculated average porosity of final cake from physical dimensions of the filtration cell, cake thickness, and weight of dry solids in cake. Since cake thickness could not be measured during the course of filtration in the present study. The average cake porosity, ε is given by

where σ is the ratio of solid (pa) to liquid density (p), and sc is the mass fraction of solids in the cake.
It has generally found that α and ε are pressure dependent, due to compressibility of the cake. In order to establish this relationship α and ε determined at different pressures.

The exponents s and λ are compressibility and porosity indices, respectively and αo and εo are cake resistance and porosity at unit applied pressure respectively. The porosity of filter cakes is related to specific cake resistance by Kozeny-Carman equation given below.

where K is the Kozeny constant and So is the surface area of the solid per unit volume.
Filtration Procedure
Alumina slurries were prepared at different concentrations of alumina. Before filtration tests, slurries were shaken by Burrell Wrist Action Shaker for 20 minutes and then ultrasonicated far 20 seconds by High Intensity Ultrasonic Processor of Sonics & Materials, Inc. Only flowable slurries were tested for pressure filtration experiments. SEPA ST Pressure Filtration Cell, manufactured by Osmonics Co., was used for filtration. Total cell volume and filter area are 300 cm³ and 16.9 cm², respectively. Polycarbonate membranes, Poretics Corporation, with 0.2 µm pore size and 47 mm diameter were used as filter membranes. The cell was connected to N2 gas cylinder and pressure was adjusted to the desired value. The pressure was measured with a microprocessor based digital panel meter connected to sensor, which was attached to the top of the filtration cell. During filtration, the filtrate volume was recorded versus time. All experiments were stopped when no water was come out for 15 minutes. After completion of the experiments, wet filter cake was weighted, then placed into the oven at 60 °C and left overnight for drying. Wet and dry cake weights were used for calculation of porosity based on Equation 3.
Effect of Pressure
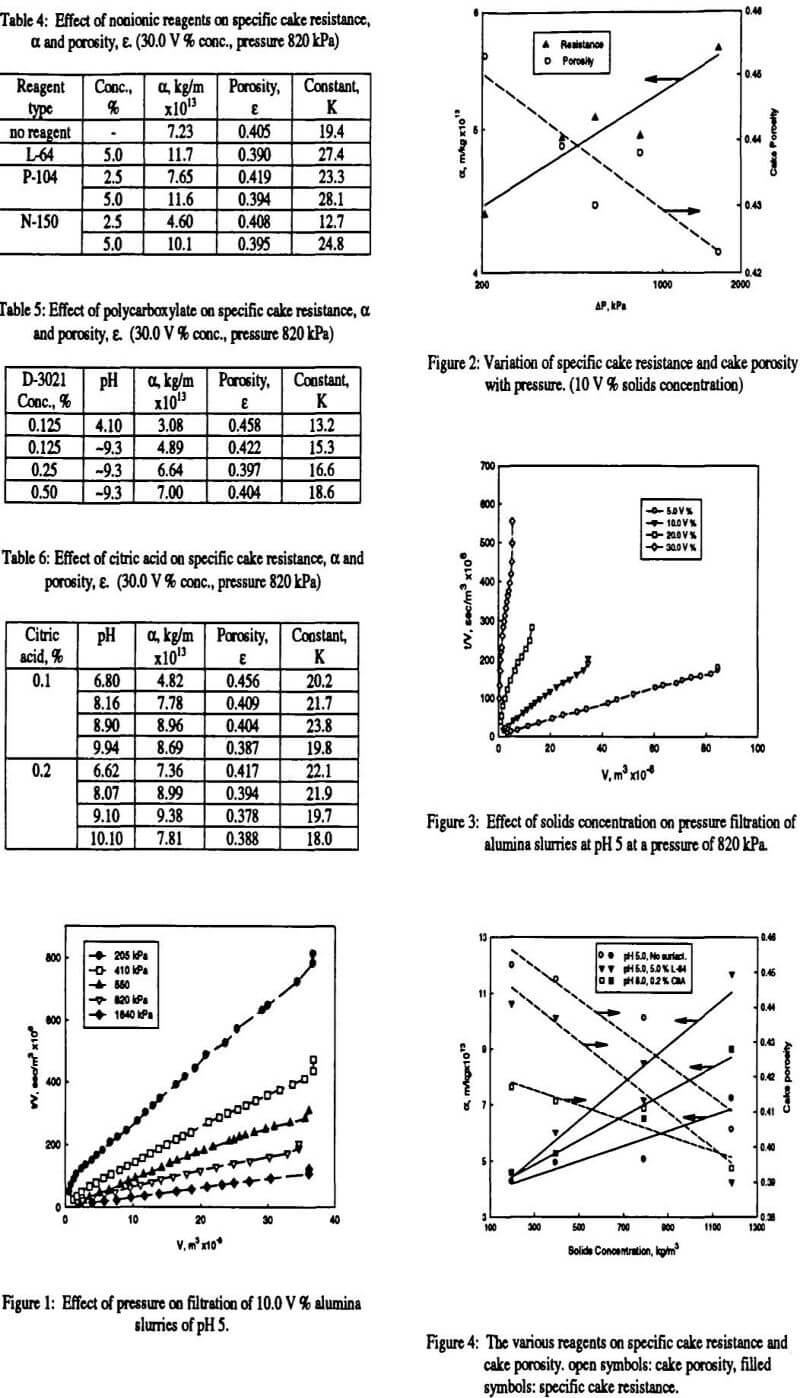
Pressure filtration experiments were carried out at different pressures on 50 ml slurries of 396 kg/m³ (10.0 V %) solids concentrations at pH 5. Applied pressure was varied between 205 and 1640 kPa. Filtration data were plotted t/V versus V as shown in Figure 1. Specific cake resistance was calculated from Equation 2 using only the straight-line portion of the plot. An initial increase was observed in Figure 1 when low pressure, 205 kPa was applied for filtration. It is considered that pressure was not enough for the slurry to start the filtration as fast as the higher pressures and particle sedimentation might have occurred. It was pointed out that sedimentation in pressure filtration is a possible cause of deviation from conventional filtration method (Tiller et al., 1995). Porosity of the cake was calculated from Equation 3. Variation of specific cake resistance and average cake porosity with applied pressure is given in Figure 2.
Effect of Solids Concentration
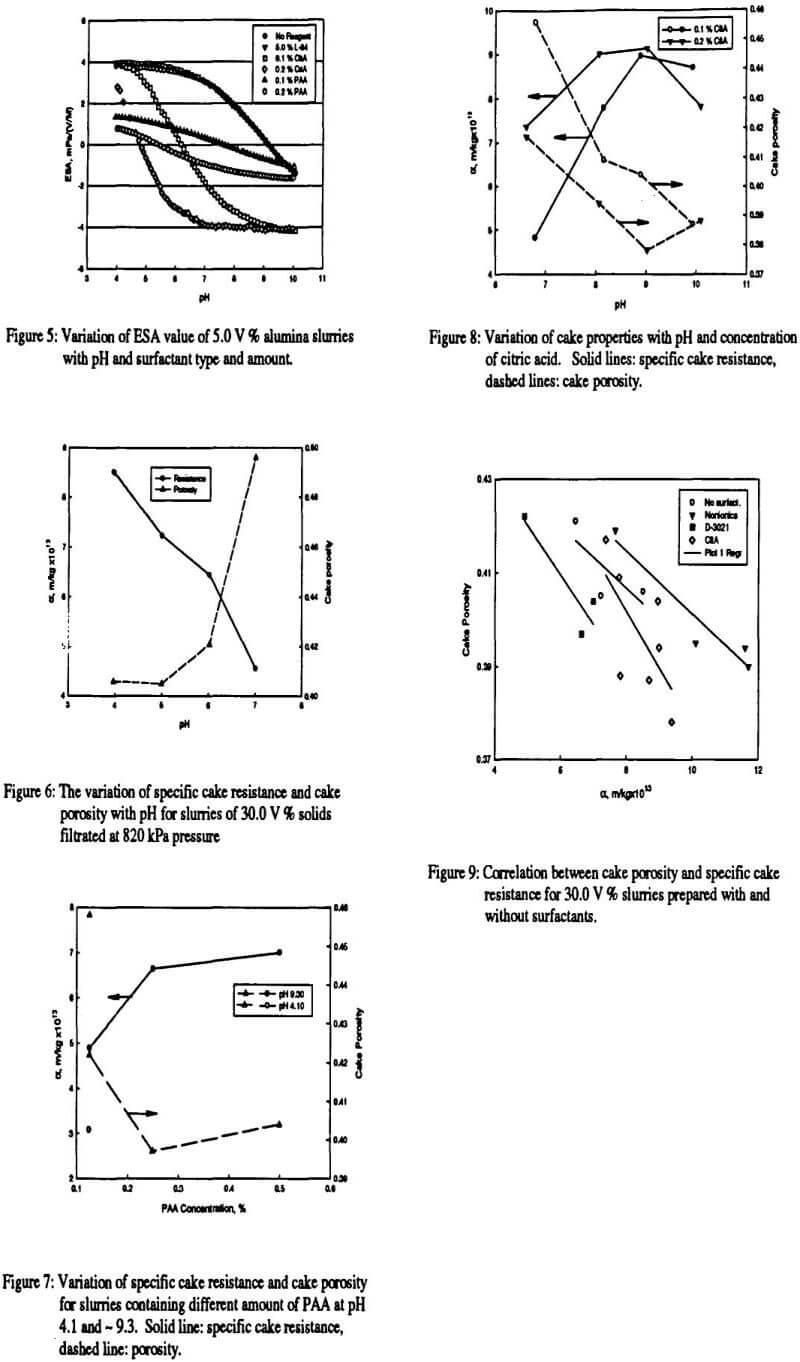
To determine the effect of solids concentration, pressure filtration tests were conducted for three different solid compositions at constant pressure of 820 kPa. The slurry concentration was varied between 198 and 1186 kg/m³ (5.0 and 30.0 V %). Slurries were prepared in the presence and of absence surfactants. The pH was adjusted to 5 with HNO3, but a pH of 8 was chosen in the presence of 0.2% citric acid because these slurries were not flowable at pH 5. The constant pressure filtration results of different concentrations were plotted in Figures 3 for slurries prepared without surfactant The Figure shows that at low solids concentration (5.0 and 10.0 V %) plot of t/V versus V gave straight lines, but as concentration increased an initial increase in the plot was observed at the same pressure. The same pattern was observed when filtration data of slurries prepared with L-64 and citric acid was plotted by the same way. It can be inferred that slurries of high solids concentration requires same time to start filtration at that pressure. As done before, only straight-line portion of the plot was taken for specific cake resistance calculations.


