Table of Contents
Froth flotation is used almost universally in the beneficiation of base metal sulfide ores. Although flotation is very efficient for particles between 150 and 10 µm in size, this efficiency drops off rapidly, as the particle sizes drop below 10 µm. Significant quantities of these ultrafine sulfide values are lost in the beneficiation of copper and lead ores. As reported by Trahar (1976), the problem of fine sulfide losses in flotation has been recognized since the 1930’s. The explanations for this drop in flotation recovery have included (1) slower flotation kinetics for ultrafine particles, proposed by Trahar (1976) and Kelley (1982), (2) low probability of particle-bubble collision due to the particle size to bubble size ratio, proposed by Kelley (1982) and Ahmed (1985), and (3) hydrophilic particle surfaces of ultrafine sulfides due to insufficient collector levels, or rapid oxidation of these fine particles, proposed by Arbiter (1978). One or all of these mechanisms may help explain the problem, but the solution for improved sulfide recovery of the ultrafine particles has not been found. Improved recovery of these lost values would allow more efficient use and conservation of our domestic resources and provide an established technology for the recovery of ultrafine sulfides from newly discovered ores.
A fundamental study was conducted at the Tuscaloosa Research Center, U.S. Bureau of Mines to (1) determine if ultrafine chalcopyrite is floatable (hydrophobic), (2) establish the physical and chemical requirements for ultrafine chalcopyrite flotation, and (3) test proven nonmetallic flotation techniques for improved recovery of ultrafine chalcopyrite. A laboratory flotation procedure was designed to duplicate the commercial process in as many characteristics as possible. This would form the baseline characteristics for comparison with the alternative treatment methods. The areas of study included flotation conditioning, circuit designs, and flotation unit operations. For conditioning, various forms of increased agitation were applied to effectively disperse the collector and create more hydrophobic surfaces on the ultrafine chalcopyrite particles. Various circuit designs were tested to explore successful nonmetallic mineral flotation techniques such as split circuits. Fine bubble flotation was tested to improve the probability for particle-bubble collisions. This report presents the results of this fundamental research.
Raw Materials
Samples of mineral specimen grade chalcopyrite, porphyry copper ore, and porphyry copper tailings were used in this study, nearly pure African chalcopyrite was used to determine the hydrophobic characteristics of chalcopyrite. The chemical analysis is shown in table 1. The chalcopyrite was in fairly massive pieces up to 5 cm across. No other minerals were visible in the specimen pieces.
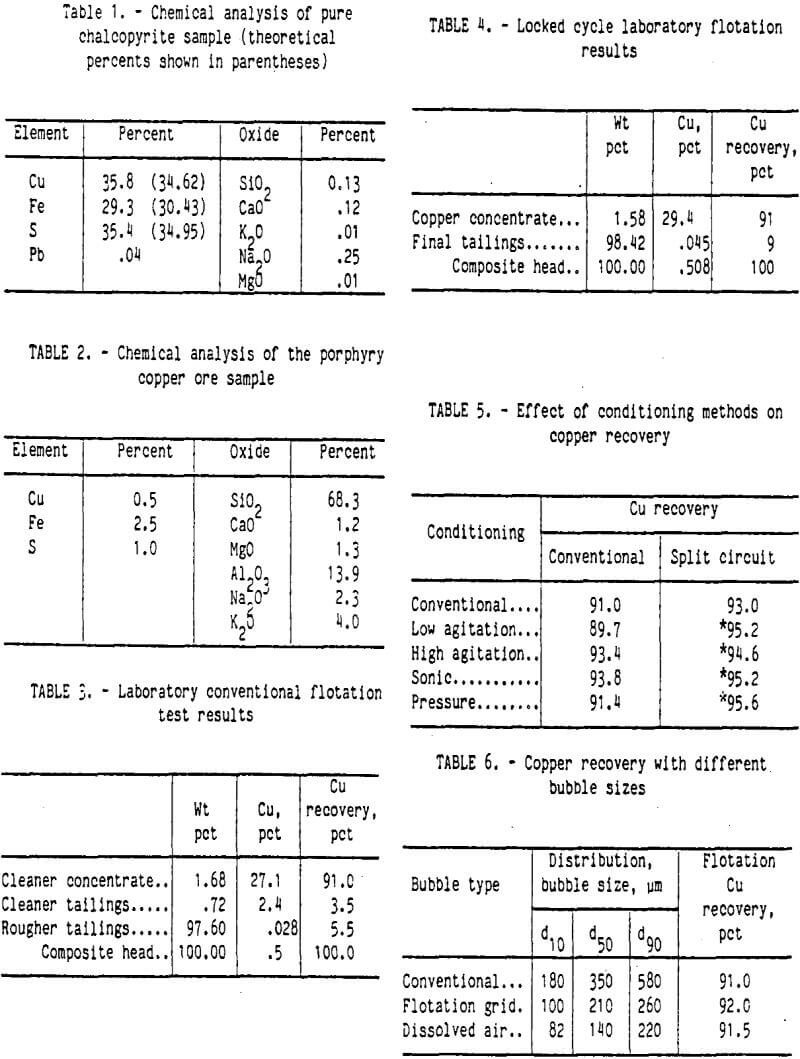
An ore sample and two tailings samples were obtained from the Cyprus Bagdad porphyry copper mine in Arizona. Tailings sample A was from an old tailings pond, and tailings sample B was a composite of several weeks current production tailings samples. Sample A contained 0.156 pct copper, and sample B contained 0.053 pct copper. Plagioclase feldspar was the major mineral with small amounts of biotite and magnetite. Figure 1 shows the size and copper distribution of both tailings samples. In sample A, about 9 pct of sample weight was in the minus 10-µm fraction; however, 21 pct of the copper was in this fraction. For tailings sample B, 16 pct of the weight was minus 10 µm in size, and 19 pct of the copper was in this fraction.
The ore sample contained 0.5 pct copper. A partial chemical analysis of the ore sample is shown in table 2. The major sulfide mineral was chalcopyrite with smaller amounts of pyrite. The gangue mineralogy was the same as that of the tailings samples. The ore pieces were as large as 20 cm across. The chalcopyrite was finely disseminated throughout the ore pieces.
Experimental Procedure and Equipment
Size Analyses
Mineral Samples
To obtain samples for chemical analysis, size separations were conducted by screening and by sedimentation. Screens were used for all separations coarser than 38-µm size. Sedimentation based upon Stokes Law was used for all separations finer than 38 µm. After removing the plus 38-µm-size materials, the samples were diluted to about 3 pct solids with deionized water. Tetrasodium pyrophosphate (TSPP) was used to disperse the particles and allow free settling. Based upon Stokes Law, settling times for chalcopyrite at 20-, 10-, 5-, and 2-µm sizes were used to make the size separations. The samples were settled five times for each size fraction to ensure a clean and sharp size separation. Clear saturated lime water was used to speed up consolidation of the sized products. After the separation, the sized products were dried and submitted for chemical analysis. A MICROTRAC particle size analyzer was used to confirm the size range of each separation and act as a quality control over the sedimentation sizing process.
Bubble Samples
The size distribution of flotation bubbles was obtained by the following method. A flotation test was conducted without the mineral samples, using only water, reagents, and air. Samples of the bubble-water mixtures were quickly placed upon glass slides and photographed through a microscope. The photographs of these bubbles were evaluated with an image analyzer to determine the bubble sizes and the frequency distribution of the bubble sizes. The frequency distribution was converted to the more traditional size distribution per unit weight of air (or unit volume of air).
Sample Preparation
Pure Chalcopyrite
About 200 g of the pure chalcopyrite was ground in a rod mill with deionized water for 1 h. The ground slurry was wet-screened at 38-µm size. The plus 38-µm-size chalcopyrite was reground for another hour in the rod mill. The combined slurry was diluted to less than 3 pct solids with deionized water. A small amount of TSPP was added to help disperse the slurry. If dispersion was not obtained, the clear water was decanted from the slurry, and more deionized water was added to the pulp. The dispersed slurry was separated into 20- by 10-, 10- by 5-, and minus 5-µm-size fractions. No settling aids were used on these size fraction products. Each size fraction sample was washed several times with deionized water to remove the residual TSPP.
Chalcopyrite Ore
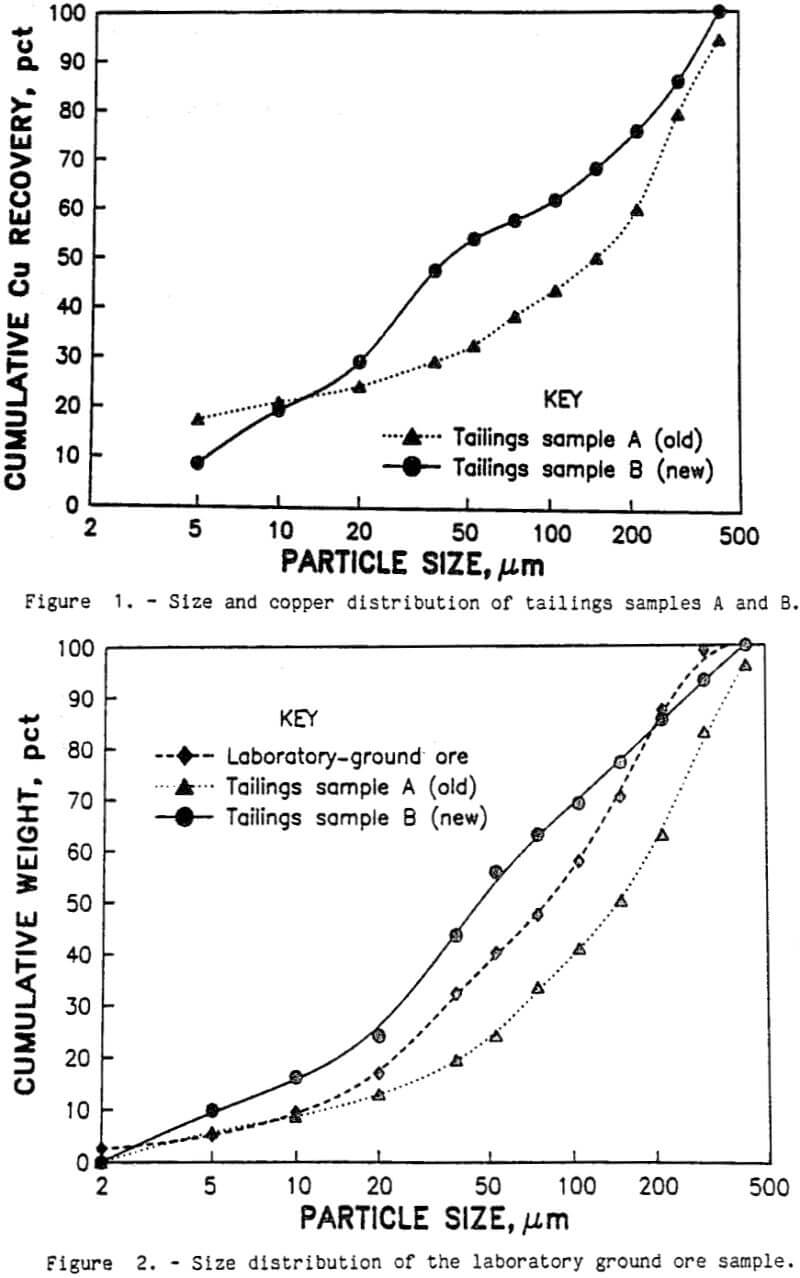
Preparation of the chalcopyrite ore was designed to produce a flotation feed with the same characteristics as those of the actual flotation feed at the Cyprus Bagdad mill. The ore sample was crushed with laboratory jaw and roll crushers to below 2,000-µm size. Each kilogram of the ore sample was ground with saturated lime water in a rod mill at 70 pct solids for 10 min. The slurry was screened at 212-µm size, and the plus 212-µm-size material was reground for 10 min. The combined ground slurry was allowed to settle to the desired consistency for flotation conditioning. The results of this comminution method, along with the size distributions of the two tailings samples, are shown in figure 2. The laboratory-ground ore fell between the two tailings size distributions, which indicated that this grinding procedure produced a flotation feed similar to the flotation feed of the commercial operation.
Flotation Conditioning
Conventional Conditioning
The conventional laboratory flotation conditioning was designed to simulate most of the characteristics of the commercial flotation process. Each kilogram of ground ore was conditioned in a 1,000-g Denver DR flotation cell at about 40 pct solids and 1,500 r/min impeller speed. Clear saturated lime water was used to keep the pH at 12.1 to 12.5. The chalcopyrite collector, potassium amyl xanthate (KAX), was used in dosages from 0 to 0.1 g/kg. After conditioning for 10 min, the sample was ready for flotation.
Pressure Conditioning
A 1-L stirred tank was used to condition the ore pulp under 7 atm air pressure. The ore, lime water, collector, and frother were placed in the tank and pressurized to 7 atm with air. The slurry was stirred in the tank under pressure for 10 min. After conditioning, the pressure was released and the pulp was quickly emptied into the 1,000-g flotation cell.
Low- and High-Agitation Conditioning
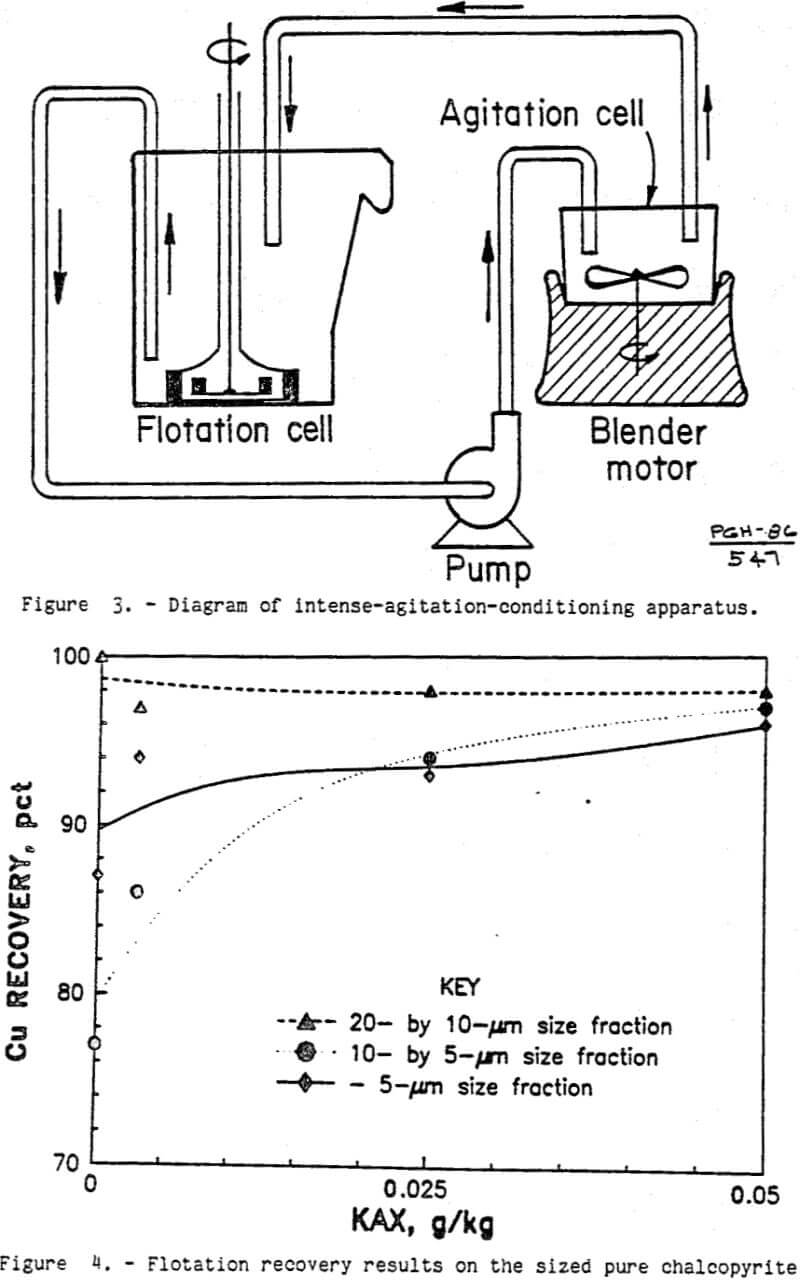
Low- and high-agitation conditioning was the same as conventional conditioning with the following exceptions. The pulp was continuously pumped at 1 L/min from the flotation cell to a 200-mL enclosed chamber with a high-speed impeller intensely agitating the slurry as it passed through the container. A diagram of the technique is shown in figure 3. The impeller was driven by a household blender motor at either the lowest (1,200 r/min) or the highest (1,700 r/min) speed. After passing through the chamber, the pulp returned to the flotation cell. After 10 min of conditioning, the pulp was emptied from the tubing and agitation chamber into the flotation cell.
Sonic Conditioning
Sonic conditioning was the same as low- and high-agitation conditioning with the following exception. The pulp was continuously pumped through a 100-mL sonicator chamber with the transducer tip oscillating at 20 kHz. After 10 min of conditioning, the pulp was emptied from the tubing and sonicator chamber into the flotation cell.
Flotation
Hydrophobic Chalcopyrite Tests
To determine the hydrophobic characteristics of chalcopyrite, a mixture of sized pure chalcopyrite and porphyry copper tailings sample B was floated. The chalcopyrite was sized into three fractions, 20 by 10 µm, 10 by 5 µm, and minus 5 µm. One and a half grams of the sized chalcopyrite was added to 200 g of the tailings sample with a resultant copper content of 0.25 pct. The mixture was conditioned at 30 pct solids for 5 min in clear saturated lime water (pH 12.4 to 12.5). The conditioning took place in a Denver DR 250-g flotation cell at a 1,000-r/min impeller speed. KAX was the chalcopyrite collector used at dosages ranging from 0 to 0.05 g/kg. After conditioning, the slurry was diluted to 25 pct solids and floated for 5 min with 4 L/min air and 0.15 g/kg Dowfroth 250 frother. The rougher concentrate and tailings were dried and analyzed for copper.
Some of the copper in the concentrate was recovered from the tailings sample and was not part of the sized chalcopyrite. To correct for this copper recovery, background flotation tests were conducted on the tailings sample at each reagent level, but without the sized chalcopyrite. Depending upon the KAX level, 0.01 to 0.04 g copper was floated from the 200-g tailings sample. The copper recovered from these background tests on tailings sample B was subtracted from the total copper recovered from the sized chalcopyrite and tailings sample mixture. The remaining copper recovered was the sized chalcopyrite. Only the chalcopyrite recovered in the flotation concentrate was considered hydrophobic. Consequently, all the chalcopyrite left in the flotation test tailings was considered hydrophilic.
Conventional Laboratory Flotation
The conventional laboratory flotation tests were designed to simulate most of the characteristics of the commercial flotation process. After conditioning, the ground ore slurry was diluted with clear saturated lime water to 25 pct solids. After dilution, 0.15 g/kg frother was added for the rougher flotation in a 1,000-g Denver DR flotation cell. The impeller speed was maintained at 1,500 r/min, the airflow was 14 L/min, and additional saturated lime water was added as needed to maintain the froth level. After 10 min of rougher flotation, the concentrate was cleaned once in a 250-g Denver DR flotation cell. The impeller speed was reduced to 1,000 r/min, the airflow was lowered to 1 L/min, and the flotation time was limited to 5 min. No extra reagents were used. Saturated lime water was used to maintain pH and the froth height. After the cleaner flotation, the concentrate, cleaner tailings, and rougher tailings were dried and analyzed for copper, iron, and sulfur.
Locked-Cycle Laboratory Flotation
The locked-cycle laboratory flotation tests were designed to simulate a continuous commercial flotation process by recirculating the cleaner tailings to the head of the grinding circuit. Six 1-kg ore samples were used for this test. The first sample was treated by the conventional laboratory flotation method. The first cleaner tailings were added wet to the second 1-kg sample before grinding. Successively, each cleaner tailing was added to the next 1-kg sample. After five or six cycles, the cleaner tailings weight stabilized, and the rougher tailings and cleaner concentrate represented the products from a continuous flotation operation. The final cleaner concentrate and rougher tailings were sized, dried, and analyzed for copper, iron, and sulfur.
Split-Circuit Flotation
The ground flotation feed was screened as 38-µm size. The plus 38-µm-size ore was treated in 1-kg portions by conventional laboratory flotation techniques. The minus 38-µm-size ore was also treated in 1-kg portions. The results on the flotation products from both treatments were mathematically combined to simulate the split-circuit flotation products.
Dissolved Air Flotation
Dissolved air flotation was the same as conventional laboratory flotation with the following exception. The slurry was conditioned at 50 pct solids in the 500-g Denver DR flotation cell. After conditioning, the slurry was moved to a 1,000-g flotation cell and diluted to 25 pct solids with lime water saturated with dissolved air at 6-atm pressure. This solution was made in pressurized 5-cm-ID pipe, 60 cm high. The interior of the pipe was partly filled with ceramic saddles to provide high surface contact with the lime water. The pipe was pressurized to 6 atm with air. Then lime water with frother was injected at the top, dissolving some of the pressurized air as it trickled to the bottom of the pipe. As the pressure on the lime water quickly changed to atmospheric, tiny bubbles (50-µm-size) were formed. These bubbles amounted to 7 pct of the total volume of lime water and dissolved air. Additional air at 10 L/min was introduced to the cell by the conventional method to supplement the fine dissolved air bubbles and to help form a froth.
Grid Flotation
Fine bubbles were also generated in a modified 500-g Denver DR flotation cell. The cell was constructed with Plexiglas matching all the dimensions of the standard 500-g stainless steel Denver DR flotation cell. A stainless steel screen with 2-mm-size openings was mounted 1 cm from the bottom. The high turbulence near the impeller caused the air bubbles to break up as they flowed through the screen grid on the cell’s bottom. The airflow was 7 L/min. Two 500-g rougher flotations were conducted from each test, and their concentrates were combined for the conventional cleaner flotation step.
Experimental Design
The improved recovery of ultrafine chalcopyrite can only be evaluated by comparing copper flotation recoveries and grades from conventional flotation methods with the proposed alternative methods. Factorial experimental designs, as reported by Davies (1956), were used as much as possible to clearly sort out the experimental error from the effects of the alternative treatment methods. The largest factorial designed experiment for this research had four factors: (1) the circuit type, conventional or split circuit; (2) the conditioning method; (3) the flotation bubble size; and (4) the size fraction of the ground ore. The five conditioning methods were conventional, pressure, low agitation, high agitation, and sonic. The two flotation bubble sizes were conventional and fine bubbles. The fine bubbles were produced by the dissolved air method or the screen grid method. The four ore size fractions were 20 by 10 µm, 10 by 5 µm, 5 by 2 µm, and minus 2 µm. From this design the precision of the experiments could be calculated, and the significance of each treatment method could be rigorously determined, as shown by Scheffi (1959). Several small factorial designed experiments were used, where practical, to measure the significance of the experimental results.
Experimental Results and Discussion
Hydrophobic Nature of Ultrafine Chalcopyrite
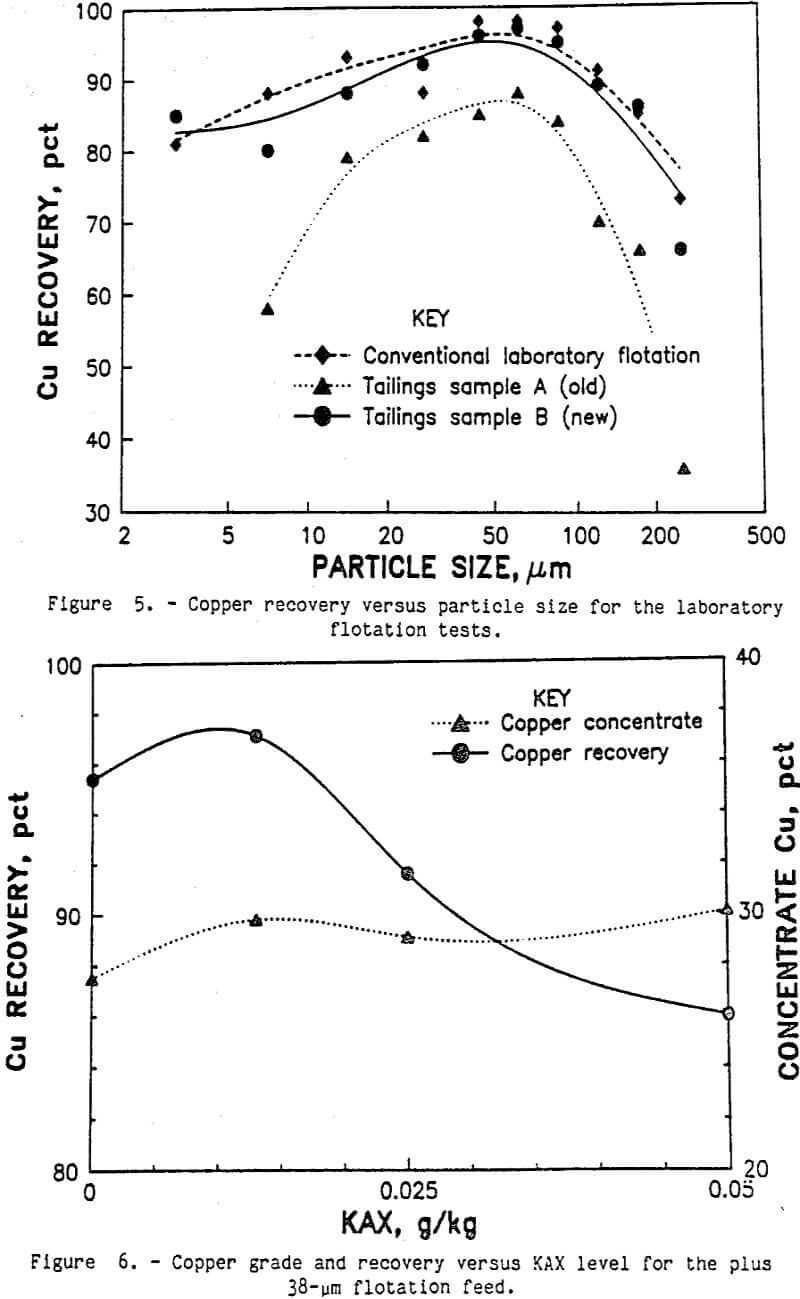
The ultrafine chalcopyrite from the nearly pure chalcopyrite specimen showed significant natural hydrophobicity as shown in figure 4. With no KAX, over three-quarters of the chalcopyrite floated. Virtually all of the 20- by 10-µm chalcopyrite was recovered in the flotation concentrate. For the 10- by 5-µm and minus 5-µm fractions, the chalcopyrite recovery without collector was 77 and 87 pct, respectively. With only 0.05 g KAX per kilogram of ore, over 96 pct of the chalcopyrite was recovered from all three size fractions. This indicates that ultrafine chalcopyrite surfaces can be modified with KAX, making the particle surfaces sufficiently hydrophobic for conventional flotation recovery.
Conventional Laboratory Flotation
The conventional laboratory flotation was designed to simulate the actual commercial process as much as possible. The average of several conventional flotation tests is shown in table 3. Ninety-one percent of the copper was recovered in the 27.1-pct-copper cleaner concentrate. The copper recovery was close to the recoveries reported in the literature by Arbiter (1978), and the copper concentrate grade was very good. Analyses of copper recovery by sizes are shown in figure 5. Also shown is the equivalent copper recovery by size for the two commercial tailings samples A and B. The equivalent recovery was calculated using the copper contents for each size fraction of both the tailings sample and the laboratory ground ore sample. The recovery curves were typical, showing lower recoveries for the coarse and ultrafine size fractions. Slightly better recoveries were obtained by the laboratory flotation method. Petrographic examination of the size fractions from the rougher tailings samples showed some incomplete liberation of the chalcopyrite in the coarse size fractions, which explains the lower recovery for these sizes. The only copper mineral identified in the ultrafine size fractions of the rougher tailings was liberated chalcopyrite. The two tailings samples A and B also showed liberated chalcopyrite in the fine size fractions. Improved chalcopyrite recovery will be obtained if this liberated chalcopyrite can be floated.
Locked-Cycle Laboratory Flotation
The locked-cycle laboratory flotation tests were designed to simulate the continuous commercial process. After six cycles, the cleaner tailings weight had stabilized. The results of the tests are shown in table 4. Recirculating the cleaner tailings to the grinding process did not improve the overall copper recovery for this method. However, the concentrate grade did improve for the locked-cycle tests. The size distribution of the copper recovery for the locked-cycle tests was virtually identical to the laboratory flotation results shown in figure 5. The continuous circuit copper recovery obtained from the locked-cycle tests was the same as the cleaner concentrate recovery obtained with the laboratory flotation. Throughout the remainder of this paper, 91-pet copper recovery will be considered as the copper recovery obtained from the commercial operation.
Split-Circuit Flotation Design
Separating flotation feed into coarse and fine size fractions should eliminate any undesirable interactions between the coarse and fine particles. At a 38-µm-size split, 68 pct of the weight and 65 pct of the copper was in the plus 38-µm-size fraction. Subsequent flotation of the plus 38-µm-size fraction by conventional laboratory flotation methods produced a 29.1-pct-copper concentrate and recovered 97 pct of the copper. As shown in figure 6, very little collector was needed to obtain 97 pct recovery of the copper. Because the plus 38-µm particles have much less surface area than the minus 38-µm particles, less collector was required to make the particle surfaces hydrophobic.
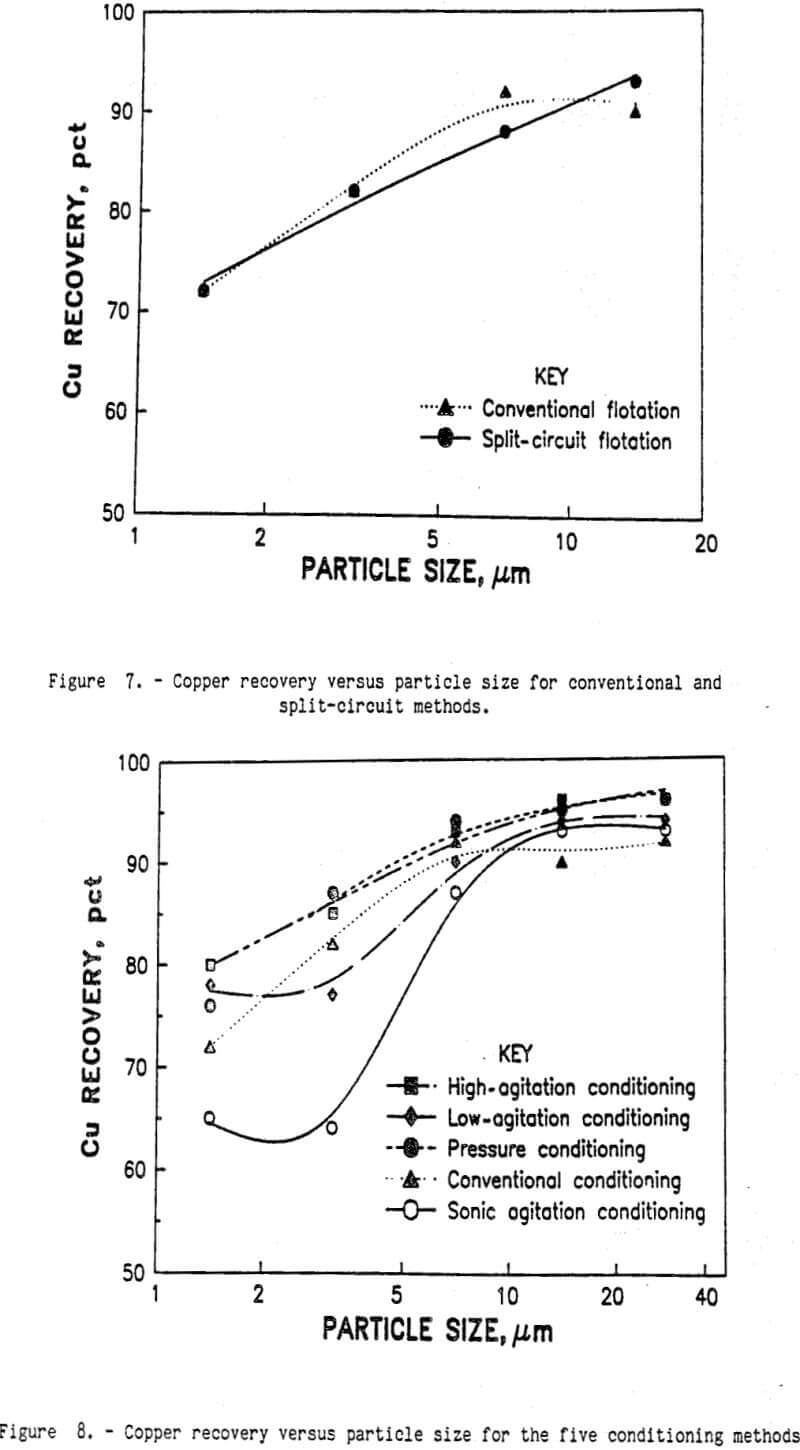
Conventional laboratory flotation also recovered 86 pct of the copper from the minus 38-µm flotation feed in a 27.8-pct-copper concentrate. Combining the results for the two products mathematically, 93 pct of the copper was recovered by the split-circuit method in a 28.7-pct-copper concentrate. Analysis of the Cu recoveries for each of the fine size fractions (see figure 7) revealed only a small difference between conventional flotation and split-circuit flotation. Although the split-circuit method appears to be an improvement over the conventional flotation method, the amount of improvement may be within the experimental error of these two techniques. To clearly separate the difference between conventional flotation and split-circuit flotation and the experimental variations, a factorial design experiment was conducted. The experimental precision was calculated to be ±0.995 for percent copper recovery. Using the statistical F-test, the difference between conventional and split-circuit flotation was very significant at the 95-pct confidence level. Therefore, split- circuit flotation was an improvement over conventional flotation.
Flotation Conditioning
To study the relative effects of flotation conditioning, the five conditioning techniques were included as factors in the factorial experimental design mentioned previously. The broad base of this experimental design increased the degrees of freedom and improved the precision for the hypothesis testing. Through analysis of variance, the effect of flotation conditioning was separated from the other experimental factors. Based upon the statistical F-test, flotation conditioning was a significant factor for copper recovery. The results from the conventional and split-circuit flotation circuits are shown in table 5. For the split-circuit flotation, only the minus 38-µm-size fraction was treated by the intense agitation techniques. The plus 38-µm-size fraction was treated by conventional methods, recovering 97 pct of the copper in a 29.1-pct- copper concentrate. The results for the minus and plus 38-µm-copper concentrates were combined mathematically to show the total copper recovery for the split-circuit design. As shown in the table, there was a significant interaction effect between the flotation circuit design and the conditioning method. Using the Duncan multiple-range statistical techniques, each treatment method was individually compared with the other methods; all of the alternative conditioning methods with the split-circuit flotation were statistically better than the conventional conditioning with conventional flotation. However, none of those four conditioning techniques was statistically better than any of the others. Most of the improved copper recovery came from the split-circuit method, and a smaller amount of copper recovery improvement came from changing the conditioning method from the conventional method to any one of low agitation, high agitation, sonic, or pressure conditioning. All four of those methods were statistically equal at the 95-pct- confidence level.
For each conditioning method, the copper recovery for the ultrafine sulfides is shown in figure 8. Pressure, low-agitation, and high-agitation conditioning recovered more copper for all particle sizes. Sonic conditioning did not recover more copper than the conventional conditioning method. The best copper recovery from the smaller size particles was obtained with high-agitation conditioning. This indicates that intense conditioning with the collector (KAX) is required to render all of the ultrafine chalcopyrite particle surfaces hydrophobic. There are two possible mechanisms to explain this phenomenon. First, the low level of KAX added in the mineral pulp may be quickly absorbed on the first available mineral surfaces. The relative velocities of the large chalcopyrite particles in the water are much larger than the ultrafine chalcopyrite particles, causing more water to pass over the larger particles surfaces per unit time. The amyl xanthate is then absorbed faster on the large chalcopyrite particles than on the ultrafine chalcopyrite particles. By the time the KAX in solution becomes depleted, nearly all of the large chalcopyrite particles have hydrophobic surfaces. Subsequent conditioning will transfer the collector from one particle to another by collisions, but at a much slower rate than by adsorption from the solution. Increasing agitation during conditioning will increase the number of particle-particle collisions and render more of the ultrafine chalcopyrite particle surfaces hydrophobic.
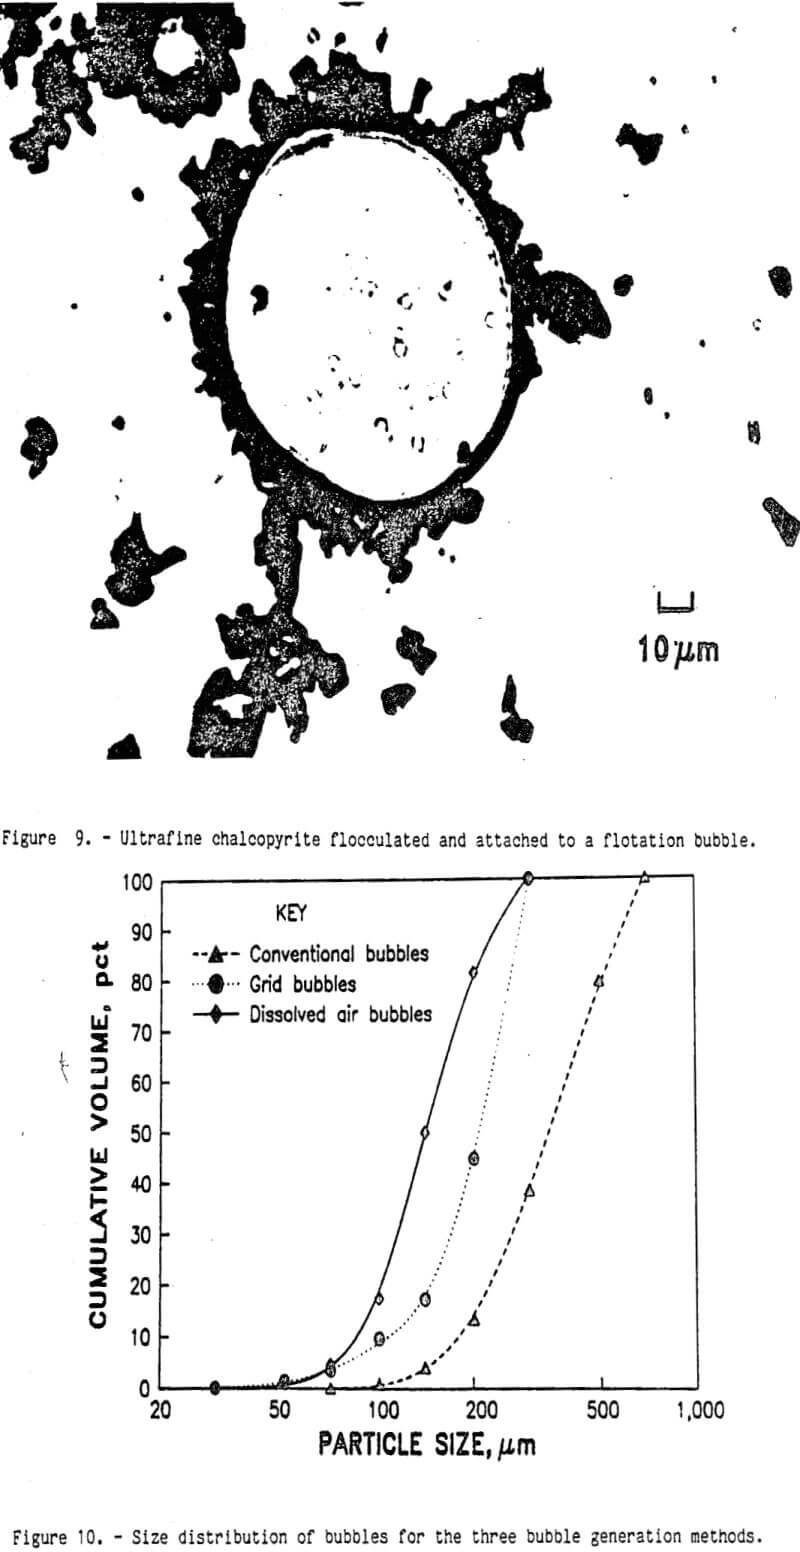
The second possible mechanism involves selective shear flocculation. Hydrophobic particles tend to flocculate. Under intense agitation conditions, ultrafine hydrophobic particles will collide at a high energy, which can break through the collector layer on the particle surface. At this point, the surface tension at the edges of the contact region for the two particles binds them together. Now, the two or more hydrophobic particles act as a much larger particle. During subsequent flotation, the flocculated hydrophobic particles are floated faster than the individual ultrafine particles. This results in improved flotation recovery of the ultrafine minerals. In the flotation of chalcopyrite, there was no conclusive evidence that some of the ultrafine chalcopyrite particles are selectively flocculated with each other during conditioning or flotation. KAX added to a slurry of pure chalcopyrite showed extensive flocculation. But those experiments were conducted without gangue minerals. For the low-grade ore sample, selective flocculation of chalcopyrite could not be experimentally detected. The concentrate froth showed numerous floes of chalcopyrite as shown in figure 9, but whether or not the chalcopyrite was flocculated before the bubble attached could not be determined.
Flotation Bubble Size
Typical bubble size distributions for several bubble generation methods are shown in figure 10. These size distributions were calculated per unit volume of air. The smallest bubbles were produced by dissolved air. Next, the wire screen grid at the bottom of the float cell produced bubbles slightly coarser than those produced using the dissolved air method. And finally, the coarsest bubbles were obtained with the conventional flotation bubble generation technique. Flotation tests with each bubble size distribution were conducted, and the results are shown in table 6. There was a slight improvement in the copper recovery with fine bubbles. For these few tests, the differences between the copper recovery with the conventional bubbles and with the flotation grid or dissolved air fine bubbles were not statistically different at a 95-pct confidence level.
A larger experimental design with a better precision or more degrees of freedom was needed. A 2 by 2, by 5, by 1 factorial experiment was conducted to study (1) the individual effects of circuit design, bubble size, conditioning method, and particle size response and (2) the first-level interactive effects between these four factors. This experiment was described earlier in the experimental design section. The grid flotation or pressure conditioning method was used to generate the fine bubbles. The precision obtained with this experiment was ±1.14 pct copper recovery with 13 degrees of freedom. Using the F-test, the difference between conventional bubbles and fine bubbles was still not statistically different than the experimental error. In addition, none of the first-level interactions between bubble size and the other three factors were statistically significant. This does not mean that the bubble size has no effect upon chalcopyrite flotation; rather, the bubble size effect was smaller than the experimental variations for these laboratory flotation tests.
Conclusions
Flotation of ultrafine chalcopyrite can be improved by processing the ore with (1) split-circuit design and (2) intense agitation conditioning before flotation. At equivalent or even lower collector consumption, a split circuit flotation design, treating the plus 38- and minus 38-µm-size ore individually, recovered 93 pct of the copper in a 28.7-pct-copper concentrate. Both size fractions were individually treated by conventional flotation methods. Improved flotation of the ultrafine sulfides in the minus 33-µm-size fraction was obtained with intense agitation conditioning before flotation. The high-agitation technique produced the greatest copper recoveries in the minus 10-µm-size fractions. Using conventional flotation for the plus 38-µm-size fraction, 97 pct of the copper was recovered in a 29.1-pct-copper concentrate. For the minus 38-µm-size fraction, high-agitation conditioning with conventional flotation produced a 27.2-pct- copper concentrate and recovered 93.0 pct of the copper in the ore. The split-circuit design produced a 25.3-pct-copper concentrate and recovered 95.6 pct of the copper. Fine bubbles did not produce a statistically significant improvement in the flotation recovery of the ultrafine chalcopyrite flotation.