Table of Contents
The roasting process is widely used in extracting copper from its sulfide ores. At present the development of a new process for winning copper from pelletized chalcocite concentrate is underway at the Bureau of Mines Twin Cities Metallurgy Research Center. In this process, the dead roasting of sulfide is followed by the reduction of oxide to metallic copper by a reducing agent such as hydrogen. This work revealed a scarcity of fundamental information connected with the chemistry, kinetics, and mechanism of the oxidation of copper sulfides.
The broad objectives of the research are to investigate the sequence of the principal chemical reactions and the kinetics and mechanism of chemical reactions involved, and to find a method to improve the roasting process. The present report deals only with the chemistry of the process.
According to Kullerud, covellite (CuS) begins to break down to digenite (Cu1.8 S) and sulfur at 235 ° C in an inert atmosphere. Digenite is stable up to 550° C and then breaks down to chalcocite (Cu2S) and sulfur.
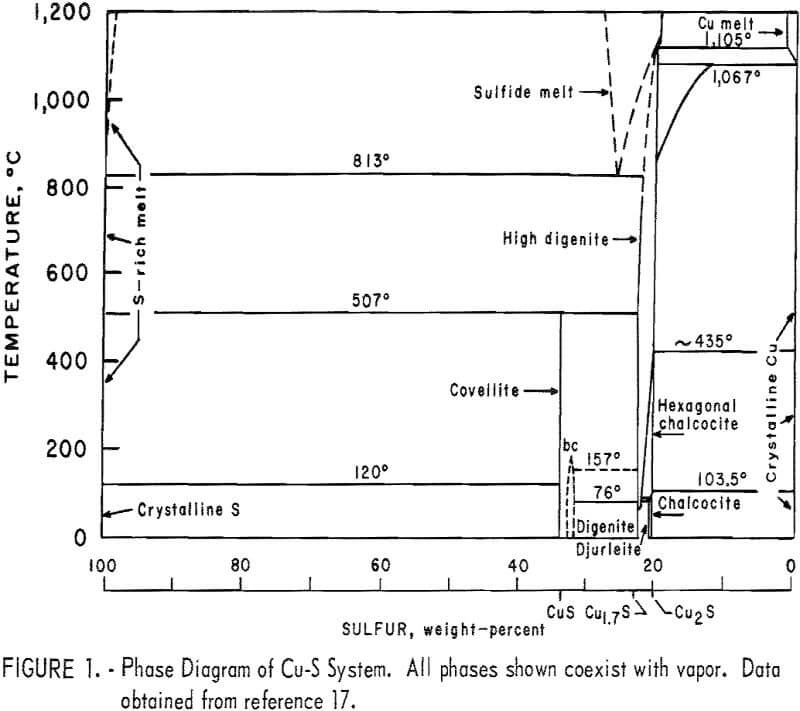
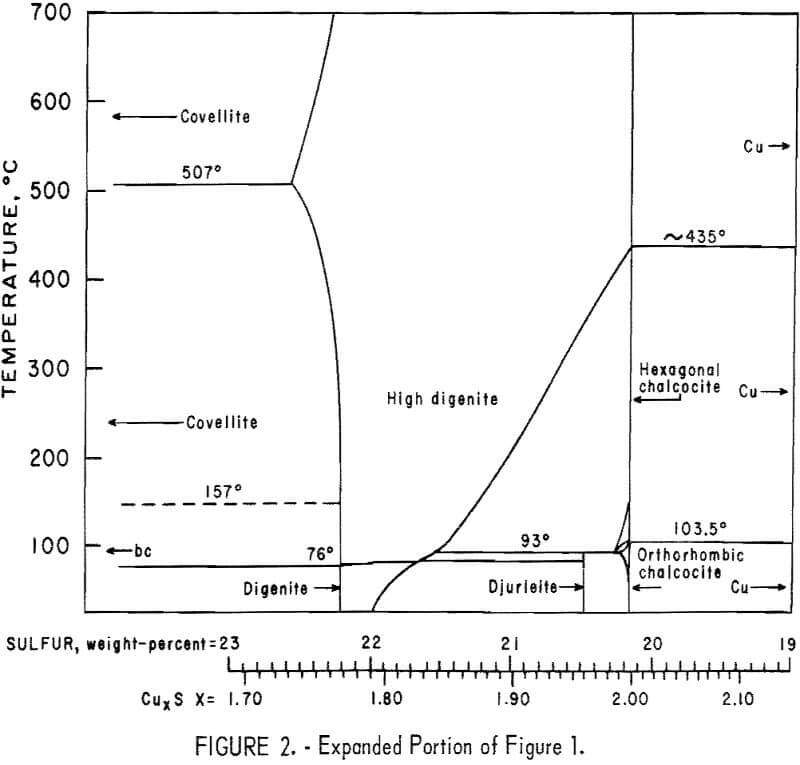
Buerger investigated the phase diagram of the Cu2S-CuS system and reported the presence of three compounds and four phases. The compounds are chalcocite, ideally Cu2S; digenite, ideally Cu1.8S; and covellite, CuS. The phases are high chalcocite, low chalcocite, digenite, and covellite. According to Buerger and Wuensch, in high chalcocite the sulfur atoms are substantially fixed in hexagonal close-packed structure, while copper atoms are mobile through the interstices of this structure. This high disorder was apparent from the investigation of Jensen, who observed that the diffusion rate of copper in low chalcocite increased rapidly as the temperature approached the transformation temperature and was much higher throughout the high-chalcocite range. The activation energy for diffusion was about 0.15 ev, an extremely low value compared with the 1 to 2 ev usually found for metal-atom diffusion in close-packed compounds. According to Ray, digenite is known to be only a p-type semiconductor and imperfection in its crystal structure is mainly due to copper deficiency. Figure 1 summarizes the Cu-S phase diagram, while figure 2 shows a portion of that phase diagram, based upon the work of Roseboom.
Martinez and Hollander studied the thermal decomposition of CuS to Cu1.8 S in N2 by differential thermal analysis (DTA) and thermal gravimetric analysis (TGA) but were unable to explain the thermograms satisfactorily, due to the presence of impurities in the starting material. According to Kulikova, at 425° to 500° C in an inert atmosphere, covellite dissociates into digenite and partially into β-chalcocite and gaseous sulfur is liberated.
Ashcroft reported that the oxidation of copper sulfides proceeds with an intermediary stage of the formation of copper sulfate which subsequently dissociates into copper oxides and SO3 gas. Peretti has conclusively shown that a layer of Cu2O appears directly adjacent to the Cu2S during the roasting of cylindrical briquets of copper(II) sulfide under conditions where sulfates will be formed. Above 663° C, CuO was the only final product, but below 663° C, increasing amounts of sulfates were found mixed with the CuO. McCabe and Morgan supported Peretti’s claim that Cu2O is formed directly from Cu2S. Wadsworth and coworkers studied the oxidation of natural chalcocite in oxygen and their results were in general agreement with those of McCabe and Morgan and Thornhill and Pidgeon.
Experimental Work
Methods and Apparatus
Differential thermal analysis (DTA) and thermal gravimetric analysis (TGA) techniques were used in this study. The DTA (model KA H) and TGA (model TGA 5-B) were supplied by Tracor Company, Austin, Tex. Stainless steel powder-sample holders and Inconel liquid-sample holders were fitted with platinum versus platinum-10 percent rhodium thermocouples. The reference and sample holders were cylindrical, 0.25 inch in diameter and 0.25 inch deep. The apparatus was equipped with a recorder, controller, amplifier, and heating-rate
programmer. A platinum versus platinum-10 percent rhodium thermocouple was placed in the center of the sample block and connected to the programmer, recorder, and controller to program the linear heating rates and to record and control the block temperature. The programmer gave a maximum of 2 percent deviation from linearity over any 100° C interval.
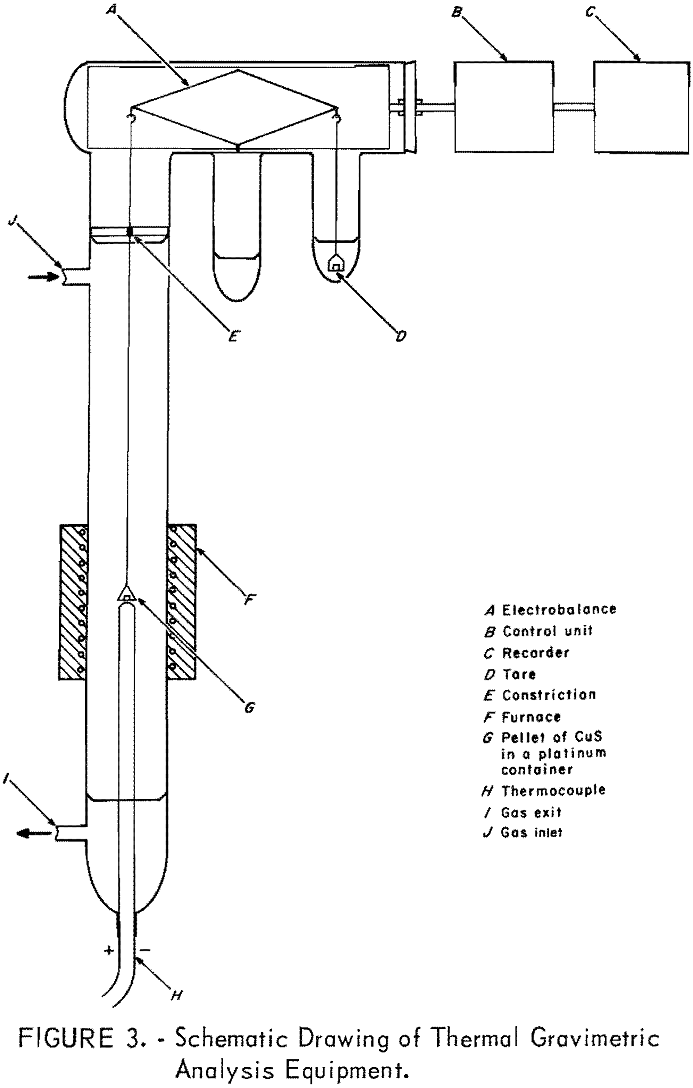
The TGA apparatus was equipped with a Cahn RG automatic electrobalance assembled such that the DTA control unit could be utilized with this apparatus. A small resistance furnace supplied by Tracor was used throughout this study. A platinum versus platinum-10 percent rhodium thermocouple made from 0.0001-inch-diameter reference grade wire was enclosed in a small-diameter quartz protection tube and placed just under the platinum bucket, as shown in figure 3. This thermocouple was used for programming as well as recording and controlling the sample temperature. The sample holder was enclosed in a 19-mm-inside-diameter Vycor tube with a gas inlet near the top. The sample holder was connected to the weighing mechanism by a platinum wire. A ground-glass joint with gas outlet was connected to the bottom of the tube to facilitate the insertion of the thermocouple.
Materials and Reagents
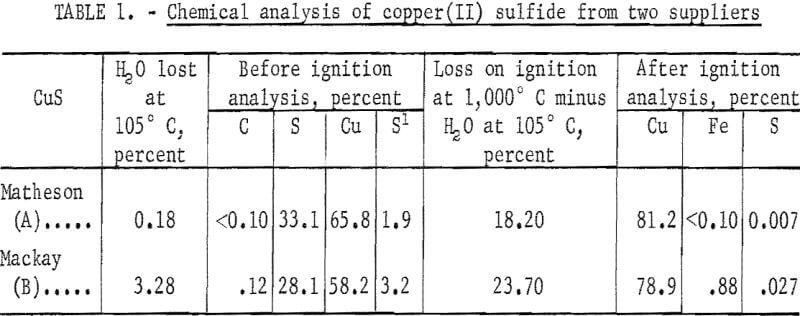
Copper (II) sulfide powder was obtained from A. D. Mackay, Inc., and Matheson, Coleman and Bell. The manufacturer reported the following upper limits for impurities in the Matheson, Coleman and Bell reagent-grade CuS; alkali salts, 1.0 percent; chloride, 0.01 percent; and iron, 0.1 percent. A. D. Mackay, Inc., did not provide results of chemical analysis on their reagent-grade CuS. Table 1 contains the chemical analyses of the copper sulfides. According to these data, Matheson’s product (hereafter referred to as covellite A) was 99 percent CuS, while the Mackay product (covellite B) was about 84 percent CuS. X -ray diffraction analysis showed the presence of CuSO4·3H2O as an impurity in covellite B. From the chemical analysis, it was estimated that covellite B contained a substantial amount of CuSO4·3H2O.
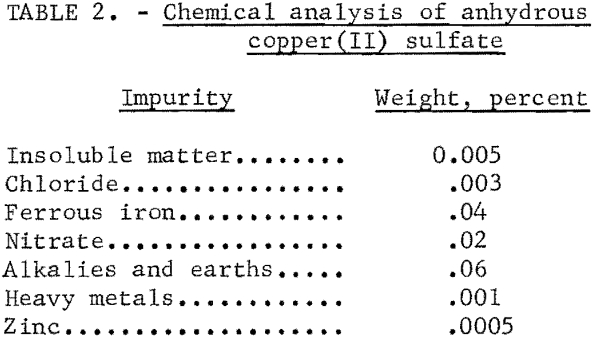
Anhydrous copper(II) sulfate was supplied by Fisher Scientific Co. The chemical analysis supplied by the manufacturer is given in table 2. Copper(II) oxysulfate (CuO·CuSO4) was prepared by heating Fisher CuSO4 powder at 650° C for 36 hours in air, with frequent rabbling. The X-ray diffraction analysis of the product showed CuSO4 as a trace impurity. The high-purity nitrogen and filtered air used were passed through Drierite before entering the reaction chamber. Cylindrical pellets of different heights but of a constant radius (0.113 inch) were made from CuS powder. Pellets made at a pressure of greater than 150,000 psi had an average density of 94 percent of the theoretical density for CuS.
Experimental Results and Discussion
Conversion of Covellite to Digenite
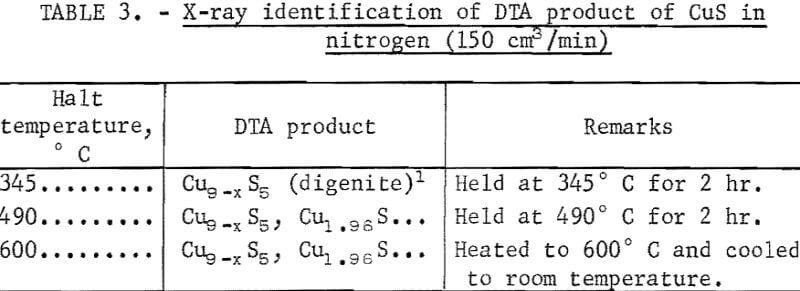
Figures 4 and 5 represent typical DTA thermograms obtained when samples of covellite B and A, respectively, weighing in the range of 10 to 30 mg; were heated in the powder-sample holder at 12° C/min from room temperature to 800° C in flowing N2 at 150 cm³/min. The presence of impurities in covellite B
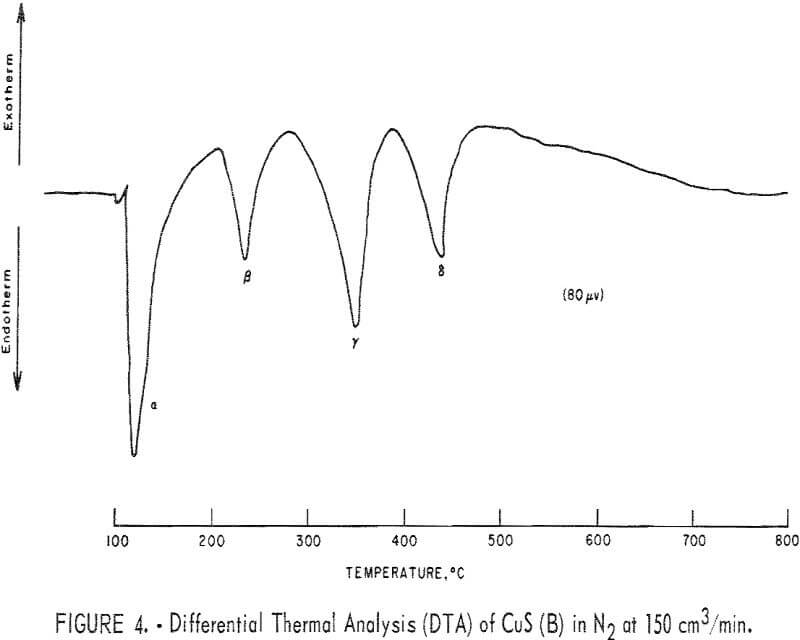
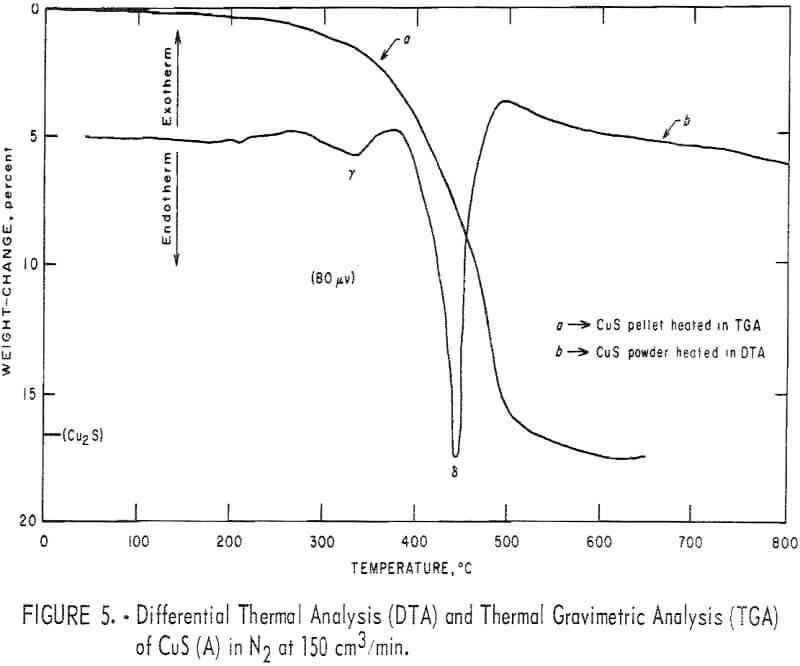
and the noticeable difference in the roasting thermograms were found only after some experimental work with covellite B had been done. It is believed that the comparison of the results obtained with covellites A and B will be educational in revealing the effects of impurities on the results. For ease of reference, Greek letters are used to designate the various endotherms and exotherms. Various DTA runs were made from room temperature to various halt temperatures, and the product when cooled to room temperature was analyzed by X-ray diffraction. Typical results are summarized in table 3. Curve a in figure 5 represents the TGA thermogram obtained when a pellet made from covellite A was heated at 5° C/min from room temperature to 670° C in flowing N2 at 190 cm³/min. The weight loss obtained, as indicated on the thermogram, is very close to the theoretical value as predicted by the following equation:
2CuS → Cu2S (digenite) + S……………………………………………………………(1)
During the process, some sulfur deposited on the colder part of the reaction tube. Cazafura and Dobovisck heated CuS in N2 and obtained only one endotherm (420° to 470° C) in their DTA thermogram, similar to the peak in figure 5. With the aid of present results and the knowledge of the impurities in the starting material, the peaks due to Cu-S interactions in figures 4 and 5 can be reasonably interpreted as follows;
α endotherm: Dehydration of free absorbed moisture.
β endotherm: Dehydration of structural water attached to CuSO4·3H2O.
γ endotherm: This may be due to the removal of the elemental sulfur and/or to the removal of the remaining structural water.
δ endotherm: Conversion of covellite to digenite.
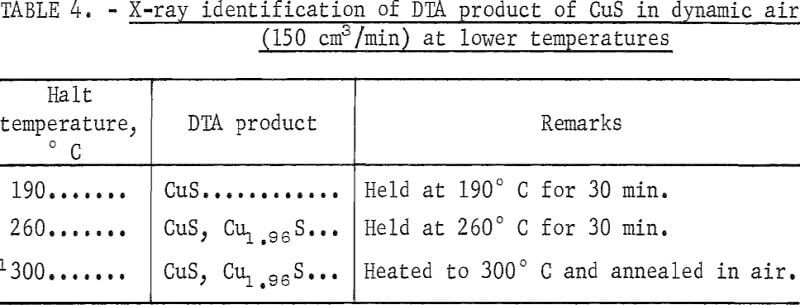
Similar DTA experiments were performed at various halt temperatures in flowing air at 150 cm³/min. The products were analyzed by X-ray diffraction and are summarized in table 4. Covellite is converted to digenite at lower temperature when heated in air. This can be explained by shifting reaction 1 to the right by rapid oxidation and removal of liberated sulfur as SO2. The overall reaction can be represented by
2CuS + O2 → Cu2S + SO2…………………………………………………..(2)
Ganguly and Mukherjee have also shown that while covellite decomposes to a negligible extent at 340° to 360° C in the absence of air, its decomposition is appreciable in the presence of air.
There is considerably less agreement with regard to the products of reactions involving copper, sulfur, and oxygen and the temperatures at which they occur. To make any intelligent prediction, an understanding of the thermodynamics of the system is a necessary prerequisite. To assess the thermodynamic feasibility of the various reactions involved in the roasting of copper(II) sulfide, predominance-area diagrams of Cu-S-O systems were constructed at various temperatures from the data reported by Ingraham. Figures 6 and 7 represent the equilibrium-phase diagrams of Cu-S-O systems at 800° and 950° K, respectively. With the aid of figures 6 and 7, the most probable reactions taking place during the roasting of CuS in air could be generalized as follows:
2CuS = Cu2S (digenite) + S…………………………………………………(1)
S + O2 = SO2…………………………………………………………………….(3)
Cu2S + 3/2O2 = Cu2O + SO2…………………………………………………(4)
Cu2S + 4O2 = 2CuSO4……………………………………………………….(5)
SO2 + ½O2 = SO3……………………………………………………………….(6)
Cu2O + ½O2 + 2CuO……………………………………………………………(7)
Cu2O + SO3 + ½O2 = CuO·CuSO4………………………………………..(8)
Cu2O + 2SO3 + ½O2 = 2CuSO4………………………………………………(9)
2CuSO4 ↔ CuO·CuSO4 + SO3……………………………………………………(10)
CuO·CuSO4 ↔ 2CuO + SO3…………………………………………………….(11)
The thermodynamic conditions of these reactions are such that the temperature and the partial pressure of SO2 and O2 will determine which of the solid phases are stable. If the roasting is carried out under nonequilibrium
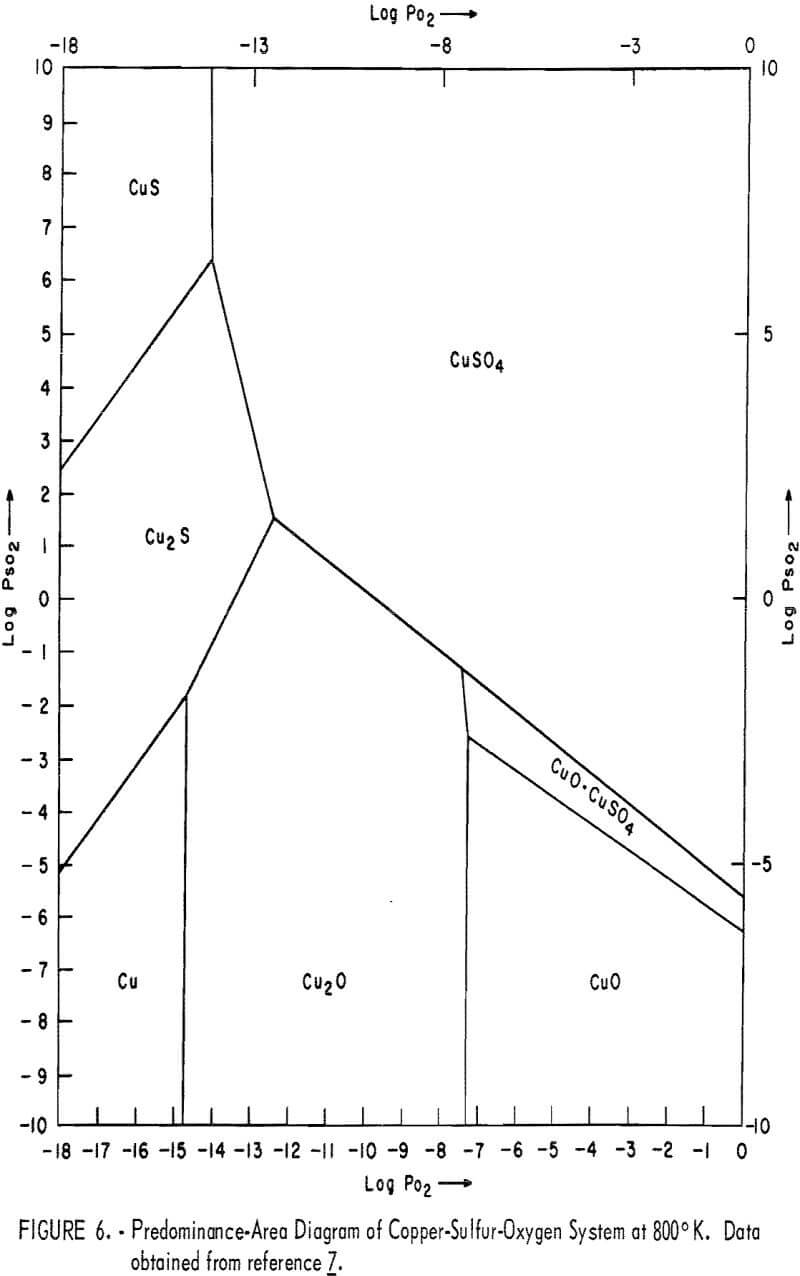
conditions, which is usually the case, the kinetics and the mechanism of the reaction will play an important role in determining the various phases present in the roast product.
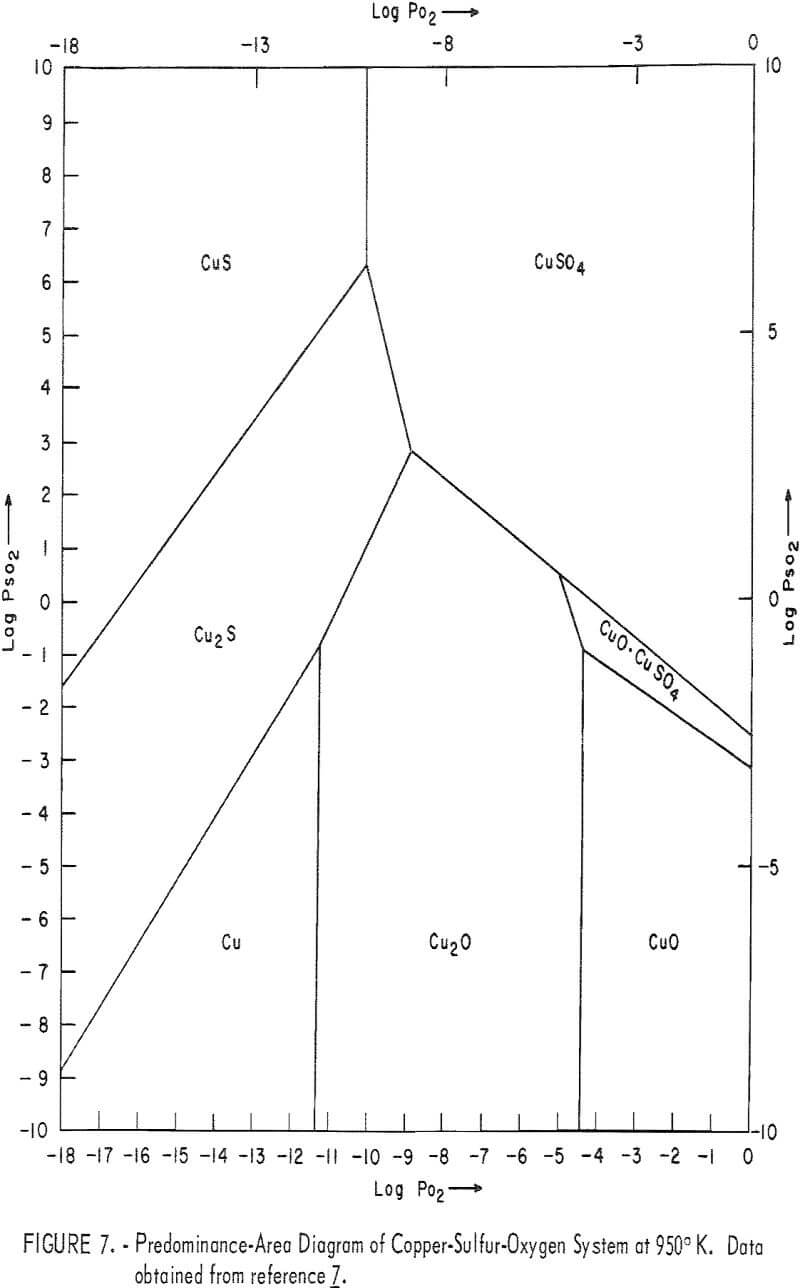
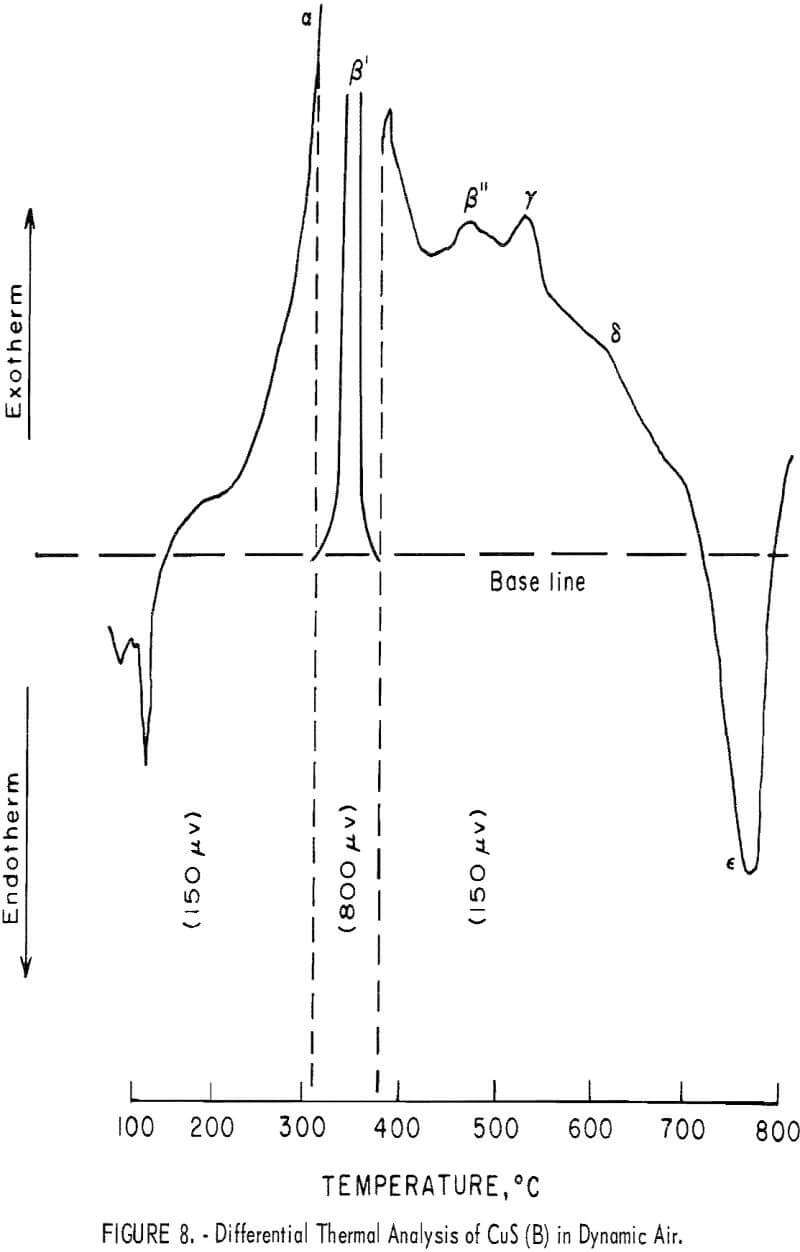
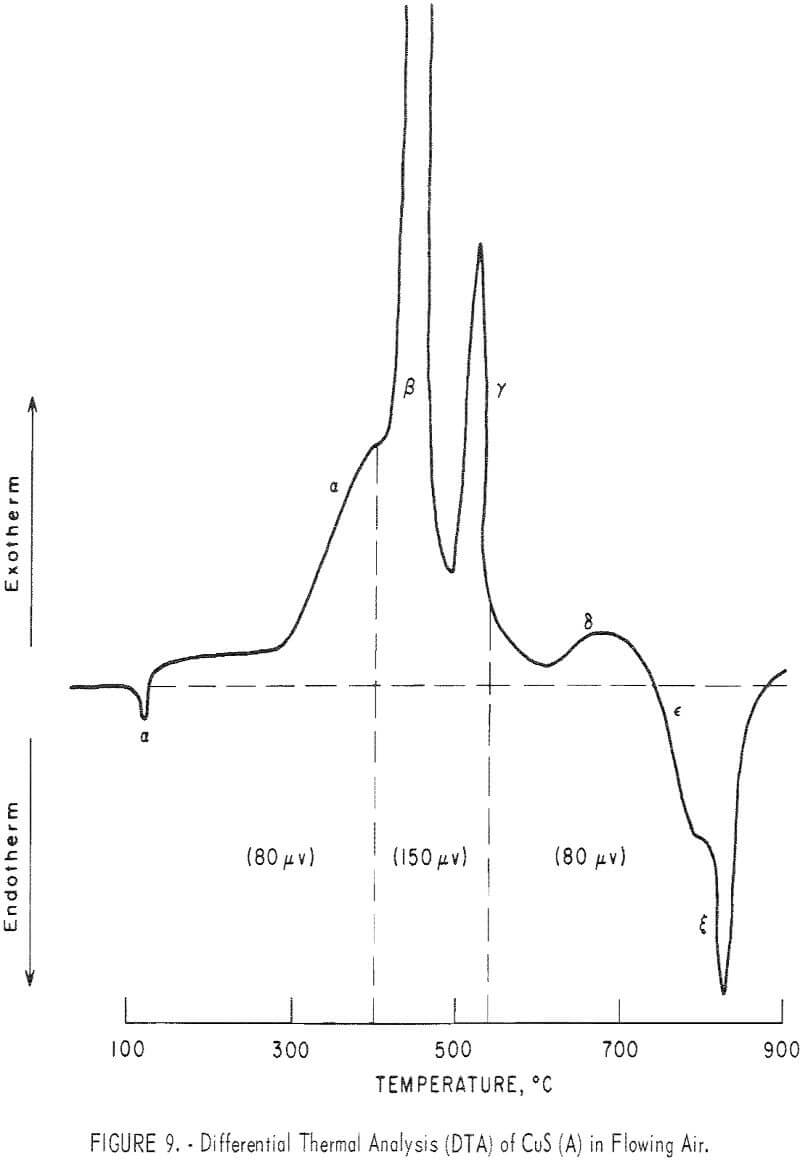
Figure 8 represents a typical DTA thermogram obtained when covellite B was heated at 12° C/min in dynamic air flow at 150 cm³/min in a powder-sample holder. Figure 9 represents a typical DTA thermogram obtained when covellite A, mixed with an equal amount of minus 100-mesh alumina, was heated at 12° C/min in a liquid-sample holder in which flowing air at 300 cm³/min
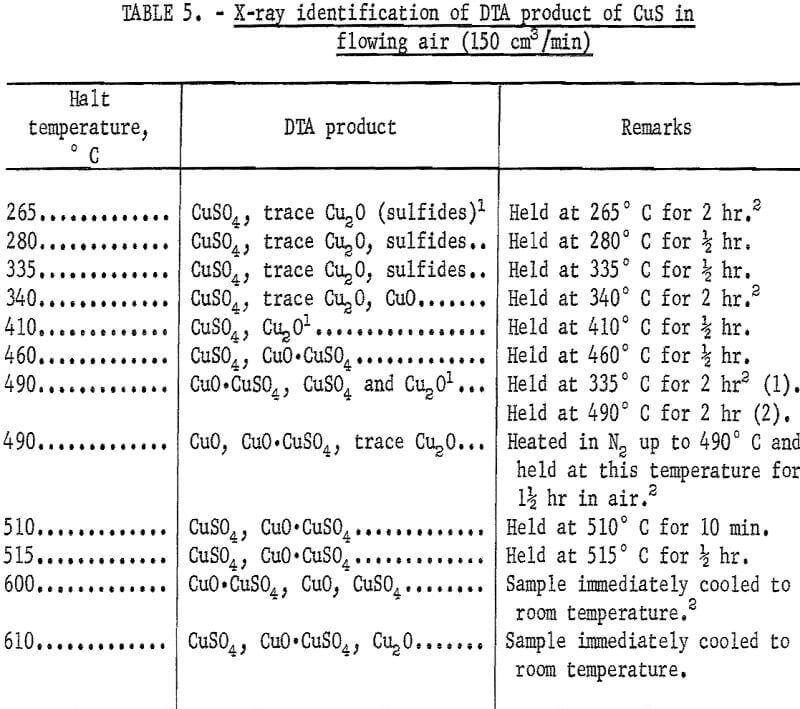
surrounded the sample cups. In order to identify the reactions taking place at various peaks, covellite B was heated to various halt temperatures and the product was cooled to room temperature and analyzed by X-ray diffraction. These results are summarized in table 5.

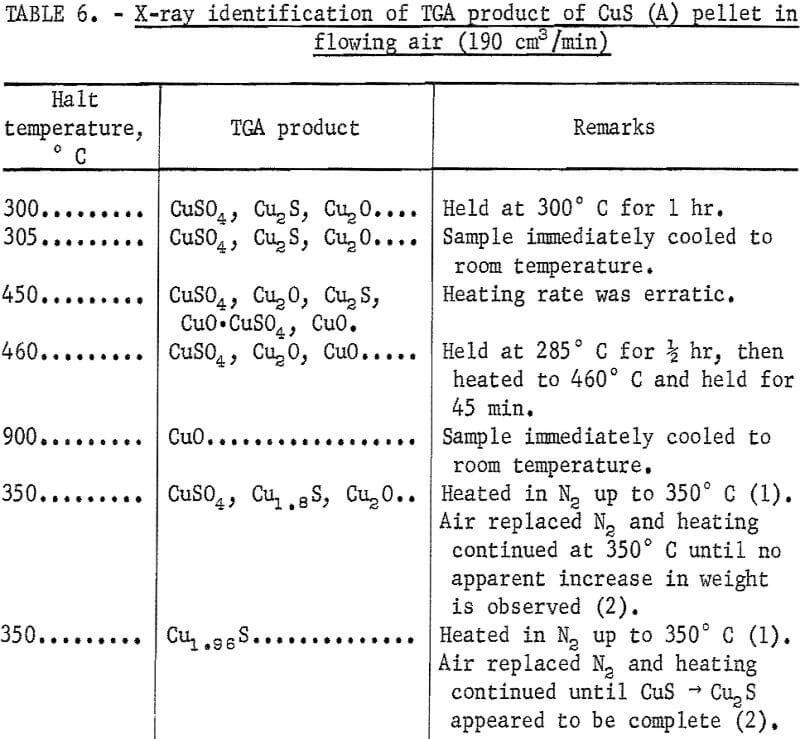
A typical TGA thermogram obtained when pellets made from covellite A were heated at 5° C/min from room temperature to 800° C in flowing air at 190 cm³/min is shown in figure 10. Here the a portion of the curve represents the conversion of CuS to Cu2S. The increase in weight in 3 section is due mainly to the formation of sulfates. Various other TGA runs were made at different halt temperatures under different conditions. The polished cross sections of the heated pellets were examined under microscope, and the products were analyzed by means of X-ray diffraction. Table 6 summarizes the X-ray diffraction analyses of these runs. The X-ray diffraction analyses did not show the presence of CuO·CuSO4 at lower temperatures because of the poor crystallinity of CuO·CuSO4.
In another set of experiments during the kinetic studies, CuS pellets were heated in N2 to 350° C, and air then replaced the N2. The heating was continued until the reaction appeared to have ceased, as indicated by the constant weight in section a of the TGA thermogram in figure 11. A very thin skin of CuSO4 was formed on the outermost surface of the pellet. The inner part of this skin was always orange-colored and was identified as CuO·CuSO4. When the temperature was increased to 485° C, a further increase in weight took place as indicated by section b in figure 11. The microscopic examination of the pellet showed a comparatively larger amount of CuO·CuSO4 under the CuSO4 skin. This new CuO·CuSO4 forms inside the outer sulfate layer. It appears that as the chemical potential of SO3 decreases within the pellet and
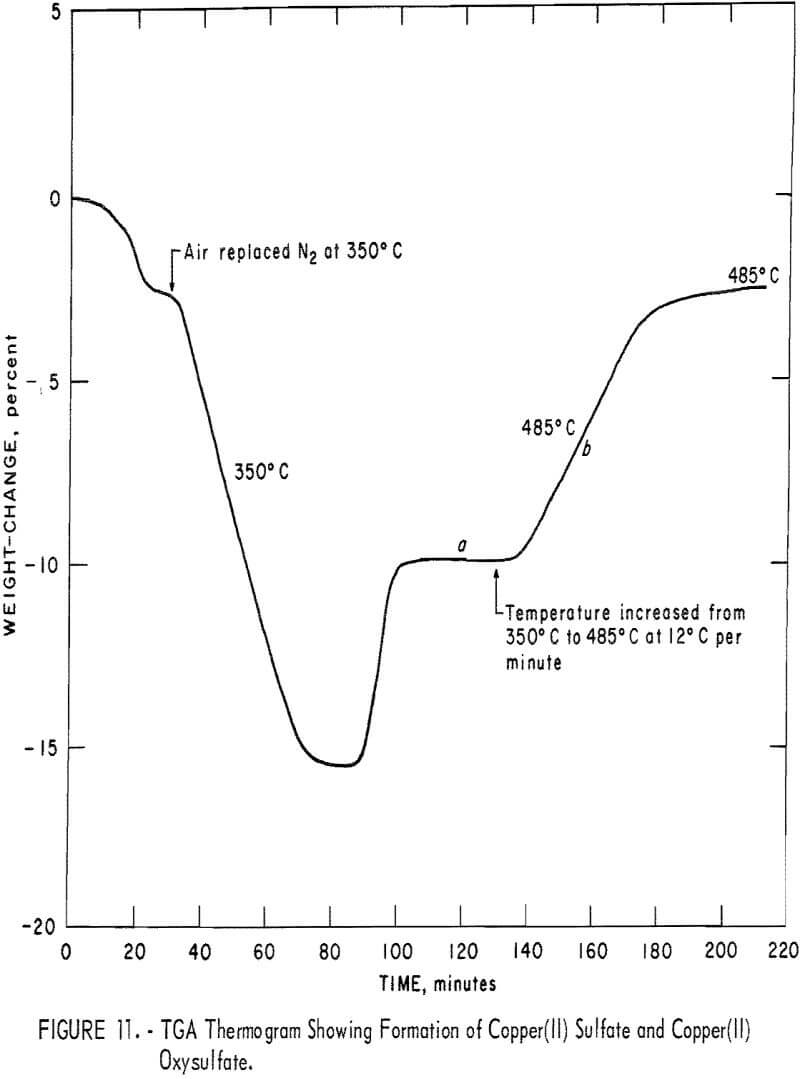
as the temperature rises, CuO·CuSO4 becomes more stable than CuSO4 and the amount of CuO·CuSO4 increases within the CuSO4 skin. Similarly, when the chemical potential of SO3 is further diminished within the pellet, Cu2O formed initially will be converted to CuO under the oxysulfate layer. The presence of CuO at 450° to 460° C, which is well below the decomposition temperature of CuO·CuSO4, has been indicated by X-ray diffraction analyses, the results of which are shown, in table 6. From these results we conclude that CuSO4 is formed from CuS by the following sequence of steps:
CuS → Cu1.8 S → Cu2O → CuO → CuO·CuSO4 → CuSO4…………………………………..(12)
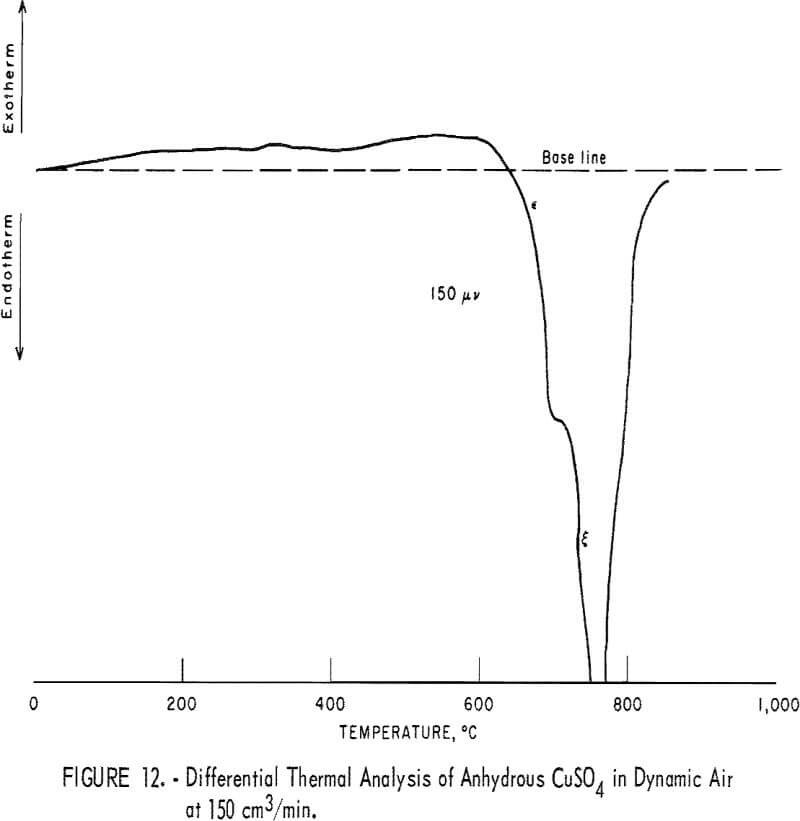
Figure 12 shows the DTA thermogram of CuSO4 powder heated at 12° C/min in a powder-sample holder in dynamic air flow at 150 cm³/min. This figure is comparable with sections ε and δ in figure 8. Figure 12 clearly indicates that at about 600° C, CuSO4 decomposes to CuO·CuSO4 and that at about 670° C, CuO·CuSO4 decomposes to CuO (equations 11 and 12). Furthermore, freshly formed CuSO4 on the CuS pellet starts decomposing at about 490° C.
The various peaks in figures 8 and 9 and the different sections in figure 10 can now be explained as follows with increase or decrease of weight shown by the notation (+Δw) or (-Δw), respectively:
α endotherm: The dehydration of moisture (-Δw).
α exotherm: This transformation can be represented by the following equation:
1.8 CuS + 0.8 O2 → Cu 1.8 S + 0.8 SO2 (-Δw)………………………………………….(13)
β exotherm; This represents the formation of CuSO4 through CuO·CuSO4 as indicated by equation 12 (+Δw).
β’ exotherm: Represents primarily the formation of CuO·CuSO4 as
Cu 1.8S → Cu2O → CuO → CuO·CuSO4 (+Δw)……………………………………….(14)
γ exotherm: This probably represents the formation of Cu2O and CuO·CuSO4, as indicated by equations 4 and 14. Depending upon the extent of formation of CuO·CuSO4 and Cu2O, the change in weight would be positive or negative (±Δw).
δ exotherm: This represents primarily the formation of CuO as
Cu2S → Cu2O → CuO (+Δw)……………………………………………………..(15)
ε endotherm: This represents the decomposition of CuSO4 (equation 10). The partial decomposition of CuSO4 also takes place in γ and δ regions (-Δw).
ζ endotherm: This represents the decomposition of CuO·CuSO4 as indicated by equation 11 (-Δw).
Reaction Sequence in Roasting
Figure 13 represents the individual steps leading to the formation of CuO from CuS, as deduced from the present results and from some of the reported mechanism for the formation of some Cu-S-O compounds.
The following reactions are probably taking place at various interfaces:
0.8 Cu+ + 0.8 e- + CuS → Cu 1.8 S (at interface a)……………………………………..(16)
and Cu 1.8 S → 1.8 Cu+ + 1.8 e- + S (at interface b)…………………………………….(17)
S + O2 → SO2…………………………………………………………………………………………(18)
When covellite is present, Cu+ and e- diffuse through the Cu 1.8 S layer and react with CuS at interface a, according to equation 16; and when covellite is consumed, the following reaction takes place at b:
2 Cu+ + 2 e- + 0.5 O2 → Cu2O………………………………………………..(19)
When digenite is present,
Cu+ + e- + ½O2 → CuO (at interface c)…………………………………………(20)
When digenite is consumed,
Cu2O → CuO + Cu+ + e-……………………………………………….(21)
SO2 + ½ O2 → SO3……………………………………………………..(22)
Cu+ + e- (diffuse through CuO) + ½ O2 → CuO (at interface d)…………………………..(23)
2CuO + SO3 → CuO·CuSO4……………………………………………(24)
and CuO·CuSO4 + SO3 → 2CuSO4 (at interface e)…………………………………..(25)
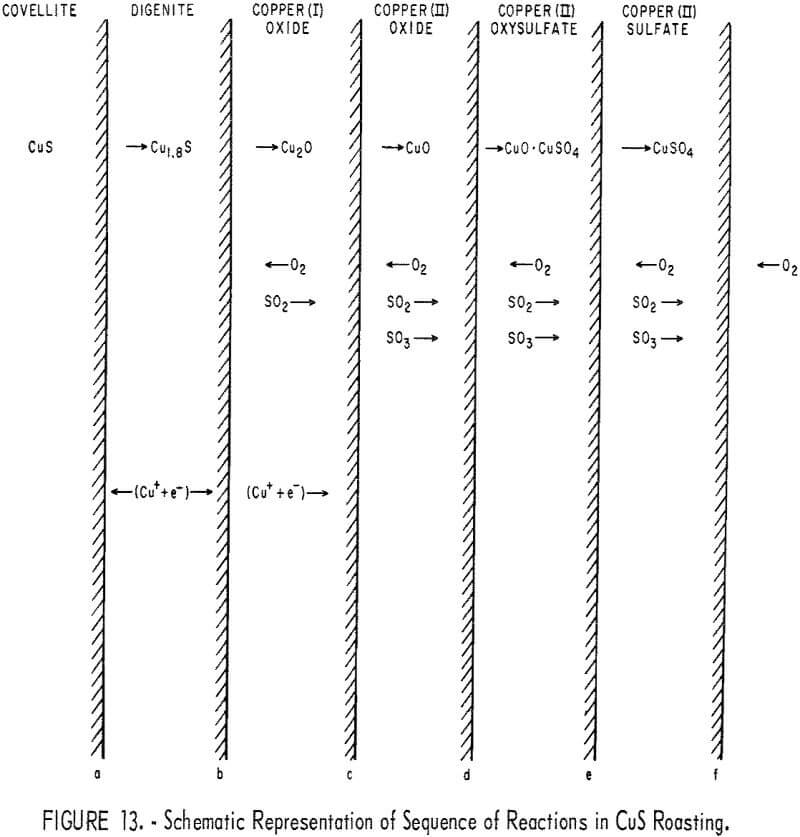
At higher temperatures, first CuSO4 and then CuO·CuSO4 decompose at interface f, as indicated by equations 10 and 11.
Wadsworth and coworkers and Hocking and Alcock have studied the kinetics and mechanism of sulfate formation on copper(I) oxide and have reported the formation of the product layers in the following order:
Cu2O → CuO → CuO·CuSO4 → CuSO4…………………………………………(26)
This sequence is in agreement with the present results wherein CuS was oxidized to CuO.
On the basis of the products observed on quenching, Wadsworth and coworkers and McCabe and Morgan have reported that when Cu2S is roasted, CuO·CuSO4 arises from the thermal decomposition of CuSO4 and the CuO formed arises from the thermal decomposition of sulfates. Accordingly, they suggested the formation of product layers in this order:
Cu2S → Cu 1.8 S → Cu2O → CuSO4 → CuO · CuSO4 → CuO…………………………………………(27)
Their proposal is difficult to reconcile with the thermodynamics of the Cu-S-O system and with the present experimental results. It has been conclusively shown here that CuO·CuSO4 forms under a skin of CuSO4. Ingraham and Marier have shown conclusively that when CuSO4 decomposes, the interface CuSO4/CuO·CuSO4 migrates into the pellet at a uniform rate at constant temperature. Thus CuO·CuSO4, if formed only by thermal decomposition of CuSO4, should form outside the CuSO4 layer. The sequence of chemical reactions taking place during the roasting of CuS in air, as suggested in this paper, is in general agreement with the thermodynamic probability that can be deduced from figures 6 and 7.
Summary
When covellite (CuS) obtained from different sources was heated in N2 and air, various endotherms and exotherms on DTA thermograms and different sections of TGA thermograms were identified with various reactions taking place in the Cu-S-O systems. The order of the principal chemical reactions taking place when CuS is heated in flowing air from room temperature to 800° C was established, and a mechanism for the various reactions taking place during the roasting of CuS pellets was suggested. It has been conclusively established that CuO·CuSO4 forms prior to the formation of CuSO4 during the roasting of CuS.
