Table of Contents
One of the main advantages of this method for estimating impurities in tungsten is that the analysis is performed on the metal. Ideally, samples and standards should be of the same particle size, between 200- and 300-mesh but satisfactory semiquantitative analyses can be made on particles as coarse as 30-mesh. Another advantage is the low limit of detectability achieved for most of the impurity elements.
The volatilization of germanium during the 100-second arcing period minimizes the volatilization of tungsten, and acts as an efficient arc stabilizer and carrier to sweep most of the impurities from the tungsten into the excitation zone of the arc
When extremely finely divided, a very small quantity of tungsten is carried into the arc upon initiation. This action persists for less than 10 seconds and is attributed to ejection of a few fine particles that cling to the upper part of the inside surface of the electrode crater when the sample is tamped into the electrode. The charges occupy a volume approximately equal to one-third the electrode capacity. There is no tendency for particles of 250- mesh or larger to cling to the inside surface, and gentle tapping of the electrode is adequate to settle the charge in the bottom of the electrode crater.
The volatilization characteristics of impurity elements are influenced by differences in chemical and physical constitution of sample charges. Impurities from synthetic mixtures may volatilize at different rates than the same impurities in unknown samples.
Using the described semiquantitative method as a basis, quantitative procedures can be established. In developing such procedures particular attention should be paid to maintenance of sample and standard particle sizes within close tolerances, the use of suitable internal standards, and the volatilization behavior of impurities in standards compared with the behavior in unknown samples.
A spectrographic procedure applicable to the semiquantitative determination of 29 elements in tungsten is presented. The method is designed to give estimates of impurity concentrations up to 500 p.p.m. Limits of detectability range from 0.3 p.p.m. for the more sensitive elements to 100 p.p.m. for the less sensitive ones.
Tungsten metal samples varying in particle size from minus 300- to 30-mesh are excited in the presence of 5 percent germanium with a direct current arc. Germanium acts to stabilize the arc, minimizes the volatilization of tungsten, and serves as an efficient carrier to sweep impurities from the tungsten into the excitation zone.
Curves are presented that show the volatilization behavior of germanium, tungsten, and impurities in tungsten at different concentration levels. Data obtained were used as guides in establishing the method of analysis.
In the absence of established reliable analytical procedures for determining many impurities in tungsten in the parts per million concentration range, the spectrographic method described here should prove to be helpful in evaluating high-purity tungsten.
Introduction
Demands for heat-resistant metals of high purity have increased recently because of applications in missiles, jet aircraft, and space vehicles. Tungsten, with the highest melting point of any metal (3,410° C.), occupies a unique position. Trace quantities of impurities can seriously affect the physical properties of the metal; therefore, there is an increasing need to develop analytical procedures capable of determining accurately minute concentrations of impurities.
Chemical procedures for the determination of impurities in tungsten are time-consuming and usually tedious and complex. No satisfactory chemical methods exist for the determination of some elements in low concentrations.
Several spectrographic methods for the analysis of tungsten have been reported. Most of these involve the analysis of tungstic oxide (WO3), made by ignition of the metal. Lounamaa used the cathode layer technique to determine impurities in tungstic oxide. Lewis and others recently determined 19 impurities in tungsten metal and in tungsten hexachloride. They converted their samples to the oxide and used germanium and lanthanum as internal standards in a direct current arc procedure. Gegechkori has also reported a direct-current arc method for analysis of tungstic oxide. Gentry and Mitchell used a carrier-distillation method with silver chloride as carrier. A pellet-spark method has been used by Veleker and Dyck.
A procedure utilizing high-voltage alternating-current arc excitation for determining aluminum, iron, silicon, calcium, magnesium, and potassium in tungsten metal has been reported by Dyck and Veleker, who report the following advantages to spectrographically analyzing metal instead of oxide: (1) Avoidance of the necessary conversion to oxide with its attendant possibilities for contamination, (2) more efficient suppression of the tungsten spectrum when arced in the presence of graphite, and (3) greater sensitivity of detection for trace impurities. Jaycox has reported a method for the analysis of nickel, in which the advantages of analyzing nickel metal rather than nickel oxide are emphasized.
The method reported here for the semiquantitative analysis of tungsten metal is in the nature of a progress report. Details are presented as developed and used successfully at the Bureau of Mines College Park Metallurgy Research Center, College Park, Md. Later reports will deal with the quantitative determination of specific impurity elements in tungsten.
Scope and Outline of Method
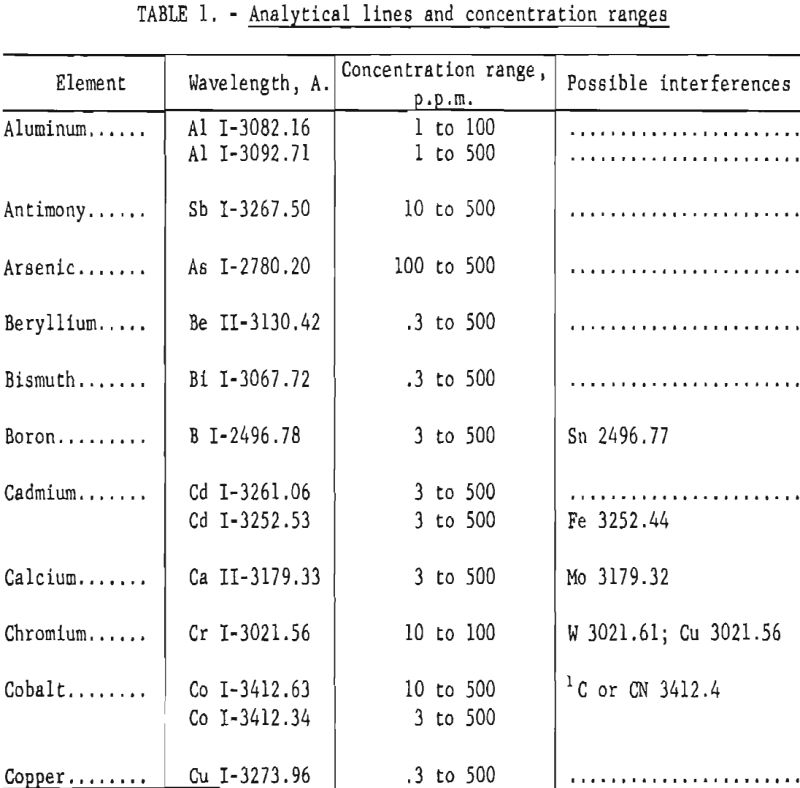
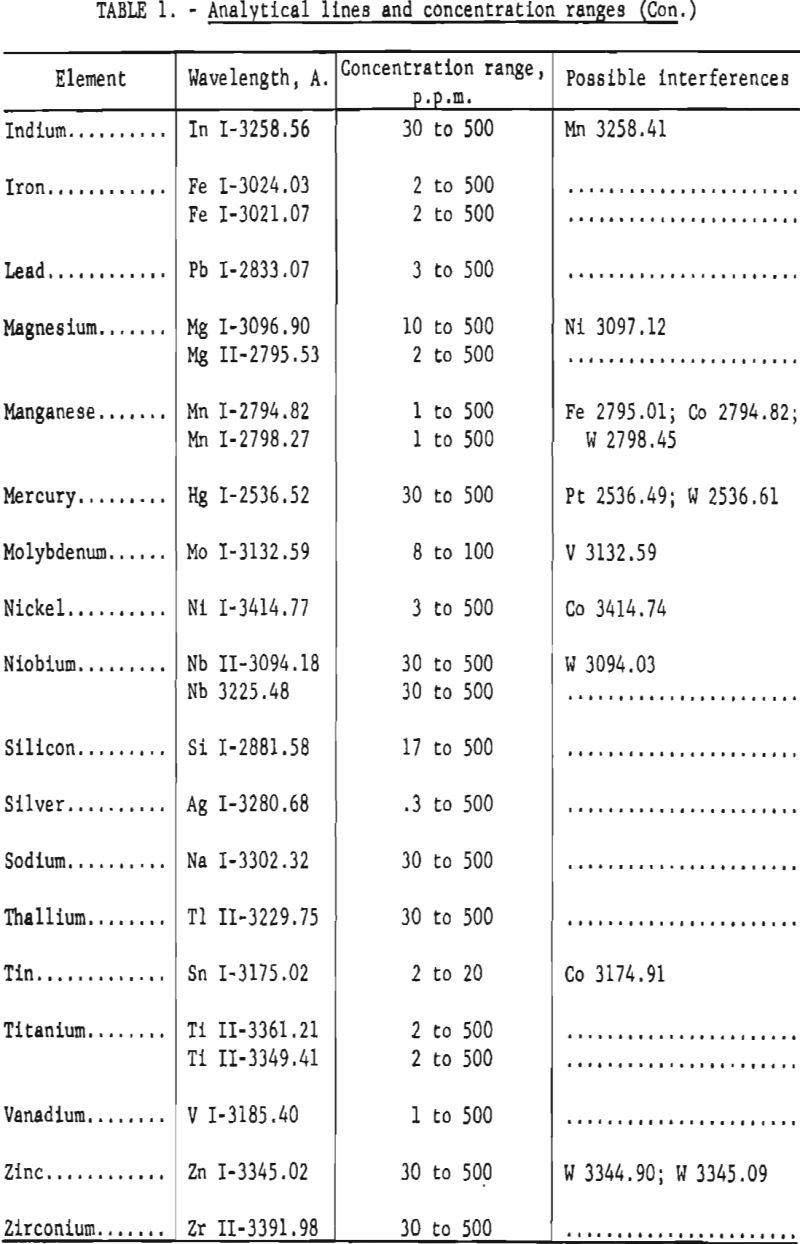
The method is applicable for the semiquantitative determination of 29 impurity elements in tungsten metal. The particle size of samples may vary from minus 300-mesh to approximately 30-mesh. A direct-current arc procedure is employed, using graphite electrodes and high-purity germanium metal as a carrier. Concentrations are estimated visually by comparing sample spectra with spectra of standard samples. As an alternate procedure for a limited number of elements, transmittances of the analytical lines are measured with a microphotometer and converted to intensity values. Concentrations are obtained by reference to analytical curves previously prepared from standard samples. The elements determined, wavelengths of lines used, and concentration ranges, in parts per million, are listed in table 1.
Equipment
Excitation is obtained from a commercially available source unit that provides wave rectified direct current up to 30 amperes. Open circuit voltage is 300 volts, and current is controlled by means of a motorized reactor. The spectrograph, also commercially available, contains two gratings, from which spectra are photographed simultaneously in the second order to obtain continuous wavelength coverage from 2450 to 3400 angstroms. Reciprocal linear dispersion is approximately 1.9 angstroms per millimeter for spectra obtained from each grating. A recording type comparator-microphotometer is used to measure transmittances of the spectral lines or to make visual estimates of concentration. High-purity 3/16-inch diameter graphite electrodes are used. The sample-carrying electrode (anode) is 1-½ inches long with undercut cup 1/8 inch in inside diameter and 3/16 inch deep. The upper electrode (cathode) is 1-½ inches long with a hemispherical tip. The spectrograph is illuminated in such a way that the resulting spectral lines represent radiant energy from the entire arc column except the light from the incandescent electrode tips, which is screened out.
Experimental
Effect of Germanium Added to Tungsten
The refractory nature of tungsten carbides formed when tungsten is arced in graphite electrodes precludes the application of a spectrographic procedure in which a weighed charge is arced to completion. In an attempt to circumvent this difficulty, high-purity germanium metal was incorporated with the tungsten and acts as a carrier to sweep the impurities from tungsten into the excitation zone of the arc. This is a modification of the carrier-distillation technique reported by Scribner and Mullin for the analysis of uranium oxide. In addition to its action as carrier, germanium produces a smooth burning arc compared with the erratic sputtering obtained with tungsten alone.
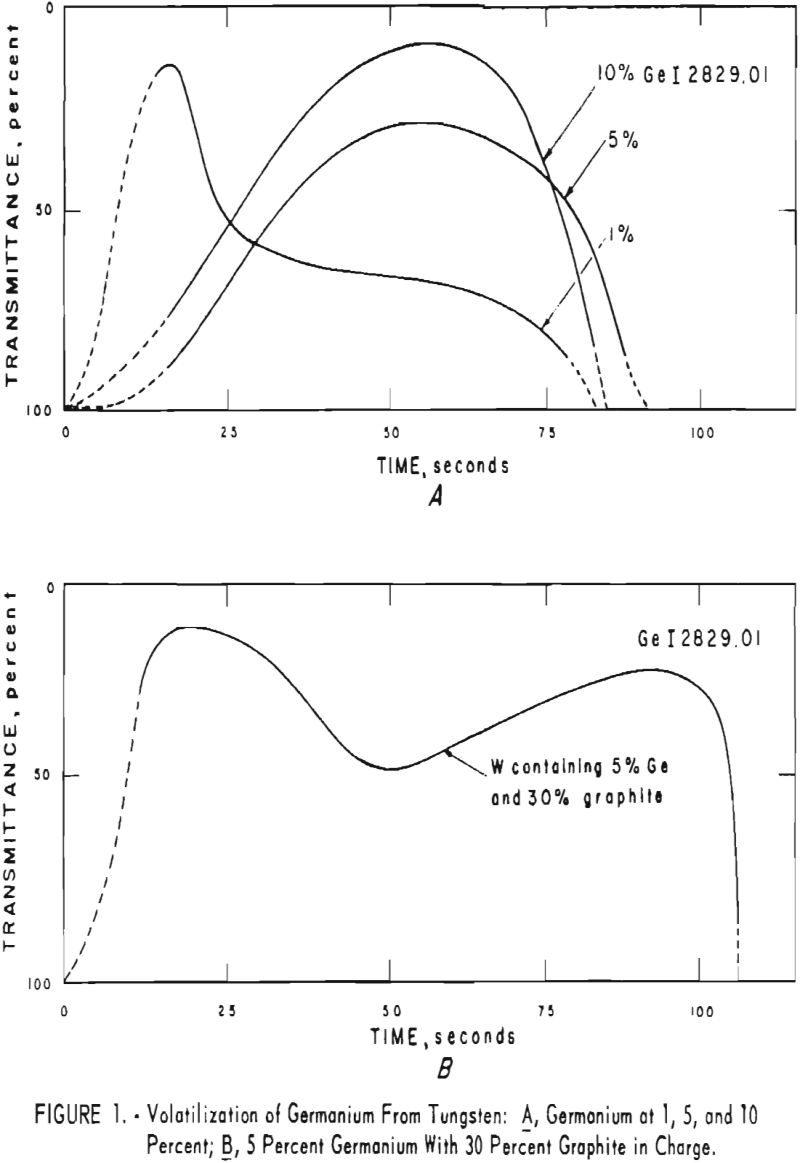
Germanium concentrates of 1, 5, and 10 percent of the weight of tungsten were tried. The total weight of charge in each case was 80 milligrams. The choice of 5 percent germanium represents a compromise that produces a smooth burning arc, effective carrier action within a reasonable arcing period, a minimum of background due to GeO bands, and a sparsity of tungsten lines.
Volatilization Studies
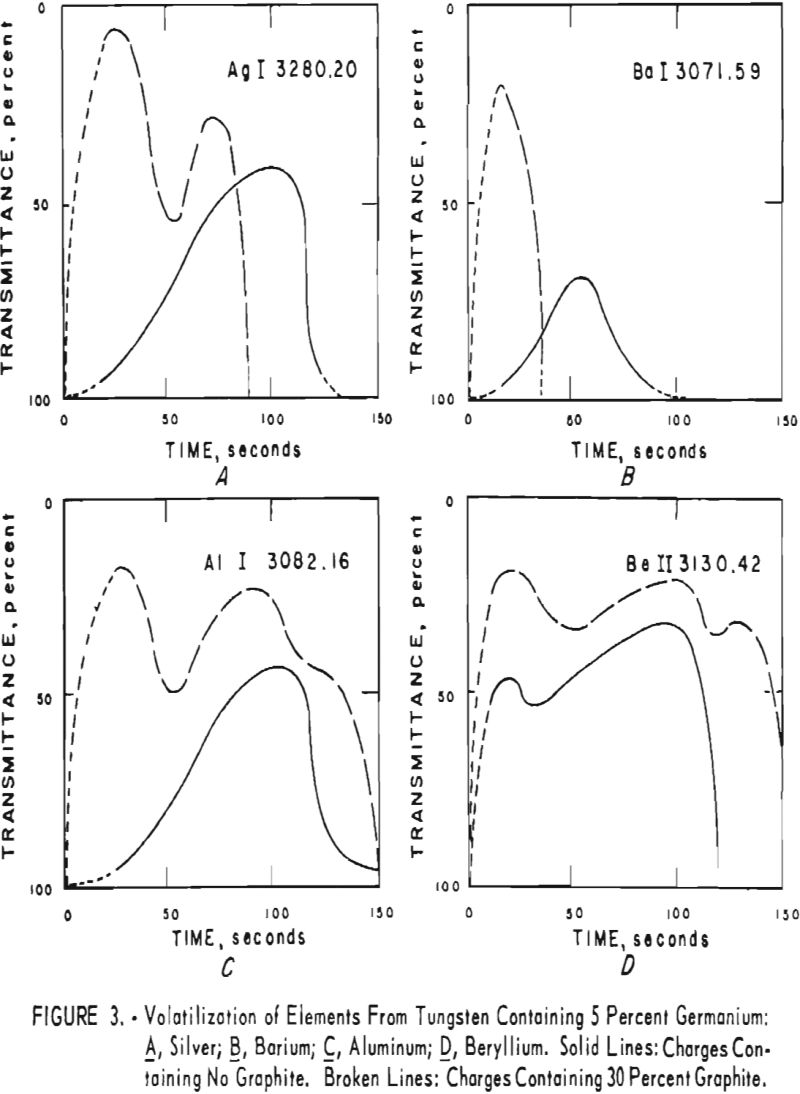
A series of moving plates was made in order to study the volatilization behavior of tungsten, germanium, and several impurity elements in tungsten. Data obtained are plotted as percent transmittance of a selected spectral line versus time in seconds. Figure 1, A shows curves for germanium at 1, 5, and 10 percent in tungsten. Figure 1, B shows the effect of graphite powder on the volatilization of 5 percent germanium.
To obtain information on the volatilization of impurities in tungsten, moving plates were made, using tungsten metal with known concentrations of impurities. These samples were prepared from high-purity tungsten powder by
adding known quantities of impurity elements as oxides. To obtain data on the effect of graphite powder in the charges also, the moving plates were prepared, using three compositions of charge in the electrode: (1) Tungsten containing 5 percent germanium, (2) tungsten containing 5 percent germanium and 30 percent graphite powder, and (3) tungsten with 30 percent graphite. Figure 2 shows the volatilization behavior of tungsten in the presence of 30 percent graphite and 5 percent germanium compared with the behavior in the presence of 5 percent
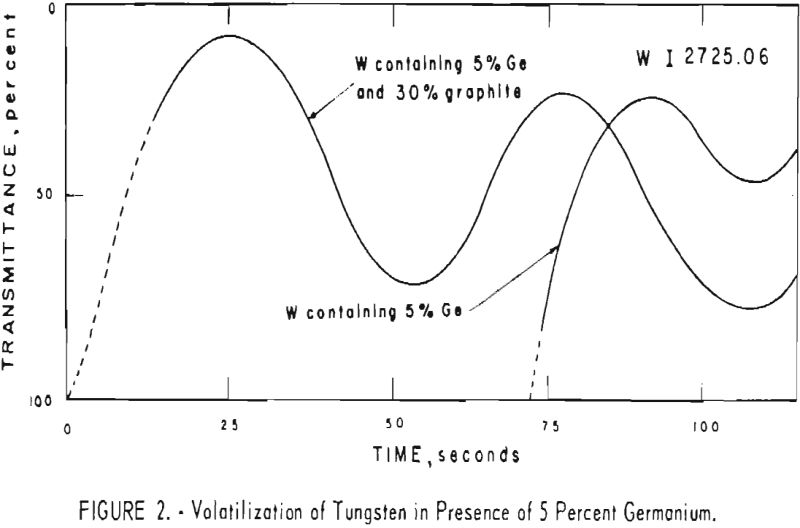
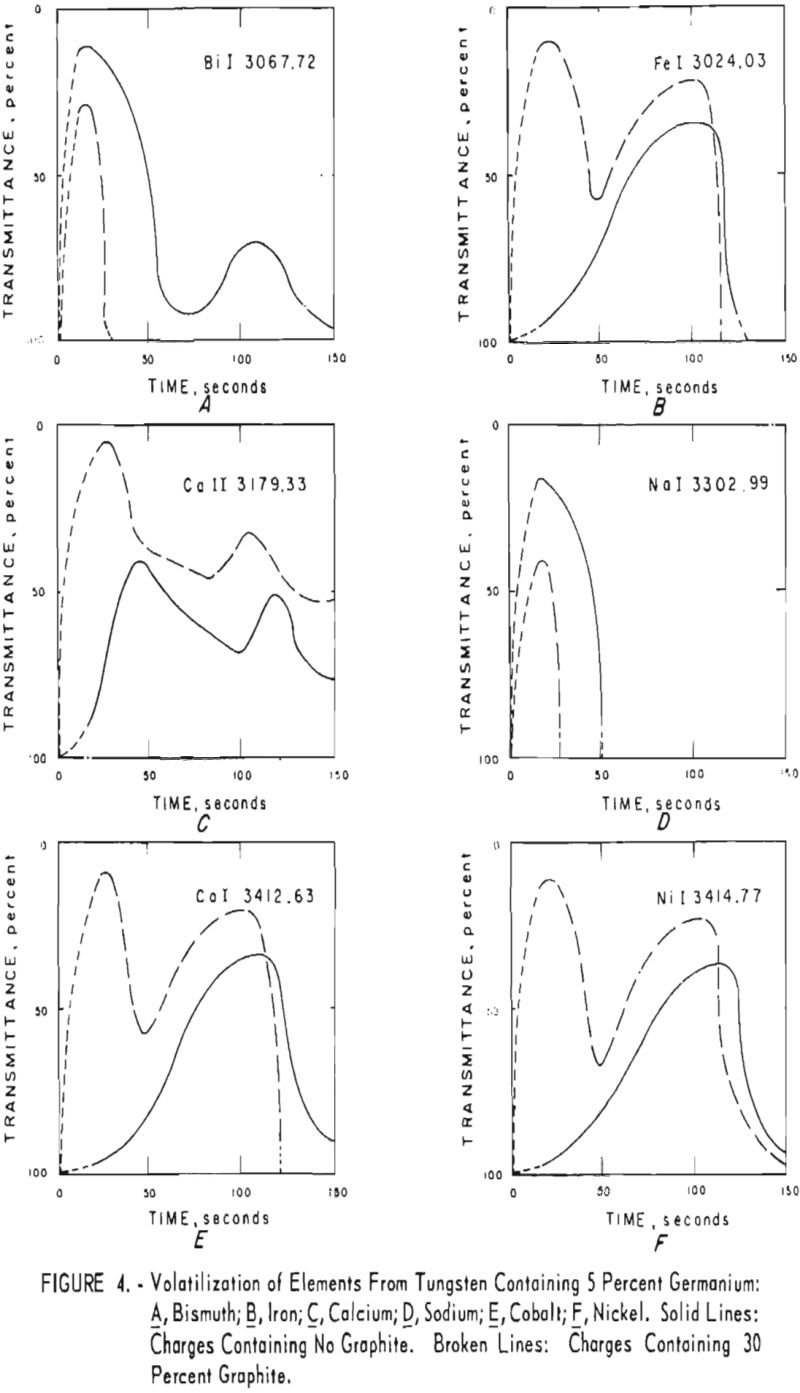
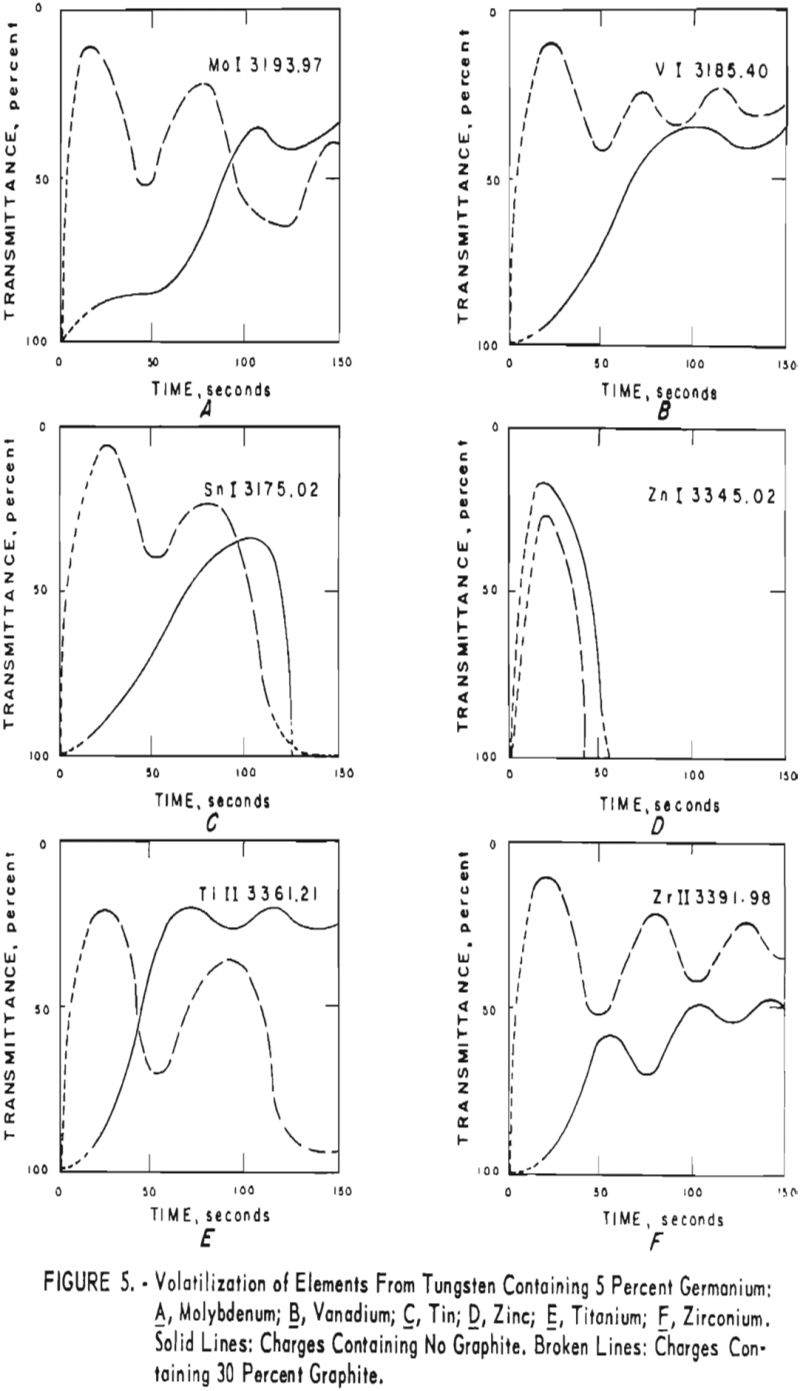
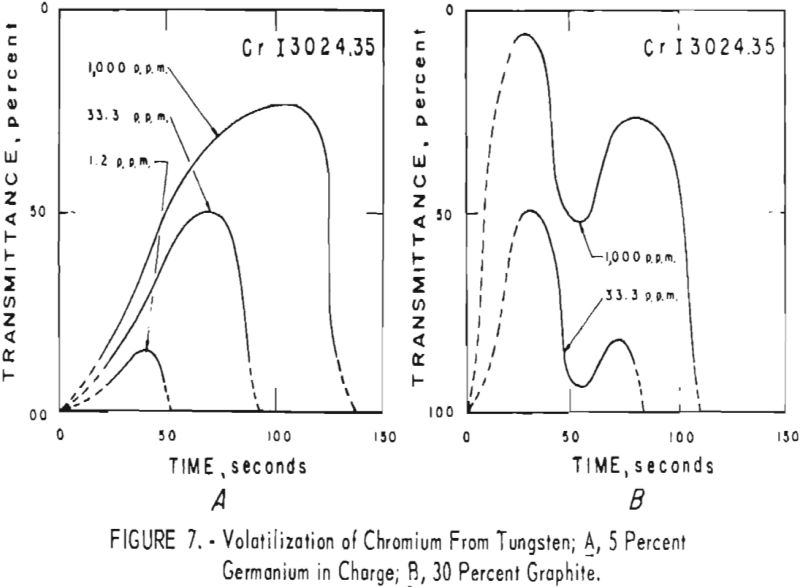
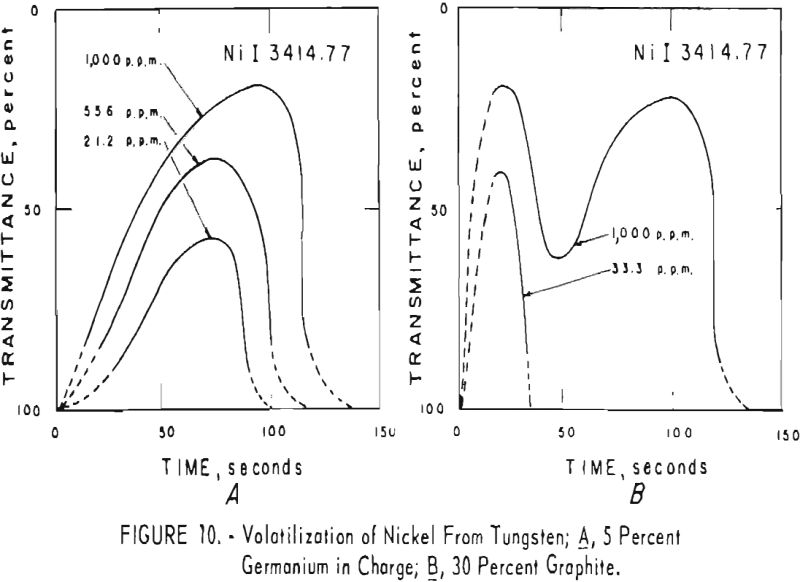
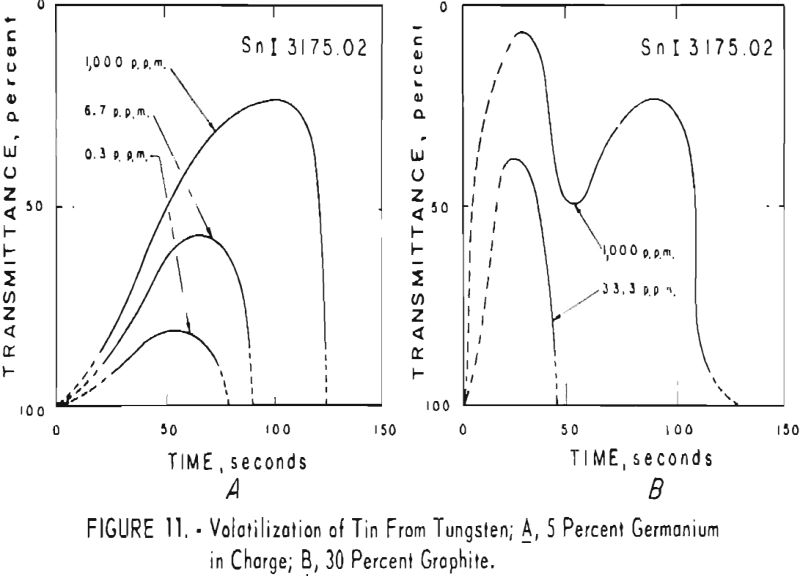
germanium alone. Figures 3 through 5 show curves for 16 elements at 1,000 p.p.m. concentration. Five percent germanium was used in all cases; the dotted curves are for charges containing graphite; solid curves arc for charges without graphite. Figures 6 through 11 show the volatilization behavior of six elements at various concentration levels in the presence of 5 percent germanium and in the presence of 30 percent graphite.
Significant conclusions can be drawn from the volatilization studies. (1) Germanium volatilizes at a slower and steadier rate with added graphite. However, for most of the impurity elements tested, germanium acts more efficiently as a carrier in the absence of added graphite. (2) In the presence of 5 percent germanium, the intensity of tungsten is at a minimum from the beginning of arcing up to 80 seconds. Peak Intensities of most impurity lines at concentrations of less than 1,000 p.p.m. occur when the intensity of tungsten is at a minimum. In the presence of graphite, the volatilization of tungsten is much more erratic with intensity peaks occurring at 30 and at 80 seconds. (3) The peak intensities of emission of the impurity elements in tungsten occur earlier during the arcing period in the presence of added graphite. (4) The curves for decreasing impurity concentrations are displaced to the left, and in general the peak intensities for decreasing concentrations occur earlier. (5) For the elements titanium, molybdenum, zirconium and vanadium, high intensities persist after 150 seconds or arcing.
Moving plates were used also to determine the optimum weight of charge and electrode type. Charge weights varying from 25 to 150 milligrams were tried. The 80-milligram charge in a 105-D electrode were optimum in terms of sensitivity of detection for the trace impurities, practical sample size, and arcing time required to volatilize the germanium.
X-Ray Analyses of Charges
Sample charges, which had been arced for 15, 48, 90, and 240 seconds, were submitted for X-ray diffraction analyses. This was done for tungsten-5 percent germanium charges and for tungsten-graphite charges. The final products after 90 and 240 seconds of arcing were the same for both types. The major constituent was αW2C with minor amounts of WC. When charges containing germanium were arced for 15 and 48 seconds, large amounts of tungsten were

detected with smaller amounts of αW2C and WC. No tungsten was found in charges arced for 90 and 240 seconds. No tungsten-germanium compounds were detected in any of the charges.
When tungsten-graphite charges were arced for 15 seconds, WC predominated with lesser amounts of αW2C and a small quantity of tungsten; after 48 seconds
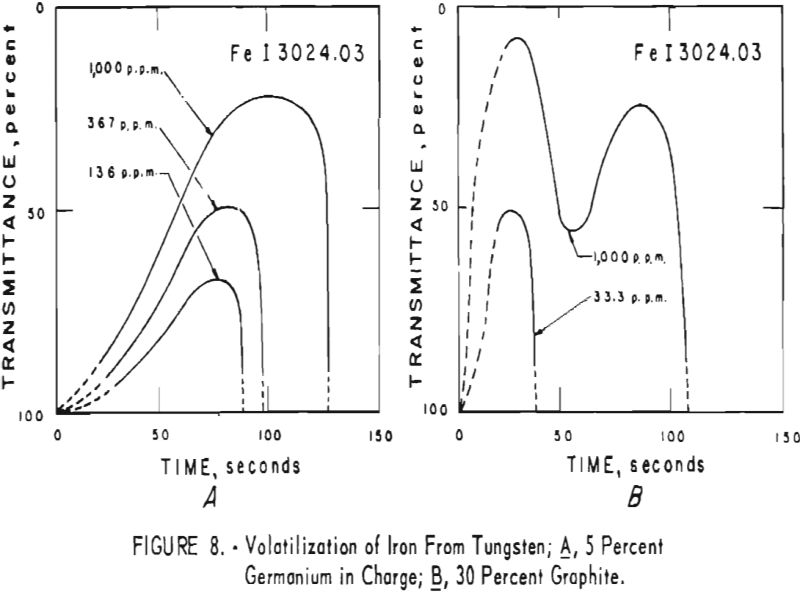
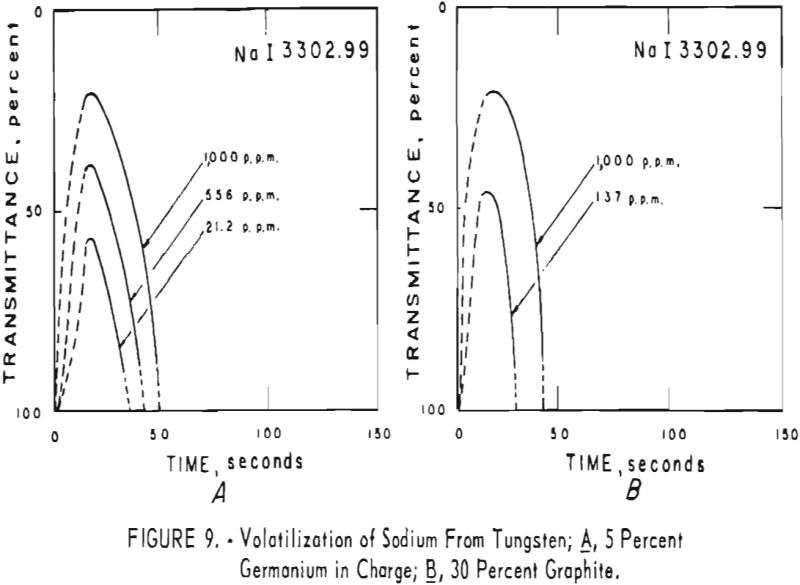
the products were the same except that no tungsten was found. A possible correlation is indicated between the formation of αW2C in charges that contain graphite and the dips in the volatilization curves for impurities in charges that contain graphite. The dips in the curves occur after approximately 50 seconds of arcing for 11 elements; they do not occur in the curves of the tungsten-germanium charges.
Details of the Method
Preparation of Standards and Samples
Prepare synthetic standard samples using high-purity tungsten powder as a base material. Add high-purity oxides of the impurity elements likely to be found in tungsten to the base and mix in plastic vials on a Crescent Wig-L-B-ug mixer. Make several series of standards by successive dilutions to cover the concentration range from 500 to 0.33 p.p.m. It is recommended that each standard series contain not more than seven impurity elements to avoid spectral line coincidences.
Reduce samples that are in the form of small, brittle crystals to minus 100-mesh by grinding in plastic. Obtain small turnings or drillings from solid samples using tungsten carbide tools. Grind to minus 200-mesh in plastic on a mixer-mill, polycrystalline, high-purity germanium metal with stated purity greater than 99.99 percent.
Procedure
Mix 380 milligrams of each standard with 20 milligrams of germanium in plastic vials using the Wig-L-Bug mixer. Place 80 milligrams of the mixture in a graphite anode. Make five exposures of each standard using the excitation, exposure and developing conditions listed in the next section. Calibrate the photographic emulsion by one of the methods in the Recommended Practices for Photographic Photometry in Spectrochemical Analysis (ASTM Designation: E 116). Measure the transmittance of the lines listed in table 1 with a microphotometer and prepare analytical curves by plotting, as ordinate, the logarithm of the concentration of the impurity element versus the logarithm of the intensity as abscissa. Take averages of the five intensity values to determine each point on the analytical curve. If estimates are made visually, take at least three exposures of each standard. In this case omit the emulsion calibration and the preparation of analytical curves. Prepare unknown samples for analysis in the same manner as prescribed in the preceding section.
When samples are too coarse to be mixed on the Wig-L-Bug (larger than 60-mesh), weigh 76 milligrams of sample and 4 milligrams of germanium. Mix with a clean toothpick on the balance pan or on paper and transfer to the graphite anode. Expose the samples in triplicate. Calibrate the emulsion in the same manner as described for the standards. Measure the transmittances of the analytical lines, convert to intensity values and determine concentrations from the previously prepared analytical curves. Alternatively, make estimates by visual comparison with spectra of the graded series of standards.
Operating Conditions
Excitation – direct current arc, 15 amperes.
Electrodes – United Carbon Products Co. No’s. 105-D, 105-U.
Spectral region – 2450 to 3425 angstroms.
Slit width – .010 millimeters.
Slit length – 4.0 millimeters.
Step filter – 3-step, 6-, 25-, 100-percent transmittance.
Pre-arc – none.
Exposure -1 00 seconds.
Emulsion – Eastman Spectrum Analysis No. 1 Plates,
Development – Eastman DK-50, diluted 1:1, 5 minutes, 70° F.
Stop bath and hardener – Potassium chrome alum, 10-percent solution for 30 seconds,
Fixing – Eastman acid fixing powder solution for 2 minutes.
Washing – Running water for 5 minutes, rinsed in distilled water.
Drying – Blower and heater.
Emulsion calibration – Iron arc, 2-step filter method.
Results of Analyses
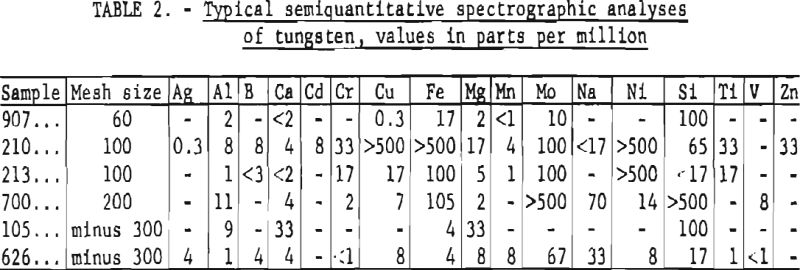
Results obtained using the described method are reported as parts per million. A “less than” value is reported when an impurity is detected at a concentration below the lower limit for reporting a reliable semiquantitative value. Qualitative limits of detectability are slightly less than the lower values listed in the concentration range column of table 1. Typical results for six samples are listed in table 2.
To obtain some information regarding repeatability on samples of varying mesh size, one sample of coarse material was crushed and screened to obtain four samples of approximately 30-, 65-, 100-, and 200-mesh. Coefficients of variation calculated for each size fraction for aluminum and molybdenum are reported in table 3.
Limited data are available to indicate the accuracy of this method. Analyses of five samples of minus 300-mesh tungsten powder are given in table 4 together with analyses furnished by the suppliers.
The accuracy of the method depends upon the reliability of the standards. Standards and samples ideally should be of the same particle size and should be homogeneous. Residual impurities in the base material used for standards often establishes a lower limit for common impurities below which values cannot be determined reliably. This accounts for many of the “less than” values reported.
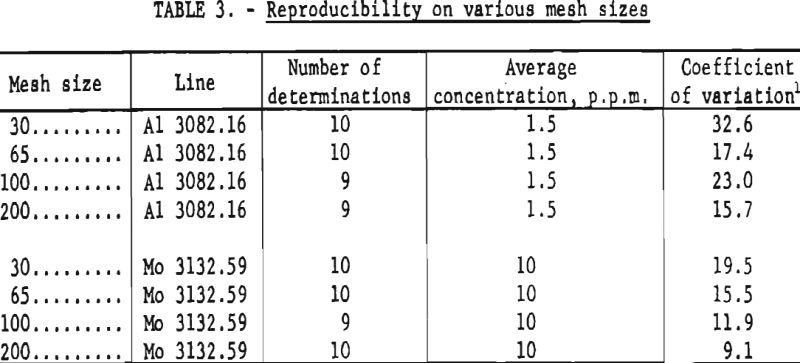

where: x = average concentration in parts per million.
d = difference of the determination from the mean,
n = number of determinations.
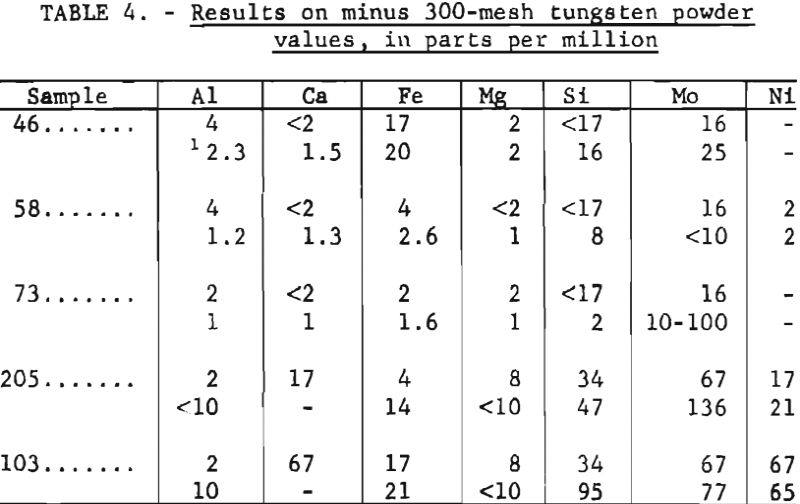
The analyses shown in table 2 were determined for some elements by visual comparison with standards; for others analytical curves were used. The visual estimates are repeatable within one-half to two times the reported figure when values are obtained from triplicate exposures. Somewhat better reproducibility can be expected when analytical curves are used. Data shown in table 3 were obtained from analytical curves. As indicated from the coefficients of variation, the precision is greater for the finer particle sizes. The data presented in table 4 show good agreement between the analyses furnished by the suppliers and those obtained by the described methods. This is undoubtedly due in part to the similar particle sizes used for standards and samples.
