The object of the present paper is to call attention briefly to a novel method of analyzing the action of the ordinary gravity stamp, which has not only thrown much light upon the exact motion of the stamp-head, but promises also to be of value in determining the efficiency of a new mill before setting it to its work of crushing, and in this respect should be of service to constructors of mining machinery as well as to mining engineers. The method was devised by Mr. D. B. Morison, and developed in connection with his experiments on the comparative crushing-effects of his patent high-speed stamp and the ordinary cam-stamp, which were carried out at the works of Messrs. L. Richardson & Sons, Engineers. Mr. Morison’s experiments were of a very exhaustive nature; and having been consulted by him during his investigations, I had frequent opportunities of examining the methods employed and the results obtained.
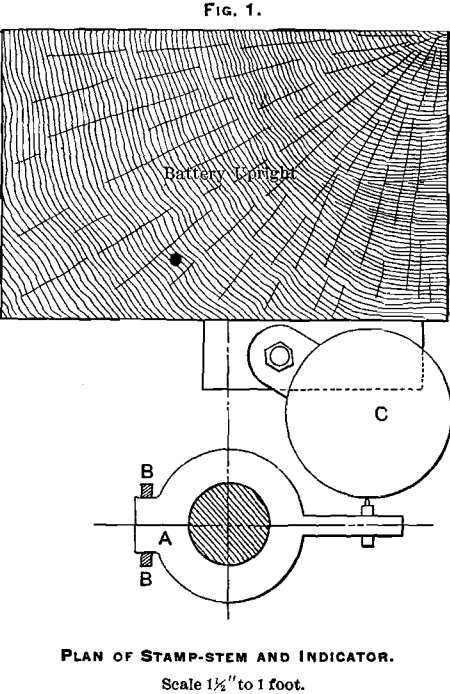
Experiments were first made with an apparatus resembling the indicator of a steam-engine, inasmuch as the drum revolved alternately backwards and forwards, thus producing a closed diagram. This form was not found satisfactory, and it was therefore altered so as to cause the drum to revolve continuously in one direction, thus giving a continuous or open diagram. The arrangement is shown in plan in Fig. 1; a collar, A, surrounds the stamp-stem loosely and works between the guides B, B, which constrain it to move in a vertical line only. Immediately above it and below it, a couple of collars are clamped to the stamp-stem, so that the latter, while free to revolve, communicates its vertical motion to the piece A. From A an arm projects, carrying a pencil that presses against the drum C, 7 inches in diameter, driven at a uniform rate by a cord off the cam-shaft. The relation between the vertical movement of the stamp and the rotation of the cam-shaft was thus obtained graphically, while the latter uniform motion was readily expressed in terms of time by noting the rate of revolution, which was carefully kept unaltered during each test, the speed being the average recorded by three independent observers.
The degree of accuracy thus attainable with ordinary care is quite sufficient for all practical purposes.
The stamp employed was the ordinary pattern, manufactured by the Sandycroft Foundry Company, Hawarden, England, its chief dimensions being as follows: Diameter of stem, 3¼ inches; length, 13 feet; total weight of stamp, 900 pounds; distance from center of cam-shaft to center of stamp-stem, 5 inches; diameter of cam (toe to toe), 20 inches; depth of top and bottom guides, 14 inches each.
The nature of the results obtained is shown by means of the
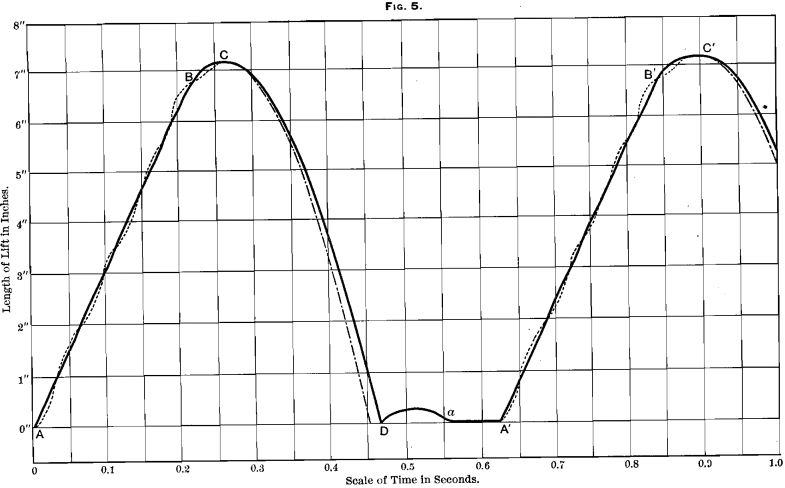
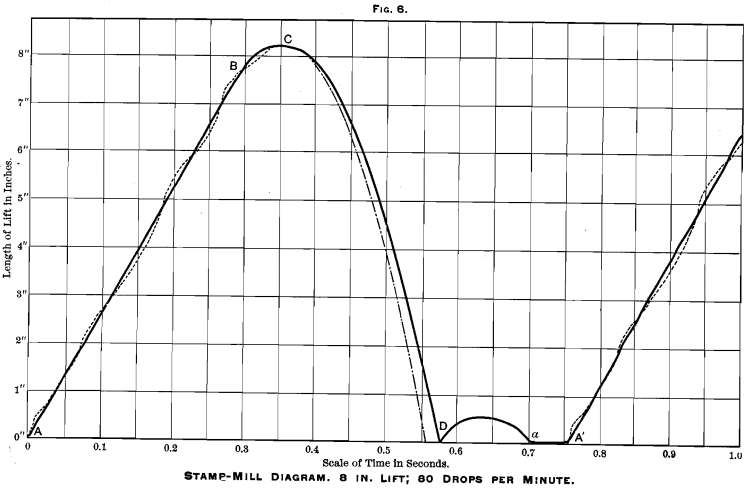
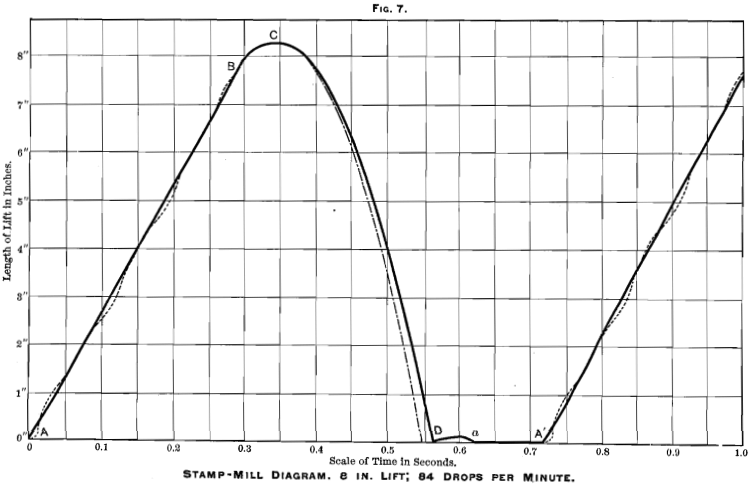
subjoined diagrams, Figs. 3 to 8, which are a few of the extensive series taken by Mr. Morison. They may be divided into two sets, the first taken when the stamps were set with a dead lift of 6.5 inches, the second with a dead lift of 8 inches, and their speeds were as follows :

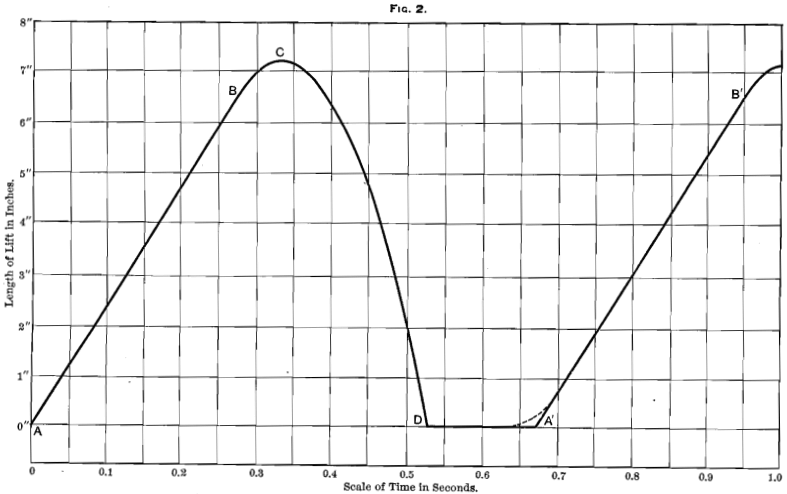
In order to explain more readily the meaning of these diagrams, I have drawn in Fig. 2 an ideal stamp-mill diagram, or the diagram that would be obtained from a stamp-mill working in vacuo absolutely without friction, either of the stem against the guides, etc., or of the shoe against the pulp in the battery- box, and assuming that the whole of the momentum of the crushing-head is instantaneously converted into crushing-effect, so that it strikes quite dead and produces no rebound of the stamp at all—conditions which, it need hardly be said, can never obtain in practice. I have assumed that the distance from the center of the cam-shaft to that of the stamp-stem (the radius of the generating circle of the cam) is 5 inches, that the lift of the cam is 7 inches, and that the stamp is making 90 drops per minute.
The time of one complete lift + drop is therefore 60 ÷ 90 = 0.667 second. The time of the lift is 7/5π x 60/90 = 0.297 second.
As the height of the lift is 7 inches, the speed of the lift is at the rate of 1.96 feet per second. Starting, therefore, at the moment when the cam is just about to engage with the tappet at A on the diagram, the uniform velocity produced by a properly designed cam is shown by the straight line A B. It is usual with most makers of stamp-mills to flatten the curve of the toe of the cam so that the stamp shall not leave the cam at too high a speed, and this flattening should extend to the last half-inch of the lift of the cam, and should be such as to correspond to the velocity with which the stamp would con-
tinue to move if under the influence only of the velocity imparted to it by the cam and of gravity. In all ordinary mills friction comes into play, but in our ideal cam-curve this force
is to be neglected. Hence, after the stamp has risen from A to B, or has completed 6.5 inches of its lift, its uniform rate of motion becomes modified by the action of gravity, just as though the cam had lifted it through 6.5 inches only instead of 7 inches. At B the stamp was moving at the rate of 1.96 feet per second, and will therefore continue to rise for 1.96/32.2 = 0.0608 second, during which it will rise to a height of 0.0595 foot or 0.714 inch. From these data it is easy to set out C, or the point where the stamp comes to rest and commences to fall, and C D can then be drawn as an ordinary gravity-curve corresponding to a period of 0.194 second, D being the point of time at which the stamp strikes the layer of stone upon the die; it then continues at rest until 0.667 second from the commencement of its lift has elapsed, or for a time equal to 0.667 — (0.276 + 0.061 + 0.194) = 0.136 second. At the end of this period, at A’, the cam once more touches the tappet and a second lift commences. Some makers alter the shape of the base of the cam-curve, so as to make the cam engage the tappet more gradually, in which case the dotted line shown will more correctly represent the diagram of the lift. This precaution is advisable more especially when the stamp is to work at a high rate of speed.
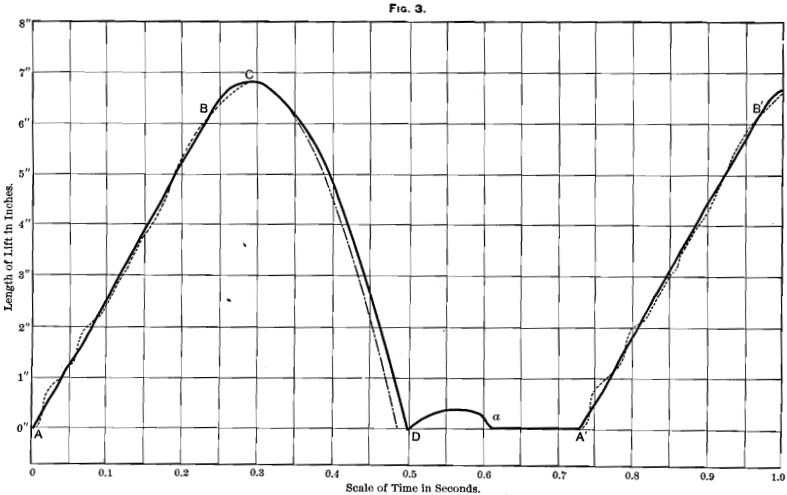
Turning now to the actual diagrams taken, it is interesting to note the differences between them and the ideal diagram. In Fig. 3, the line of lift commences at A (the same letters are used throughout to represent similar parts of each diagram) and continues to B, giving apparently an actual lift at uniform speed to a height of 6 1/8 inches. Of course, in the real stamp, the toe of the earn is doing work, because, when correctly designed, it is engaged in overcoming the friction of the stem against the guides, etc.; it should not force the stamp up any more rapidly than it would move if under the influence of gravity alone, as in Fig. 2; nor, on the other hand, should it allow the effect of friction to diminish its velocity to any greater extent than is there indicated. It will be noticed that the line A B is not exactly straight, but shows a certain amount of waviness. This is due, either to small imperfections in the shape of the cam, or to vibration of the mill-framing. The dotted line in Fig. 3 and the subsequent figures shows the actual diagram obtained, the full line being obtained by “ smoothing ” the undulations. The stamp continues to rise by reason of its acquired velocity up to C, a height of 6.85 inches, and then falls again. The theoretical gravity curve of a body fall-
ing without any retardation from friction has been plotted on the same diagram for the purpose of comparison, and it will be seen that the stamp falls more slowly by an amount equal to
about 0.015 second. The theoretical time of falling from a height of 6.85 inches would be 0.19 second, and the velocity at the end of that time would be 6.1 feet per second. The actual velocity, as shown in the diagram, is only about 5.2 feet per second. As it is the momentum of the stamp that determines its crushing-capacity, this determination of its final velocity is a matter of some importance, and as the velocity here obtained would be attained by a frictionless body in falling from a height of 5.05 inches only, the amount of power wasted by friction of all kinds amounts in this particular case to 26 per cent, of that exerted in lifting the stamp. An examination of the curves will show the reason why the loss of power is so great. At the commencement of the fall the actual diagram-curve and the theoretical gravity-curve practically coincide, the difference between them being more marked as the fall proceeds and as the velocity of the stamp increases. This result is in accordance with the well-known law that the retarding effect of friction increases more rapidly than the velocity, or approximately as the square of the velocity.
On reaching D it will be noticed that the stamp descends slightly, but only very slightly, below the zero-line, owing to the compression of the material lying on the dies, or of that of the stamp itself, or of the die, mortar-box and foundations. Immediately recovering, it at once rebounds at a comparatively slow speed to a height of 0.36 inch, and then falls again to its normal position at a, continuing at rest until a fresh lift begins once again at A’. The distance from D to A’ corresponds with the interval of rest of the normal diagram, and amounts in this case to 0.23 second. As the time of one complete lift is 60 ÷ 82 = 0.731 second, the interval of rest amounts to 31.4 per cent, of the total period of working.
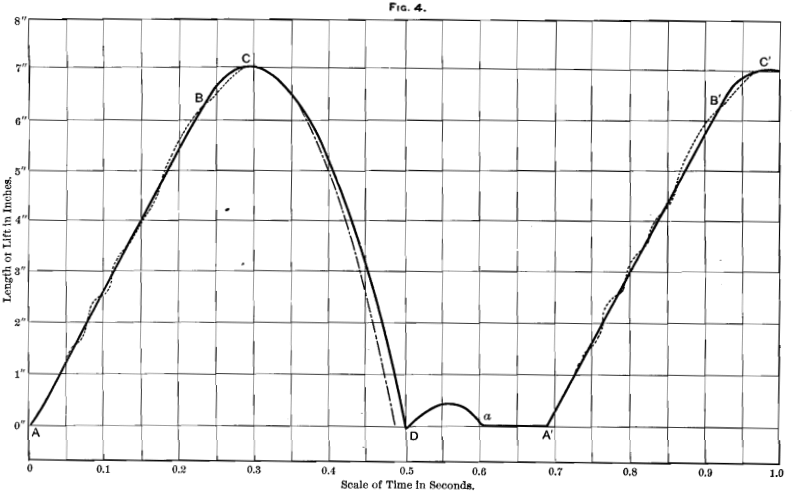
Turning next to Figs. 4 and 5, we note that the phenomena shown by the diagram are the same in character, and differ only in degree. As was to be expected, the stamp, moving with the greater velocity due to the increased number of drops, is thrown up higher before it comes to rest, and the irregularities in its lift are slightly more marked. The ultimate divergence between the diagram of the actual fall and the theoretical gravity-curve is also progressively greater, owing to the increase, in each case, of the distance fallen through. The amount and the rate of rebound seem to vary independently of the speed of the cam, and this was only to be expected, seeing that the velocity of the impact of the stamp is only one of many factors af-
fecting the rebound, and by no means one of the most important. The total interval of rest grows less as the speed increases, as was again to be expected.
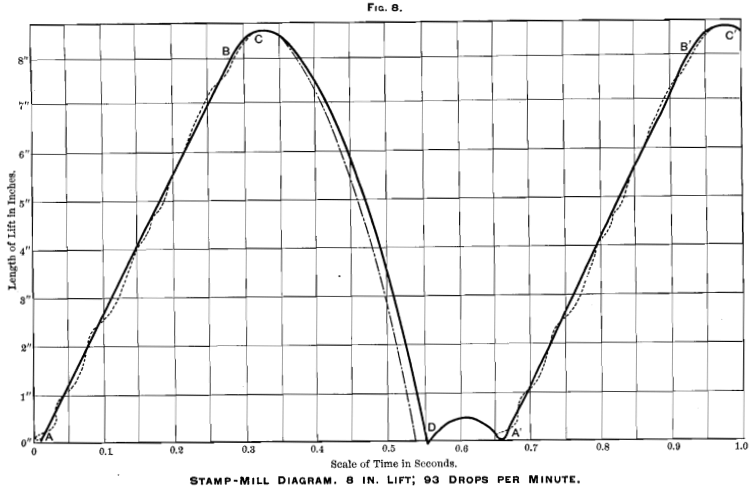
An examination of Figs. 6, 7 and 8 shows exactly the same series of results, only exaggerated, because, the length of drop being greater, there is more time given for the development of the various forces that affect the result. In Fig. 8 it will be noticed that the lift actually commences before the stamp has quite come to rest after its rebound. In other words, the speed of the stamp has exceeded its maximum permissible limit; slight “ camming ” is taking place, and the conditions are such that, if this speed were continued, something would break, most probably one of the arms of the cam. It may be noticed that the interval of rest here amounts to almost exactly 0.1 sec-
ond. In the book I have previously referred to I wrote (page 191): “ The minimum interval of rest which can be allowed in a stamp-mill is one-tenth of a second.” This statement was the average of a number of rough tests made on stamp-mills in actual running, and it is satisfactory to find my rough approximation so closely corroborated by the data furnished by the more scientific method of the indicator-diagram.
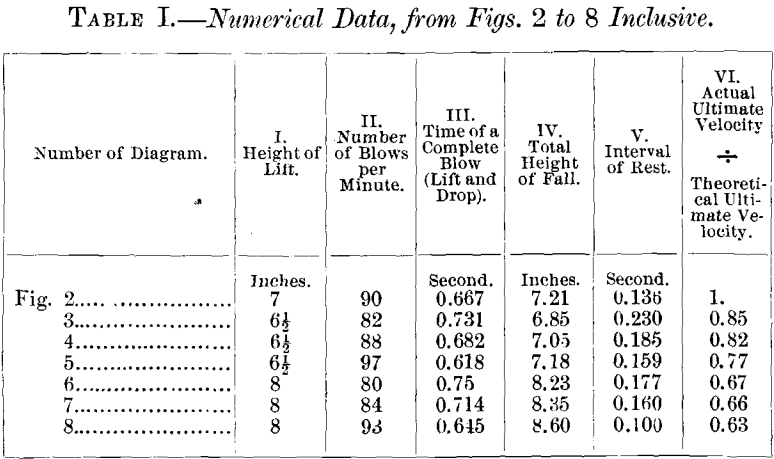
The following table shows the more important of the numerical results derived from the indicator-diagrams, assembled for convenience of reference. The first two columns are given by the conditions of the experiment. Column III. is calculated from No. II. Column IV. is obtained by direct measurement. It must be borne in mind that the figure obtained from the theoretical diagram (Fig. 2) in this column cannot well be compared with the others, because it is derived from an imaginary cam-curve, which shall not affect the tappet after the latter has been raised 6.5 inches, whereas the other numbers are obtained by actual experiment with a cam that has not been designed to fulfill exactly this condition. Moreover, in the ideal diagram, the effect of the friction between the cam and tappet has purposely been neglected. Column V. is obtained by direct measurement from the diagram. Column VI. gives the ratio of the actual velocity of impact to the theoretical velocity that would be obtained if the fall of the stamp were not retarded by friction. The square of this fraction gives the proportion of the force employed in lifting the stamp, the remainder being wasted by friction in falling. The whole of this loss can by no means be set down to imperfection of the machinery. In addition to friction against the guides, which can be reduced to a very small figure, it also represents the friction of the stamp against the air and against the pulp in the battery-box. I am inclined to think that the latter item is by far the most important:
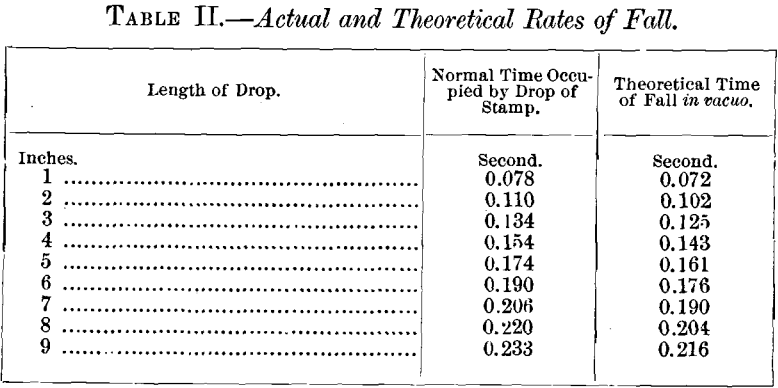
Another matter of interest that comes out from these diagrams is the actual rate at which a stamp drops in practice. According to the formula for the rate of falling of a body in vacuo, if H is the height from which it falls in feet, and t the time in seconds:
t = √2H/g, where g is the accelerating action of gravity, equal to about 32.2 feet per second.
From a comparison of a number of stamp-diagrams I find that within the ordinary limits of stamp-mill practice, say up to a drop of 9 inches, the actual time T occupied in falling may be very accurately found from the formula:
T = √2H/K, where K is a coefficient, the mean value of which I find to be 27.5, so that the above formula may be written :
T = √H/3.71.
From these formulas the following table has been compiled, showing the average rate of falling of an actual stamp, the theoretical rate of a body falling in vacuo being added for comparison :
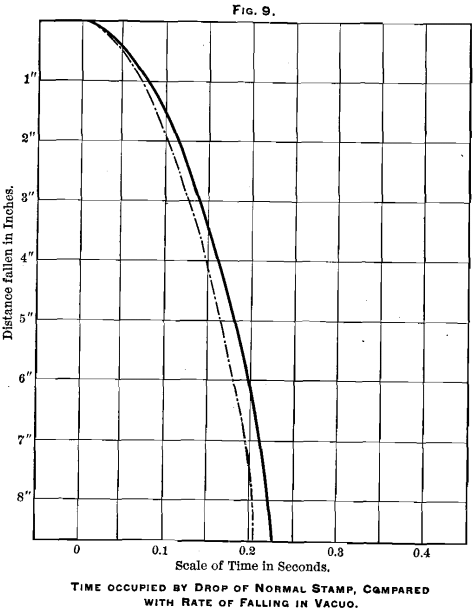
The curves thus obtained are plotted in Fig. 9 on the same scales as the previous diagrams, the full line showing the actual rate, and the dotted line the theoretical rate of falling. A comparison of the former line with those taken actually from the stamp will, I think, show a sufficiently close approximation to warrant the adoption of my formula in practice. I venture to hope that this brief paper may be the means of inducing others who are in a position to do so to take diagrams from stamp-mills under all conditions of running, and I shall be grateful for copies of diagrams so taken, to enable me to determine whether the formula given above is universally correct.
