Table of Contents
- Chalcopyrite
- Sample Preparation
- Neutron Irradiation
- Laboratory Procedures
- Apparatus
- Experimental Procedures
- Treatment of Data
- Results and Discussion
- Effect of pH
- Surface Area
- Preferential Leaching
- Effect of Ferrous and Cupric Ion Additions at Room Temperature
- Effect of Oxidants at Ambient Temperature
- Effect of Oxidants at Elevated Temperatures
- Dissolution of Chalcocite and Covellite in Sulfuric Acid Media
- Effect of Metallic Additions on the Dissolution Mechanisms of Chalcopyrite
- Theoretical Considerations
Renewed interest in hydrometallurgical recovery of copper from copper sulfide during the past decade has resulted from demonstrated increased copper production from low-grade copper ores and interest in the development of non-smelting techniques. Of the sulfide minerals of copper, chalcopyrite (CuFeS2) merits special attention because of its relative abundance and because it is generally the most difficult of the copper sulfides to leach.
Most of the work reported in the literature for chalcopyrite leaching involves autoclave or pressure leaching. Warren reported that the rate of dissolution was surface controlled between 120° and 180° C and was independent of oxygen pressure above moderate pressures. The experimental activation energy was 23 kcal/mole. Dobrokhotov and Maiorova investigated the leaching of chalcopyrite between 125° and 175° C using oxygen. They reported that the rate varied directly with acidity and with oxygen pressure to the one-half power, and had an experimental activation energy of 7.2 kcal/mole. Forward and Warren reviewed various rate-controlling steps in the leaching of sulfide minerals and indicated that below approximately 118° C and under various pH conditions the rate-controlling process is transport through porous coatings of elemental sulfur that may form on the mineral surfaces. In addition to elemental sulfur, films of iron oxides or insoluble sulfates may also form. Woodcock summarized the leaching characteristics of several aqueous sulfide systems and pointed out the variation in results for different source samples of the same mineral, indicating the importance of impurities and defect states. He also pointed out the importance of electrochemical effects in sulfide leaching.
Several important contributions to sulfide leaching have been made, and recently Subramanian and Jennings presented an excellent historical review of the hydrometallurgy of chalcopyrite concentrates.
In the present study, the initial-stage sulfuric acid leaching kinetics of chalcopyrite were studied using radiochemical techniques. Three distinct dissolution rates were observed. The initial rate data were correlated by considering the rapid reaction to be due to the dissolution of surface oxidation products or to the formation of an iron-depleted surface layer. The data for the second, slower reaction have been explained to be due to the growth of the sulfur layer by the reaction
CuFeS2 = Cu+² + Fe+² + 2S° + 4e-……………………………………………….(1)
and the reduction of oxygen by the reaction
O2 + 4H+ + 4e- = 2H2O………………………………………………………………(2)
by applying the theories of Wagner and Grunewald involving both surface and diffusion control. In addition, enhanced dissolution of chalcopyrite is shown to occur under conditions in which cathodic reactions of chalcopyrite are induced.
Experimental Procedures
Chalcopyrite
The chalcopyrite used in this investigation was obtained in the form of massive chunks of high-grade Transvaal material. The only impurity of any consequence was quartz gangue, which was easily separated by handpicking. Microscopic examination of polished sections used as electrodes also showed the mineral to be of exceptional quality. Chemical analysis of the chalcopyrite showed the mineral to be near stoichiometric proportions: in percent, 34.6 Cu, 30.4 Fe, and 35.0 S.
Sample Preparation
The preparation of a uniform-sized sample fraction in any particular size range presented a problem that was never satisfactorily resolved. Sizes in the 5- to 40-micrometer (μm) range were desired. Fine-sieve sizing was discarded since the finer fractions could not be obtained and because of the holdup of ultrafine material in all size fractions.
Acetone settling of hand-ground material was finally chosen as an expedient alternative. This method possessed several difficulties, the most important of which was lack of reproducibility due to agglomeration of the particles. In addition to being time-consuming, acetone settling was not able to produce large quantities, with a week’s work required to produce about 30 grams in any desired particle size range. Consequently, there was never on hand a sufficiently large quantity of any one size fraction to last the entire experimental period, thus requiring either measurement of the surface area of each batch by nitrogen adsorption, or some form of data normalization, which will be discussed later.
Neutron Irradiation
The bulk of the neutron irradiation were performed at the Research Reactor Facility of the U.S. Geological Survey in their pool-type TRIGA reactor located in Denver, Colo.
The reaction between thermal neutrons and chalcopyrite produces the following radioisotopes: Gamma-ray emitters copper-64 (half-life 12.8 hours), copper-66 (half-life 5 minutes), iron-59 (half-life 45 days), iron-55 (half- life 2.6 years), and beta ray emitter sulfur-35 (half-life 88 days). Reactions involving chalcopyrite and fast neutrons produce unwanted radioisotopes manganese-54, a gamma ray emitter of 303-day half-life, and phosphorus-32, a beta ray emitter of 14-day half-life.
The Geological Survey reactor facility was not available or suitable for production of iron-59 and sulfur-35 because the long irradiation times required would interfere with the normal procedures, and the high fast neutron flux (convenient for activation analysis—the main function of this facility) would produce unwanted radioisotopes manganese-54 made from iron-54 and phosphorus-32 made from sulfur-35 by fast neutron reactions.
A research reactor with a high level of thermal neutrons or, more correctly, with a higher ratio of thermal to fast neutron flux, was available at the University of Missouri at Columbia, Mo., and it was hoped that insignificant amounts of manganese-54 and phosphorus-32 would be produced. This did not prove to be the case, however. Travel delays made it necessary to
ship portions of the sample to the Geological Survey reactor facility for additional copper activation in the usual manner.
Laboratory Procedures
Handling of the radioactive sample presented some problems since the laboratory was not equipped with remote-controlled manipulating devices. This restriction, coupled with the high activity of the sample when first received, required that (1) the 10-gram sample be contained behind a lead brick barricade at all times, (2) all experimental apparatus also be surrounded by lead, and (3) only a small portion of the sample, usually ½ gram or 5 millicuries, could be safely handled.
After the sample had decayed to a level suitable for handling, the vial containing the 10 grams of radioactive chalcopyrite was quickly transferred from the lead shipping cask to a position in a suitable holder behind a lead barricade. Using a long bolt cutter and a system of mirrors, the vial was cut and its contents were dumped into a shallow plastic cup, from which the required amounts, usually ½ gram or 1 gram, were quickly weighed and placed in the reaction apparatus.
Apparatus
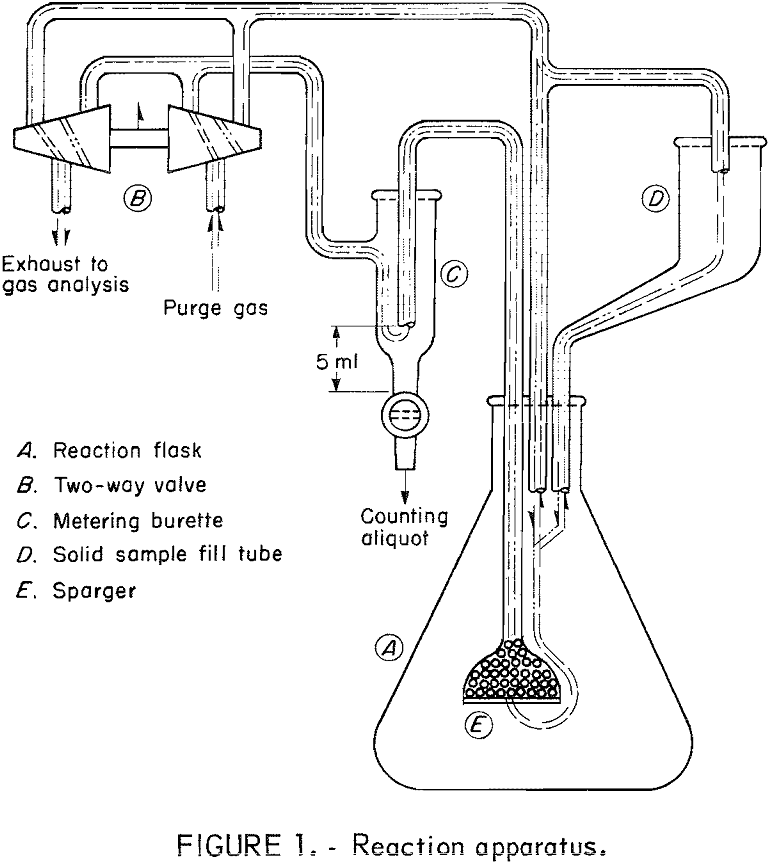
The apparatus used is shown schematically in figure 1. The main components are a 500-ml Erlenmeyer flask (A), a two-way stopcock arrangement (B), a metering burette (C), and a gooseneck-fill tube (D). Sparger (E) acts in the dual capacity of sample filter and purge gas disperser. The sparger is filled with glass beads in order to keep the volume of the sampling system to a minimum and thereby shorten the time required to eject a sample.
The operation was as follows: With the valve handle in the up position (pointing towards the top of the page), the purge gas flowed uninterruptedly through the metering burette, sparger, and sample fill tube, returning to the exhaust side of the two-way valve. Liquid counting samples were withdrawn by turning the valve handle down (toward the bottom of the page). The flow of gas was reversed and pressure was applied to the surface of the test liquid in the flask. When the level of the liquid in the burette reached the top of the glass tube, the valve handle was returned to its original position and the excess fluid in the sparger was returned to the flask and the gas flow continued as before. The counting aliquot was then withdrawn into a plastic counting tube by opening the burette stopcock.
The radioactive sample was introduced by placing it in the fill tube, then flushing it in with a portion of the test solution, usually 30 ml. The counting aliquots were also returned to the flask by means of the fill tube after a delay of 1 minute. With this device, samples could be withdrawn in approximately 15 seconds. In actual practice, it was found that more reproducible counting results were obtained by pipetting 4-ml counting aliquots from the original 5-ml counting samples. Temperature regulation was provided by a quartz immersion heater and a thermister probe inserted through the sidewall of the flask.
Experimental Procedures
Unless otherwise stated, the experimental conditions were as follows:
Solution-500 ml of 0.1 N sulfuric acid
Purge gas-tank oxygen
Mineral sample size-½ gram or 1 gram
Test duration-1 hour
Temperature-room, immersion heating with automatic control
Sampling-one sample at 30 seconds, then 1 sample per minute for 10 minutes, followed by 1 sample per 5 minutes to 60 minutes.
Each experiment was initiated by filling the flask with the test solution and starting the flow of gas. After a period of equilibration, the radioactive sample was placed in the sample fill tube. At time zero, the sample was flushed into the flask using about 30 ml of the test solution. Five-milliliter liquid counting samples were withdrawn, pipetted to 4 ml, and counted at once. The counting aliquot and the remaining 1 ml were returned to the flask. The clock time at the time of each count was recorded so that the appropriate decay correction could be applied.
Treatment of Data
The raw counting data were in the form of counts per minute per 5 ml. In order to make the data quantitative, that is, grams of copper dissolved per gram of chalcopyrite, the specific activity, or counts per minute per gram of copper, had to be determined for each batch of radioactive mineral received. This conversion factor was obtained gravimetrically by dissolving 50 mg of chalcopyrite containing 17,300 μg of copper into a known volume of solution, usually 500 ml. The total counts per minute were found by counting 5-ml
aliquot and multiplying by 100. The value of the specific activity was corrected for decay to the original time zero, using a computer program which applied the necessary decay and volume corrections.
Results and Discussion
Effect of pH
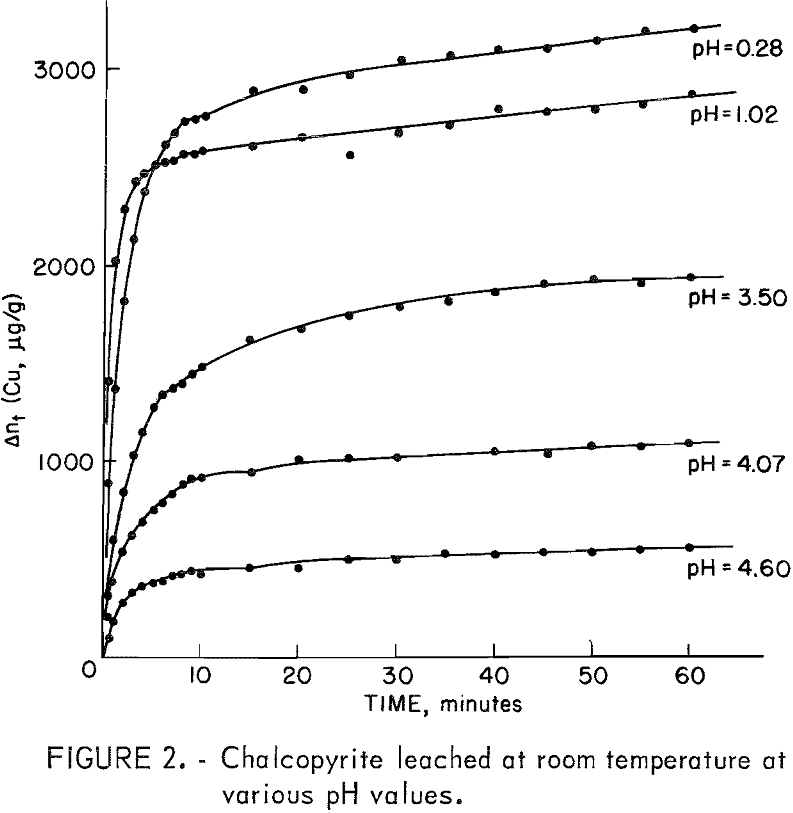
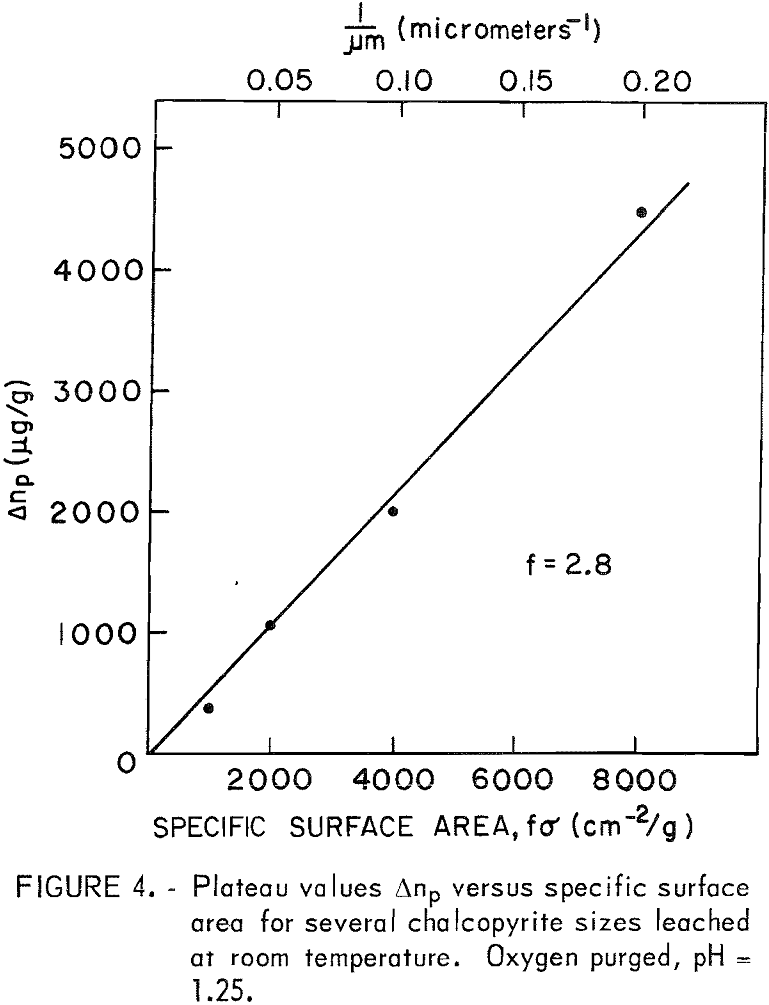
The experimental curves show first an initial period of rapid dissolution lasting a few minutes; second, an arrest or “plateau” region usually lasting 6 to 10 minutes; and third, a second period of lesser rate than the first. Figure 2 shows such curves for the leaching of 0.5 gram of chalcopyrite in 500 ml of solution at room temperature for several pH values. Curves obtained at pH 1.5 to 2.5 are not included since they essentially superimpose on the pH 1.02 data. The total copper in solution (Δnt) is given in micrograms of copper per gram of chalcopyrite (μg/g). The amount of copper leached in micrograms of copper per gram of chalcopyrite at the plateau value is designated Δnp and was found to be directly related to the surface area of the sample used.
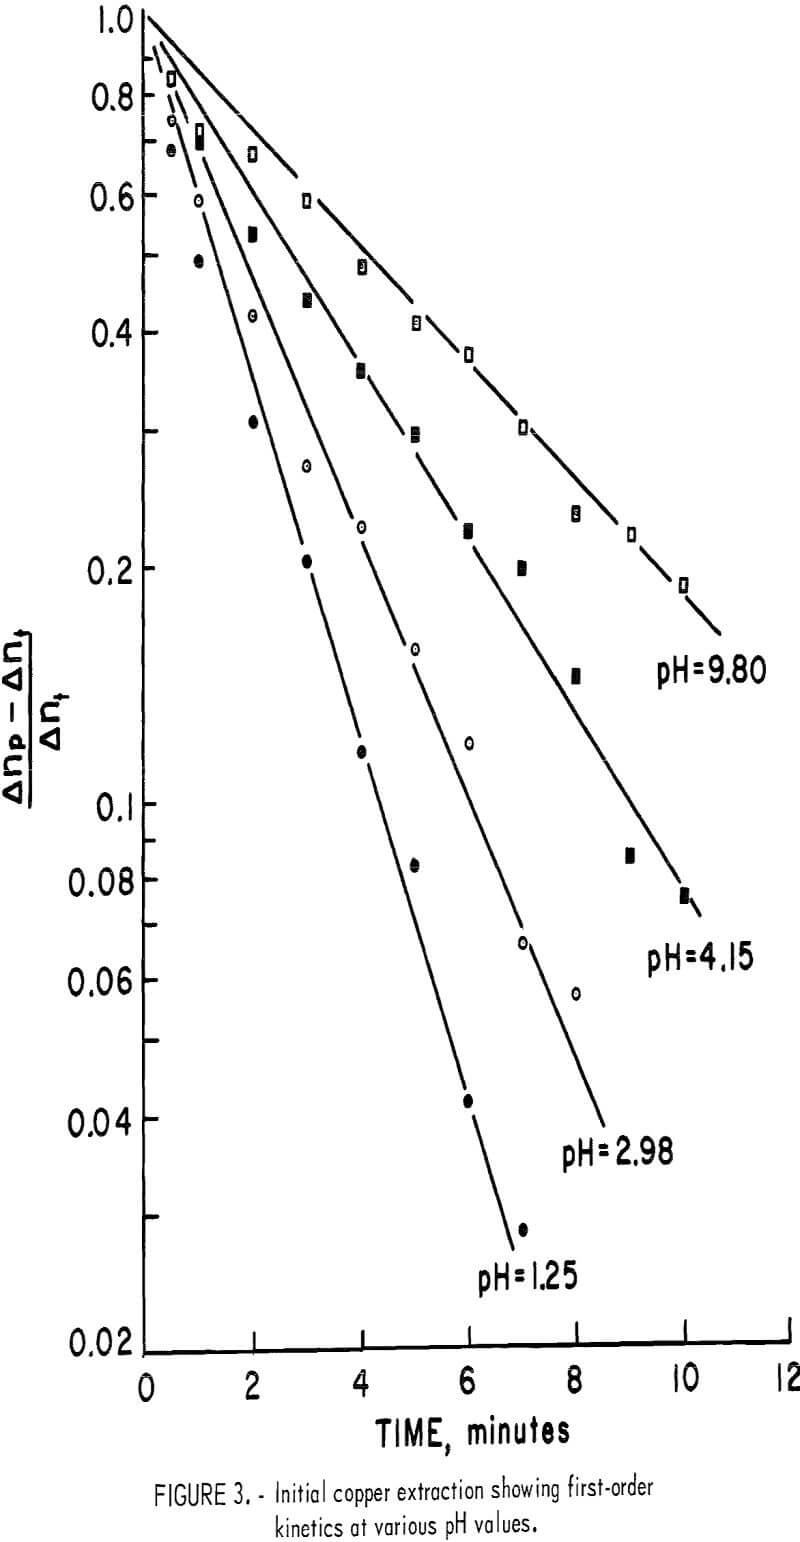
The initial rise shown in figure 2 appears to be a separate process and is independent of the oxygen partial pressure at room temperature. If the plateau value, Δnp, is considered to represent completion of this first process, the rate of copper extraction follows first order kinetics according to the equation

Figure 3 shows the first-order correlation for a sample having a surface area of approximately 2,000 cm²/g at pH values of 1.25, 2.98, 4.15, and 9.8.
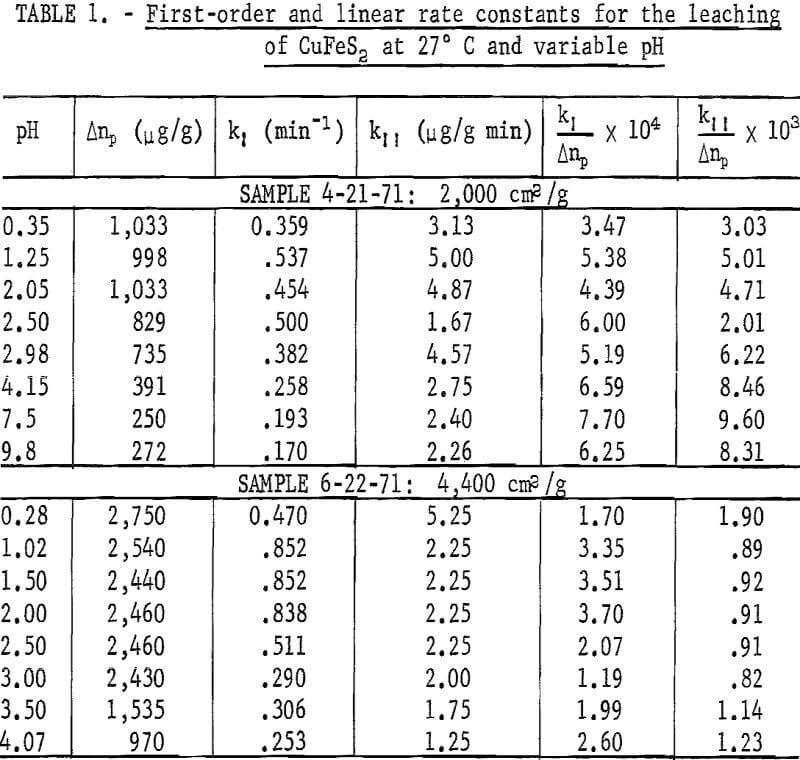
For times greater than 10 minutes, the rate of copper extraction is approximately linear at room temperature. The slope (kΠ) for this second process also varies with the Δnp value. Table 1 presents k1 and kΠ values for two separate samples at several pH values. Included are normalized k1/Δnp and kΠ/Δnp values indicating the approximate linear variation of these rate
constants with Δnp. The rate constants are essentially independent of pH between 1 and 2.5. The chalcopyrite used for the pH results presented in figure 2 had a specific surface area of approximately 4,400 cm²/g. The amount of copper in solution by the time the plateau value was reached at pH 1.25 was equivalent to the amount of copper contained in a chalcopyrite layer 0.017 micrometer in thickness based on the geometric area. Rapid extraction of copper occurred in a few minutes, followed by a much slower reaction rate. It is not clear from kinetics alone whether this initial extraction of copper results from the dissolution of surface oxides or from alteration of the chalcopyrite surface. Dutrizac, MacDonald, and Ingraham indicated that the chalcopyrite residues maintained constant ratios with copper, iron, and sulfur, and that there was no indication of preferential leaching. Therefore, if there is a preferential removal of iron and copper, it must occur in a relatively thin surface layer.
Surface Area
Different sample sizes gave results similar to those presented in figure 2. The rates are proportional to the surface area, and if the arrest or “plateau” values (Δnp) are compared at the same pH there is a direct correlation with surface area. Figure 4 is a plot of Δnp values for 5-, 10-, 20-, and 40-micrometer samples leached at pH = 1.25. The geometric surface area σ (cm²/g) was calculated from σ = 6/Pd, where p is the density of the CuFeS2 (4.2 g/cc) and d is the particle diameter in cm. This gives a value of 2,858 cm²/g for the 5-micrometer fraction. Surface area measurement by N2 adsorption gave a value of 8,000 cm²/g for the same material. Combined geometric and surface roughness factor f is therefore approximately 2.8. The true surface areas are presented in figure 4.
Preferential Leaching
Attempts were made to determine the preferential extraction of copper and iron during the initial stages of leaching.
The simultaneous determinations of the rates of copper and iron extraction presented additional analytical problems and developed into such a time-consuming procedure that only a few preliminary experiments were conducted. In addition to the long irradiation times and the transportation difficulties mentioned in the section on laboratory procedures, time-consuming multichannel analysis was necessary because of the presence of gamma ray energies from the copper-64, iron-59, and manganese-54. Because these multichannel analysis counting techniques required about 10 minutes for counting and printout per sample, a special volume correction had to be applied to each determination.
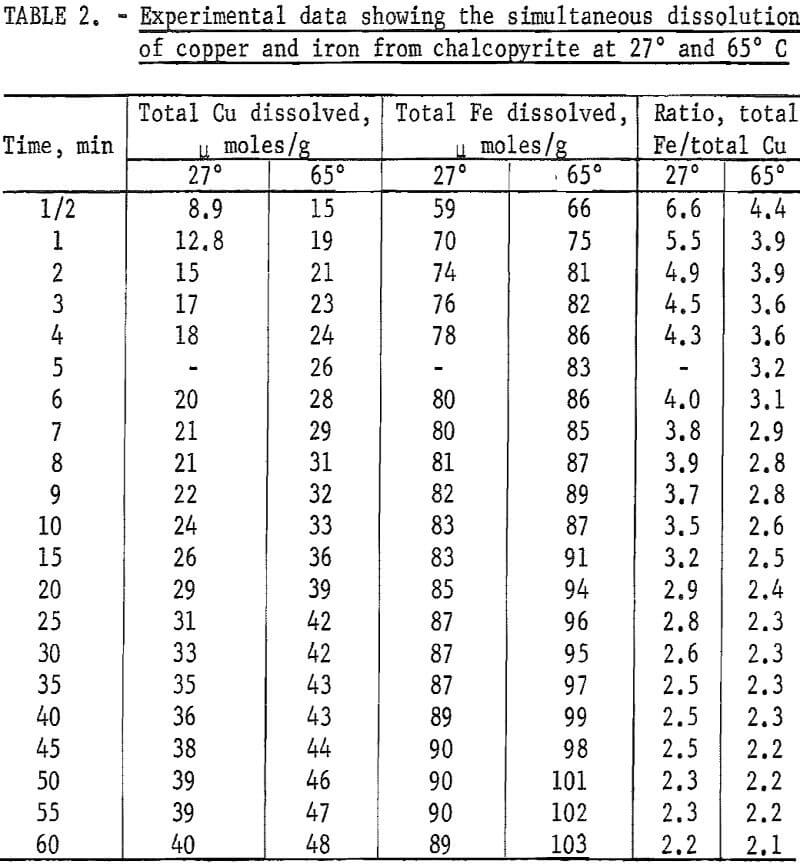
Two tests were performed, one at room temperature and one at 65° C using 10-micrometer chalcopyrite. The results are shown in figure 5. The selective dissolution of iron over copper is immediately apparent particularly during
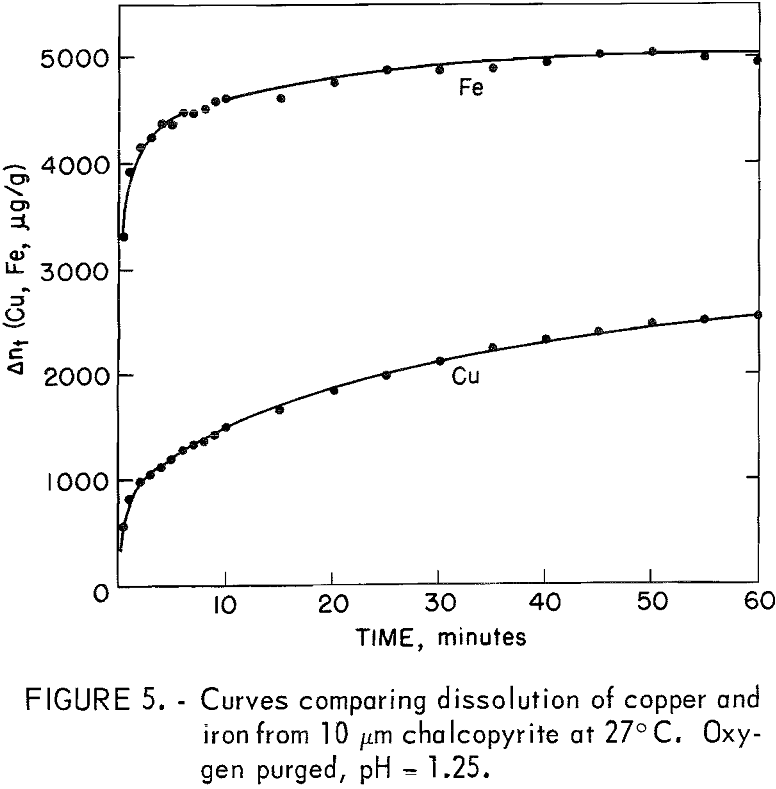
the first 10 minutes. After that time, the rate of iron dissolution was considerably less than that for copper. At 27° C, the molar ratio of iron removed compared to copper is approximately 5.0 after 30 seconds, with the ratio diminishing to approximately 2.3 after 60 minutes. Table 2 shows the data for 27° and 65° C.
As mentioned earlier the removal of oxide layers can account for first-order kinetics if the layers are thin. An alternative explanation involves the formation of iron-depleted surface layers resulting from electrochemical reactions in which ferric ion in the lattice is reduced cathodically. Accordingly, the anodic reaction would be
CuFeS2 = Cu+² + Fe+² + 2S° + 4e-……………………………………………………….(4)
and the cathodic reaction would be
Fe+³(lattice) + e = Fe £ + 3 ⊕ + Fe+²……………………………………………….(5)
where Fe is a trivalent cation vacancy and ⊕ represents a positive electron hole or Cu+²(1), where (1) refers to the lattice.
From the magnetic structure of chalcopyrite, copper and iron were found to be present as Cu+¹ and Fe+³. Accordingly, the cation vacancy would carry an effective minus-3 charge balanced by three positive holes (divalent cupric ions). The overall reaction would be
4Fe+³(1) + CuFeS2 = 4Fe + 12 ⊕ + 5Fe+² + Cu+² + 2S°……………………………….(6)
The initial ratio of iron to copper would be approximately 5:1 as was observed experimentally and would continue until the entire surface is partially depleted of iron. Thermodynamic considerations would limit the number of cation vacancies the lattice could accommodate. The saturation of the lattice with vacancies would thus account for the first-order kinetics observed. The new anodic surface, containing vacancies generated by removal of iron, would thus increase during the initial process. Just prior to the plateau region (figure 5,-8 min) the ratio of iron to copper is approximately 1:1 as determined from the slopes of the iron and copper curves at that point. This would indicate that the iron deficient surface is dissolving anodically with the cathodic reduction of oxygen.
It also should be mentioned that dissolution of surface oxides would similarly produce a near 5:1 or greater iron-to-copper ratio, since the Fe+³ released by dissolution would similarly be reduced cathodically.
Effect of Ferrous and Cupric Ion Additions at Room Temperature
The effect of ferrous ion additions was easily determined, but the determination of the effect of cupric additions required special techniques because it was discovered that an exchange mechanism existed between mineral copper ions and solution copper ions.
The absence of any effect due to the presence of ferrous ions added as freshly prepared ferrous sulfate in the range 0 molar Fe+² to 4 x 10-³ molar Fe+² at 27° C was confirmed by eight experiments using 10-micrometer chalcopyrite. All of the rate curves were identical within the limits of experimental error. The test results also indicated that the oxidation of ferrous iron to ferric by oxygen did not occur, at least in the early stages of dissolution.
The effect of the exchange mechanism on the measurement of the amount of copper dissolved may be summarized as follows for the case involving radioactive chalcopyrite: If the leach solution contains no copper ions initially and a one-for-one exchange exists between the mineral and solution ions, measurement of the solution radioactivity is a direct measurement of the copper concentration. Similarly, if nonradioactive copper is added to the solution and no exchange existed, then the measure of the solution radioactivity would again be a direct measure of the copper concentration. When an exchange does exist however, and nonradioactive copper ions are added to the solution, the amount of radioactivity in the solution is no longer a direct measure of the concentration unless the ratio of the number of radioactive copper ions to the number of nonradioactive ions in solution is exactly the same as the ratio in the mineral. This is another way of saying that the specific activity (counts per minute per gram of copper) in the solution must be identical to the specific activity of the mineral. Two ways exist to satisfy this requirement. First, the specific activity of the mineral can be measured and then a solution made of nonradioactive copper and copper-64 so that the ratio of copper-64 to copper in the solution will be the same as that of the mineral at the starting time of the experiment. This is complicated by the fact that the copper-64 in the mineral is decaying while the solution is being prepared. A much simpler way is to neutron irradiate both the mineral and the copper salts used to prepare the solutions for the same time at the same reactor flux.
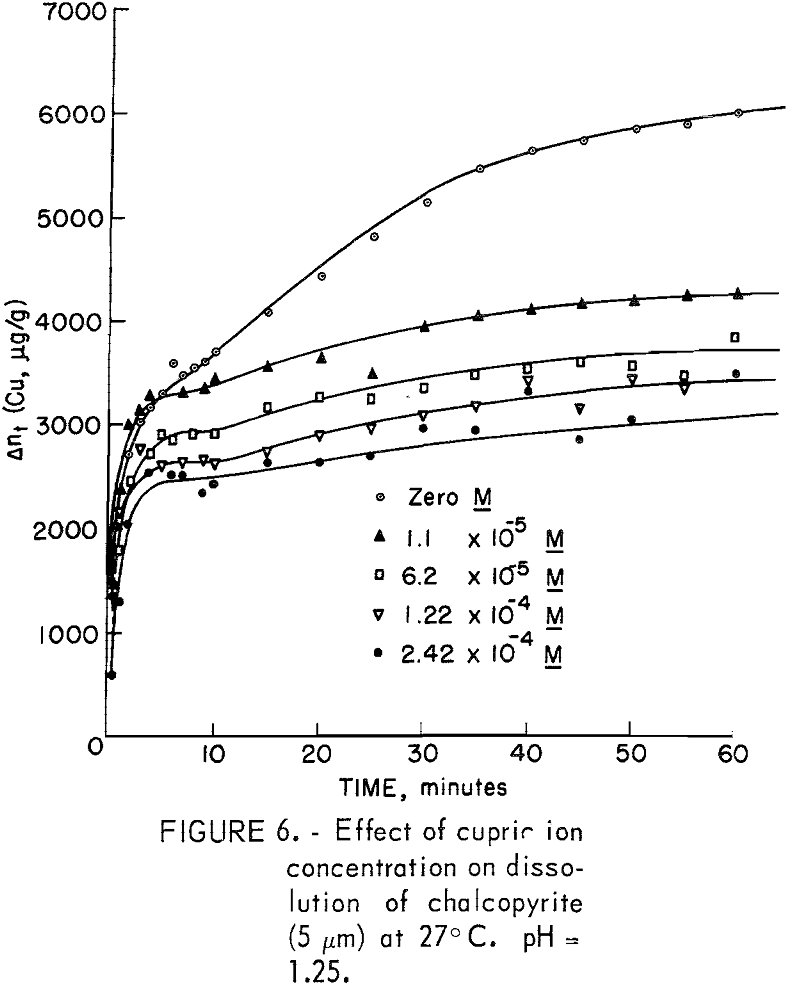
The criterion of equal specific activities for solution and mineral precludes the use of concentrated solutions, as the radioactivity of the solution would be extremely high. Also, the small contribution to the solution radioactivity from the mineral would be completely masked by the high solution activity, particularly in those instances where the mineral contribution was small. Consequently, both copper sulfate crystals and fine chalcopyrite (5 micrometer) were neutron irradiated simultaneously. The weights of the two portions were adjusted so that the total amount of copper was equivalent to 3.46 grams as contained in 10 grams of chalcopyrite. A stock solution prepared from the crystals was diluted to make five test solutions: 0, 2 x 10 -5 , 12 x 10 -5 , and 47 x 10 -5 molar. The inverse effect is evidenced in figure 6 in spite of some obvious unexplained anomalies. It is interesting to note that the effect of the smallest additions of copper is far greater than the effect of 20 times as much with regard to total copper dissolved. The position of the plateau region is also depressed, a fact not observed with ferrous iron additions.
Effect of Oxidants at Ambient Temperature
The important oxidants investigated were ferric iron as ferric sulfate, hexavalent chromium as potassium dichromate, oxygen, and hydrogen peroxide. The experimental results for ferric ion additions in the range 0 to 0.69 molar Fe+³ using 20-micrometer chalcopyrite are shown in figure 7. A relatively large increase in the amount of copper dissolved for a small initial increase in the amount of oxidant added was characteristic of this type of oxidation. A salient feature of all the curves of figure 7 is the increase in the amount of copper dissolved during the initial stage of dissolution with increasing
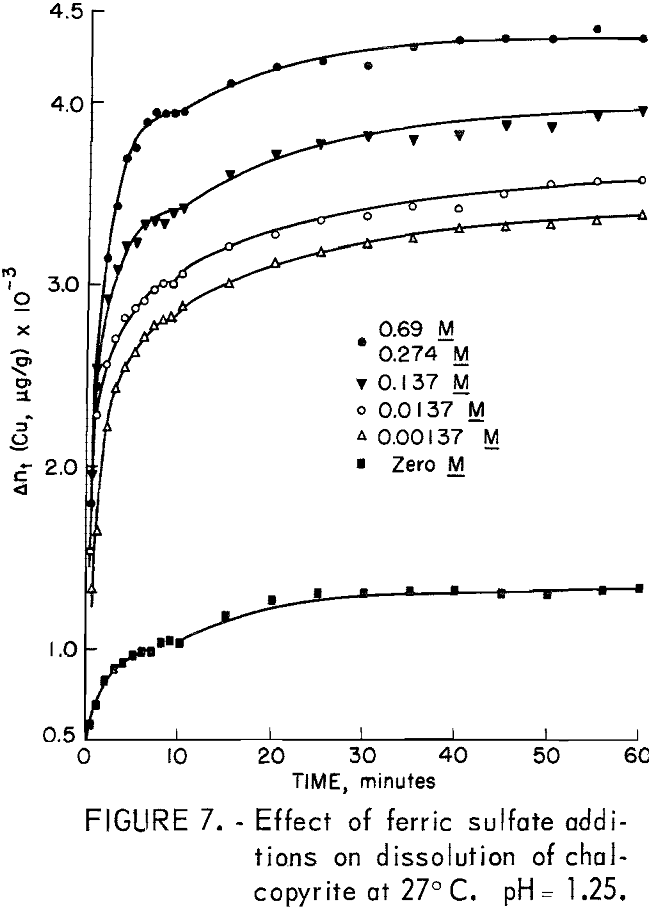
iron content before the plateau region is reached. Another interesting feature is the fact that the amount of copper dissolved in the period 10 minutes to 60 minutes is nearly the same, approximately 500 μg/g.
It is interesting to note that if the ferric iron concentration of a test solution were increased tenfold, that is, from 0.00057 to 0.0057 molar after a test had been made at lower molarity, no additional dissolution of copper was observed during one additional hour.
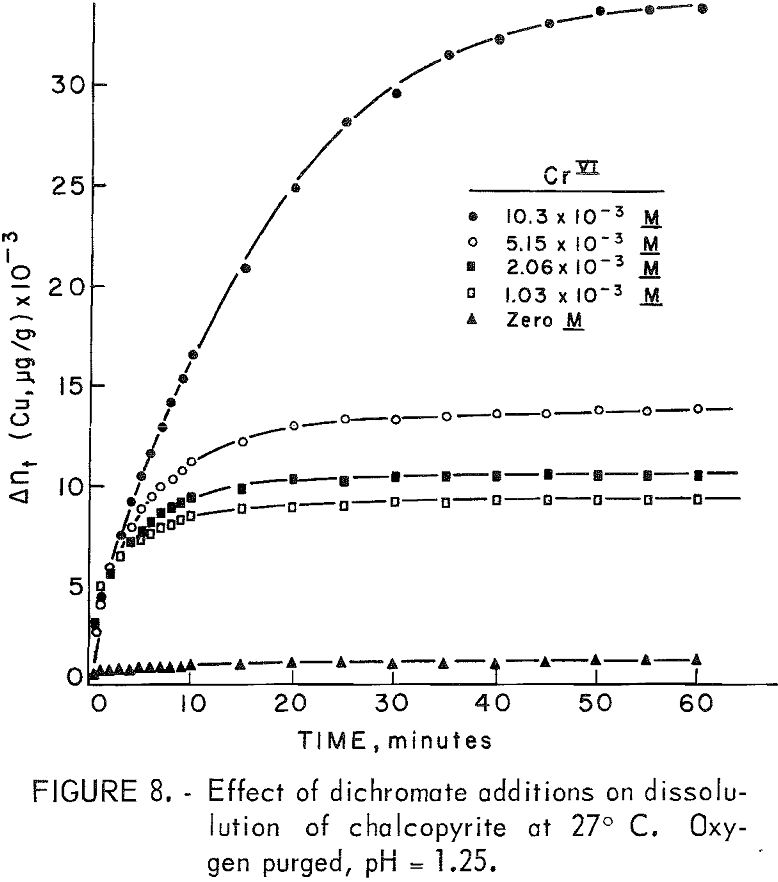
Hexavalent chromium additions in the range 0 to 0.0103 molar Cr +6 produced a more striking effect than did ferric iron, as shown in figure 8. The great increase in dissolution of copper is immediate compared with iron (Fe+³) additions. Not so obvious is the reason for the blending of the plateau region into an inflection point occurring near 10,000 µg/g of copper dissolved. The significance of this particular plateau region will be expanded further in the section on copper dissolution at 85° C. The rather abrupt cessation of dissolution and the large gap between the 0.005-molar and the 0.01-molar curves suggests either the formation of an impervious layer or the depletion of chromium from the solution. Parabolic rate plots for the chromium additions showed a linear portion in the 0.01 molar Cr +6 curve from several minutes to 25 minutes followed by an abrupt cessation as mentioned above. The other curves did not show parabolic tendencies.
That sufficient hexavalent chromium existed in all concentrations can be verified by considering the following overall reactions:
3CuFeS2 + 2Cr2O7 -² + 28H+ = 3Cu+² + 3Fe+² + 6S° + 4Cr+³ + 14H2O………………………(7)
yielding ferrous iron and elemental sulfur,
and 6CuFeS2 + 17Cr2O7-² + 142H+ = 6Cu+² + 6Fe+³ + 12SO4-² + 34Cr+³ + 71H2O………………(8)
yielding ferric iron and sulfate.
At all molarities of hexavalent chromium in the experiments, the amount of chromium present exceeded the requirements of equation 5. The cessation of dissolution may well be due to the formation of a layer of insoluble material such as chromates.
The addition of Cu64+² (0.00005 molar) to a solution containing Cr+6 (0.0001 molar) lowered the dissolution rate slightly and also delayed the cessation of dissolution.
Gaseous oxygen additions at room temperature did not produce a measurable increase in the amount of copper dissolved. In the range zero atm to 0.84 atm partial pressure 02, the dissolution curves were identical within the experimental error of the method. The term zero atm O2 implies 100-percent tank nitrogen purging and must include that oxygen present in the nitrogen and adsorbed on the mineral surface during pretreatment.
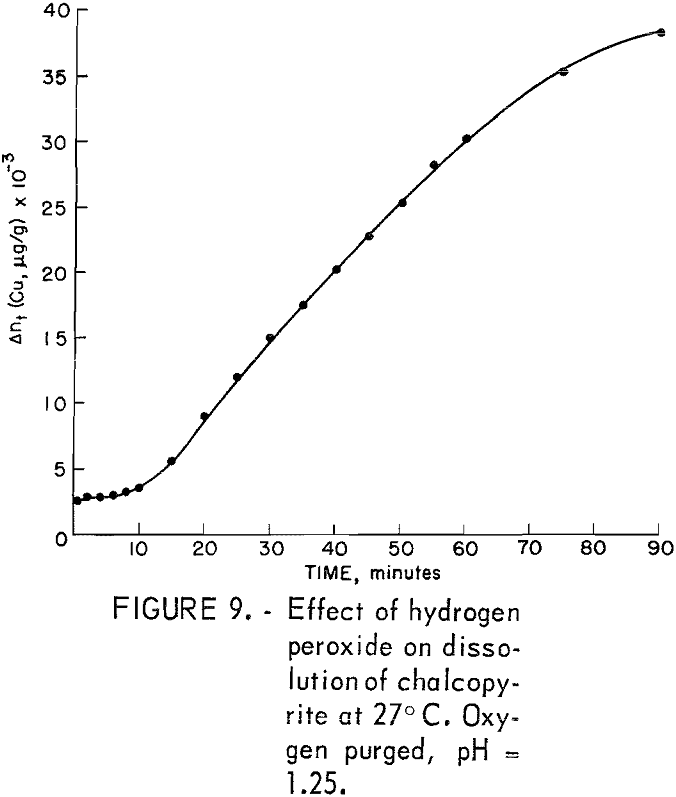
The addition of hydrogen peroxide also produced a dramatic increase in the amount of copper dissolved. Unfortunately, H2O2 was added as an afterthought only once and then to the solution of an already completed test in which the mineral had been oxidized by gaseous oxygen at 85° C for 1 hour. The original test solution containing the chalcopyrite sample was allowed to cool to room temperature and remain intact overnight before the H2O2 was added. Figure 9 shows the results of the peroxide addition after the solution was purged for 1 hour with tank oxygen at 0.84 atm (100 pct O2). Five ml of 30 pct H2O2 was added, making the solution 0.009 molar in hydrogen peroxide. The initial intercept at 2,600 μg Cu+²/g is due to the presence of copper previously dissolved. The results show that the additional purge with pure oxygen produced no increase in the amount of copper dissolved, thus confirming the findings of the room temperature oxygen rate data, and that the H2O2 addition produced nearly linear kinetics after an induction period of about 10 minutes. The length of this induction period corresponds to those periods observed in other experiments at room temperature in which unleached mineral was used.
Effect of Oxidants at Elevated Temperatures
Figure 10 shows the effect of temperature on the leaching of 10-micrometer CuFeS2 in solutions purged with oxygen at pH of 1.25. The plateau values all fall in the region 1,950 to 2,000 μg/g and are little affected by temperature. The initial rise time to reach the plateau value is less for higher temperatures, the first-order rate constant increasing approximately 4.25 times between 27° and 91.5° C. This gives an experimental activation energy for the initial process of approximately 4.8 kcal/mole. Solution diffusion would have an activation energy of approximately this value.
The second rate process beyond the plateau value is clearly not linear at the higher temperature but approached linearity for the lower temperature. This suggests mixed surface plus transport kinetics such as observed by Wagner and Grunewald for the oxidation of copper. If it is assumed that the process beyond the plateau results in the buildup of a diffusion layer, the Wagner-Grunewald equation applied to this system would give the sum of a parabolic plus linear rate according to the equation

where Δn = Δnt – Δnp, Δnt is the total amount of copper dissolved at time t, to is the time when the second process begins, and kp and kl are the parabolic and
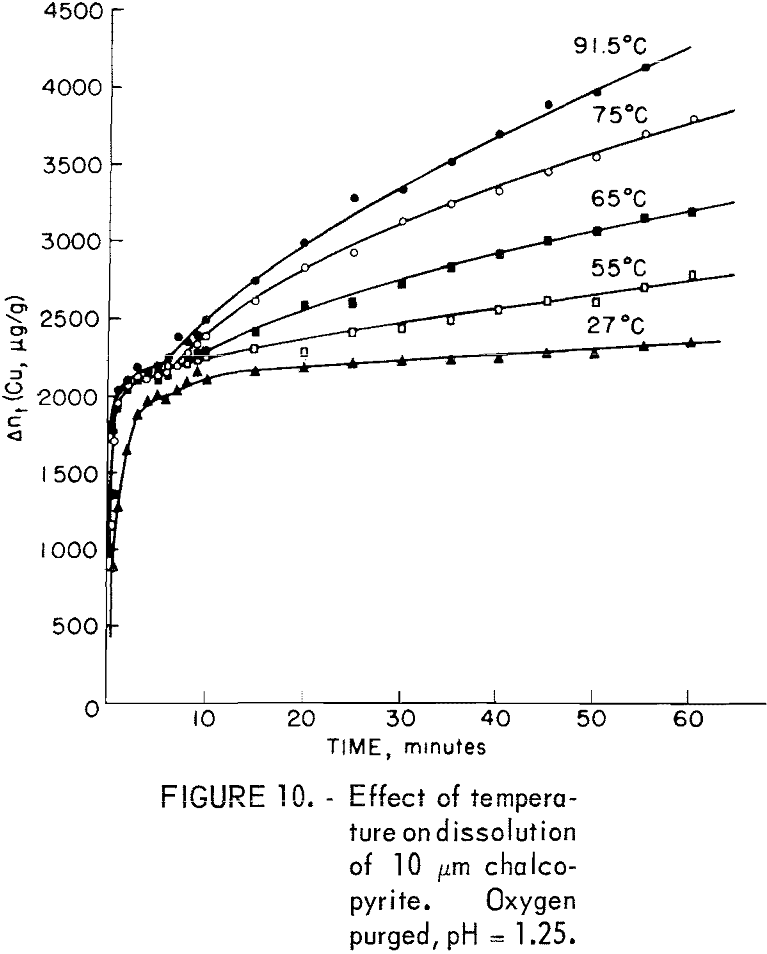
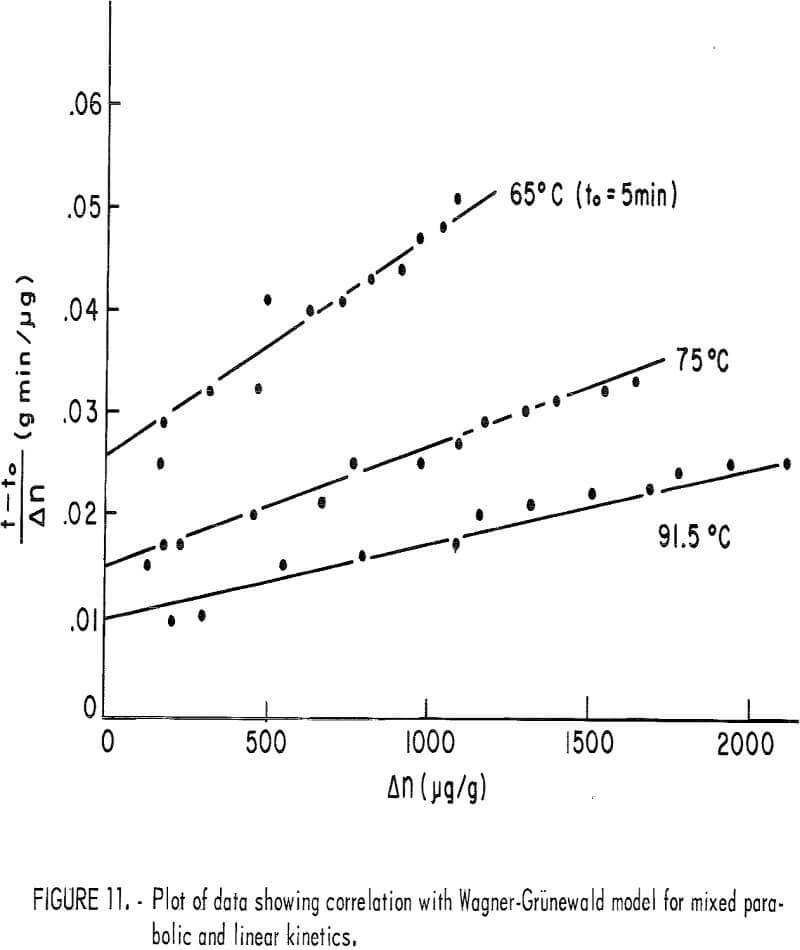
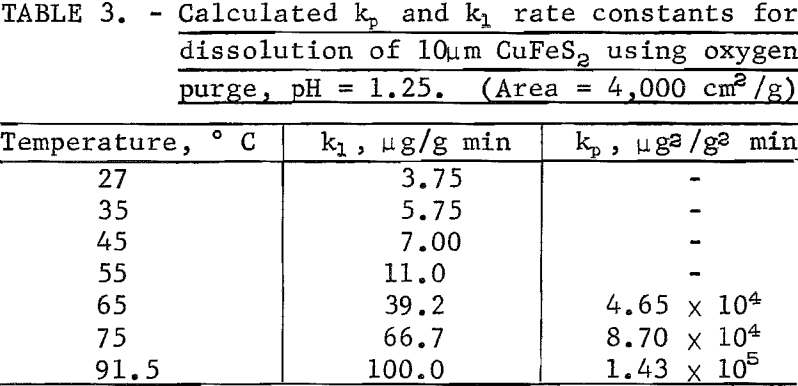
linear rate constants, respectively. Figure 11 is a plot of (t – to)/Δn versus Δn for 65, 75, and 91.5° C, which, according to equation 7, should give a straight line of slope kp-¹ and intercept kl-¹. For lower temperatures, kl values may be read directly from the curves of figure 10. Table 3 lists the kp and kl values. Figure 12 is an Arrhenius plot for kl and kp, giving an experimental activation energy for the linear process, ΔEl = 12.5 kcal/mole, and for the diffusion process, ΔEp = 10.2 kcal/mole.
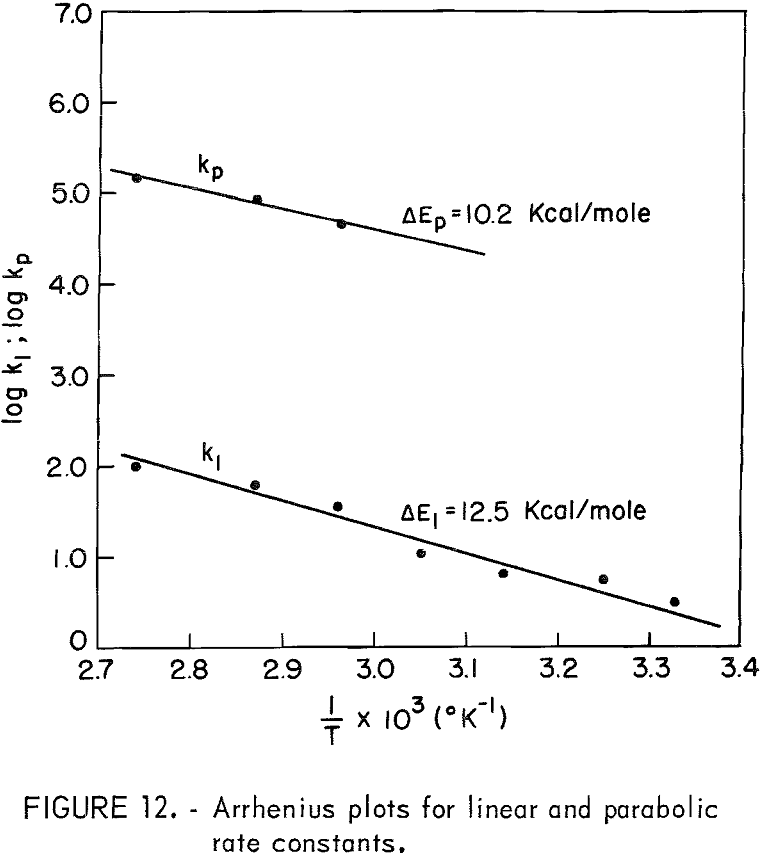
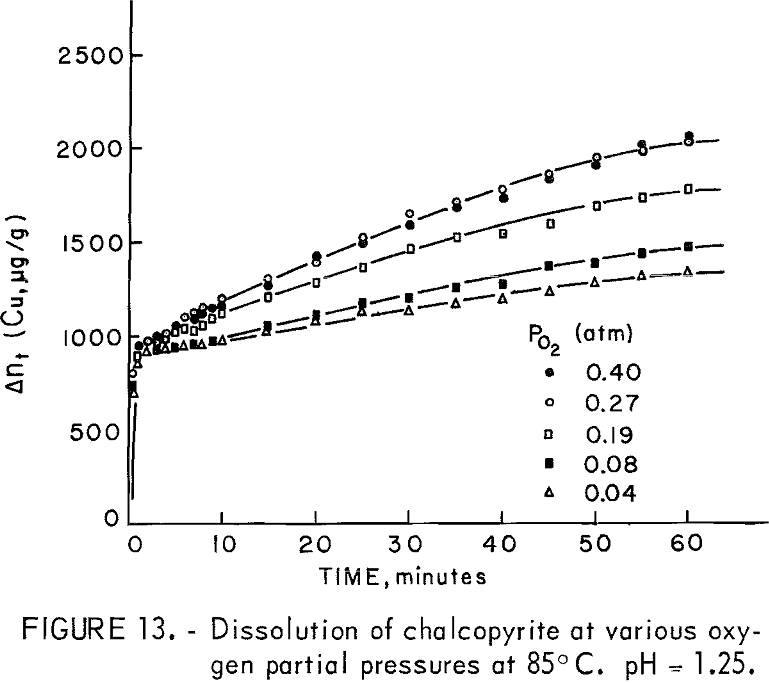
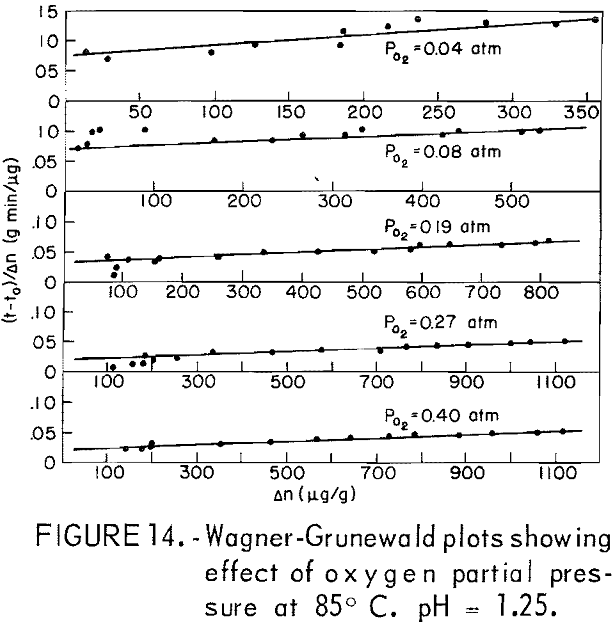
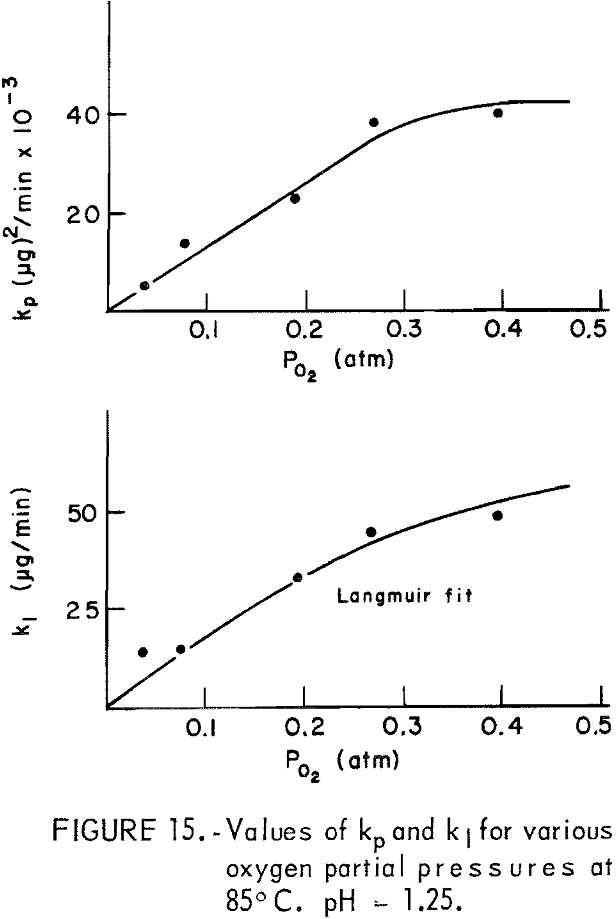
The dissolution of 20-micrometer CuFeS2 at 85° C and pH = 1.25 for various partial pressures of oxygen extending from 0.04 to 0.40 atmosphere is shown in figure 13. The oxygen partial pressure was varied using oxygen-nitrogen mixtures with oxygen percentages of 10, 20, 48, 68, and 100 percent, giving partial pressure over water at 85° C (Salt Lake City barometric pressure ~ 0.86 atm) of 0.04 0.08, 0.19, 0.27, and 0.40 atm, respectively. The initial rise and the plateau values are little affected by the oxygen partial pressure. The second process begins at to ∼ 4 minutes, in which a surface film, presumably sulfur, forms on the surface. Figure 14 presents Wagner-GrunewaId plots for this process where to = 4. If the rate were linear, the lines of figure 14 would have zero slope. As before, the overall rate process is a combination of diffusion of oxygen through the built up layer plus reaction at the chalcopyrite-sulfur interface. As before, the kl and kp values may be determined. Figure 15 illustrates the variation of kl and kp with oxygen partial pressure. The parabolic rate constant kp increases linearly with PO2 and then appears to level off. The linear rate constant increases as shown, again falling off for higher oxygen partial pressures. This may be due to adsorption on the chalcopyrite surface.
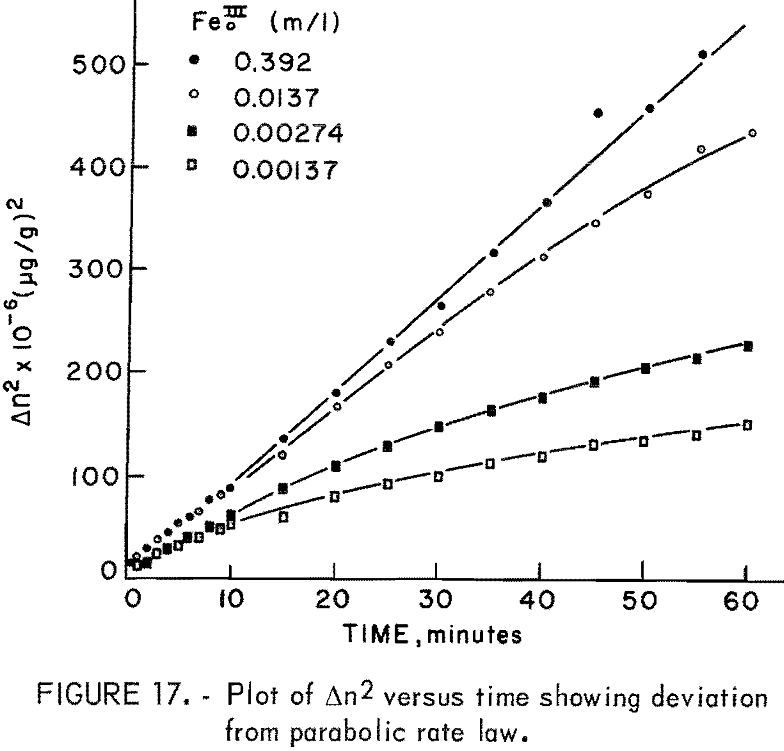
Figure 16 illustrates the effect of ferric sulfate additions on the rate of leaching of 20-micrometer chalcopyrite at 85° C, pH = 1.25. The ferric sulfate concentration varies from 1.37 x 10 -5 molar to 0.392 molar. The effect of ferric sulfate is noticeably different from oxygen in that the plateau value increases with ferric sulfate concentration. Evidently the nucleation and buildup of diffusion layers begins immediately. Also included in figure 16 are results obtained on the same material without ferric sulfate. The plateau value in this case was 1,143 μg/g (Δnp) and the slight increase in the rate beyond the plateau value is due to the presence of oxygen, since all the samples shown in figure 16 were purged with O2. A plot of Δn² versus time is shown in figure 17. The results for 0.392 molar ferric sulfate fit the parabolic equation, but lower concentrations fall off at longer periods of time. The cathodic reduction of iron necessary to balance equation 2 requires the transfer of four electrons according to the reaction
4Fe+³ + 4e- = 4F+²…………………………………………………….(10)
that is, 4 moles of ferric iron are consumed for each mole of copper extracted. Examination of the amount of copper in solution indicates that solution depletion of ferric sulfate is occurring.
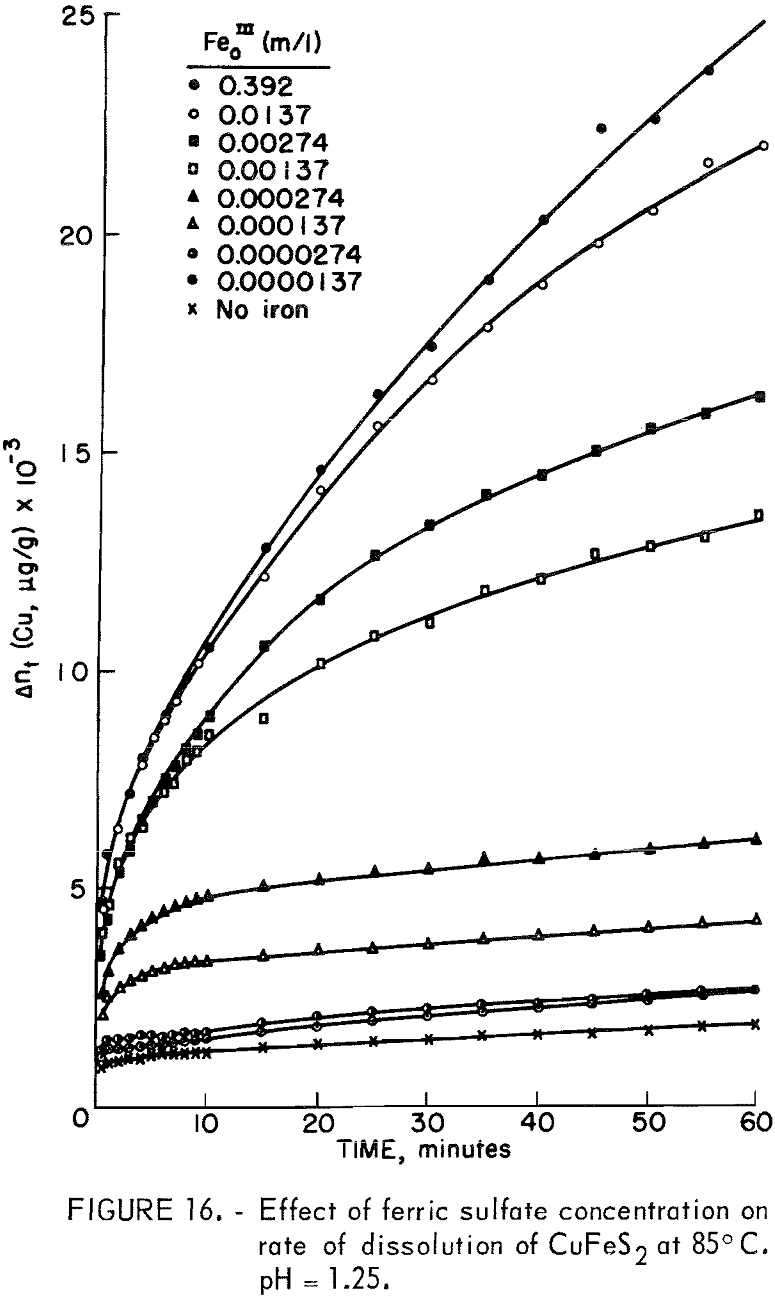
except for tests with an initial concentration of 0.392 molar ferric iron. Ferric ion as an oxidant differs markedly from oxygen. In the case of oxygen, the plateau values remained essentially constant for different oxygen partial pressures (fig. 13). The results shown in figures 7 and 16 for ferric ion indicate the Δnp values increase with ferric ion concentration, which may be attributed to the rapid initial buildup of sulfur diffusion layers.
The kinetic results may be explained using Fick’s diffusion law for ferric ion diffusion inwardly through the sulfur layer:
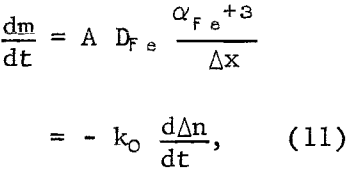
where moles of ferric iron, m, may be related to copper extraction Δn (μg/g) by ko; A is the area; DFe is the diffusion coefficient for ferric ion; αFe+³ is the activity of ferric ion; and Δx is the thickness of the sulfur diffusion layer.
From the stoichiometry of equations 4 and 10
αFe+³ = α (Fe0III) (1 – aΔn) V……………………………………………………………………(12)
where (Fe0III) is the initial ferric ion concentration including sulfate and hydroxyl complexes, and α contains the ferric ion activity coefficient and appropriate equilibrium constants relating (Fe0III) to the true ferric ion activity. The term a is not an arbitrary constant but is given by the relation
a = 4w/VMcu x 10 -6……………………………………………………………(13)
where 4 refers to the stoichiometric ratio of iron to copper, w is the weight of sample used in a volume of V liters, Mcu is the molecular weight of copper, and 10 -6 converts micrograms to grams Also, if copper is produced anodically according to equation 4 the thickness will vary directly with Δn, or Δx = bΔn. The quantity b is given by,

where Ms is the molecular weight of sulfur and P is the effective density of the sulfur layer. Equation 14 neglects variation of surface area with amount reacted, which is small for the degree of dissolution under these conditions. Equation 11 now becomes

which, upon integration for the condition Δn = 0 when t = 0, becomes

where kp = 2a(Fe0III)V DF eA/b ko. Figure 18 is a plot of the left-hand portion of equation 16 or F versus time, showing the linear correlation for the four highest ferric sulfate concentrations. All other concentrations were so low that essentially all the ferric iron was consumed in less than 4 minutes during the initial rapid extraction. The break at approximately 7 minutes probably is due to the fact that initially the sulfur covers anodic sites only and must reach a thickness sufficient to cover both anodic sites and cathodic sites uniformly to become diffusion controlled. If it is assumed that the sulfur layer is fully formed by time to, equation 15 may be integrated for the condition Δn = Δno when t = to, giving

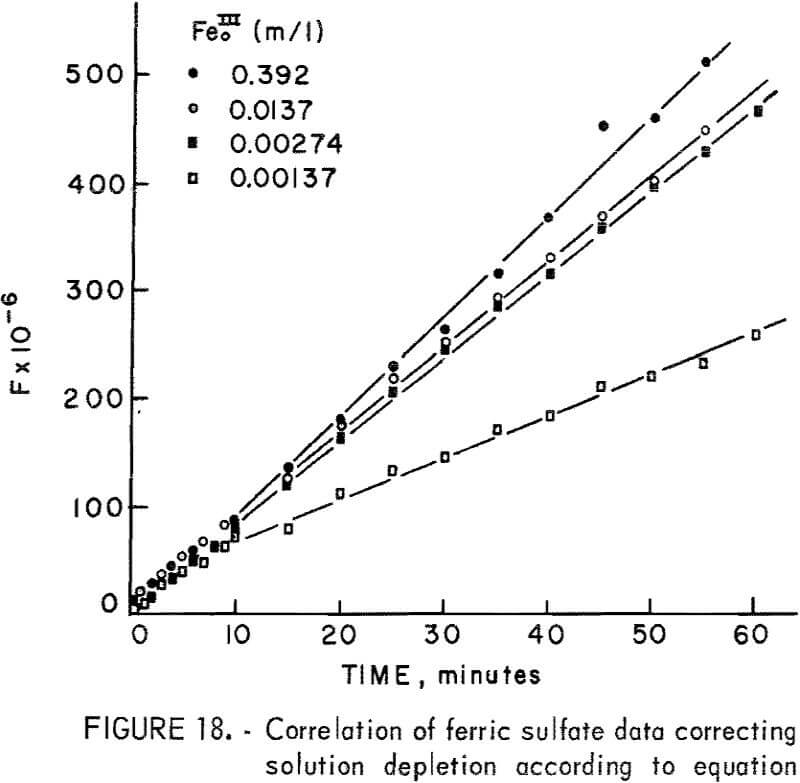
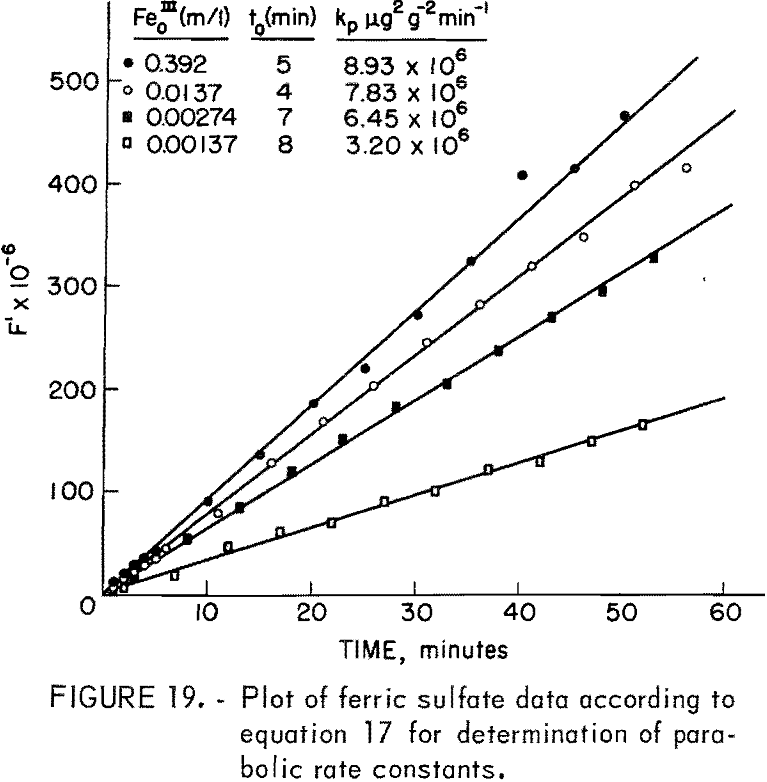
Figure 19 presents F’ versus time for the four highest ferric ion concentrations from which the parabolic rate constants may be readily determined. The parabolic rate constants for lower concentrations were approximated from initial slopes of Δn² versus time plots.
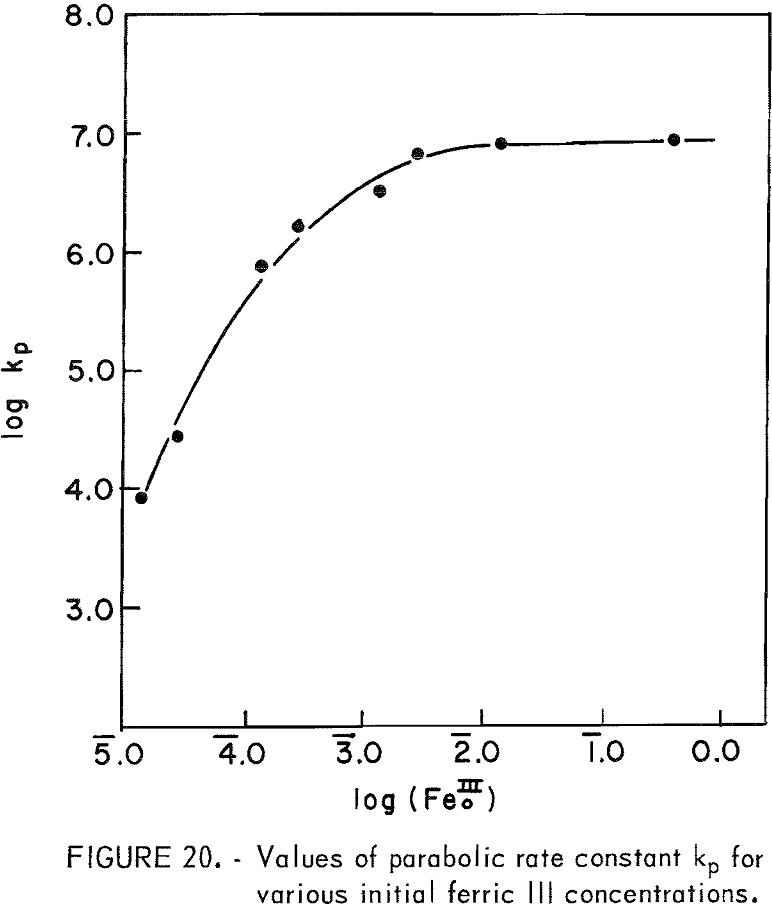
Figure 20 presents the measured kp values for various concentrations, (Fe0III). The rate constant increases and levels off for concentrations above approximately 0.01 molar. Dutrizac, MacDonaId, and Ingrahm reported similar results using synthetic chalcopyrite. This was interpreted by these investigators to represent a change from ferric sulfate diffusion inward for concentrations below 0.01 molar to diffusion of ferrous sulfate outward for higher concentrations. The rate constants in this study may be compared to those of Dutrizac, MacDonald, and Ingrahm using the geometric surface area and similar concentrations. At 85° C and 0.11 molar (Fe0III) the rate constant for synthetic chalcopyrite was 19.6 mg² cm -4 hr-¹. In this study reported kp values include the area which for the 20-micrometer sample is a geometric area of 2,100/2.8 = 750 cm²g-¹. The kp value at 0.11 molar Fe0III is 8.7 x 10 6 μg²g-²min-¹, which is equivalent to 9.28 x 10 -4mg²cm 4hr-¹. Therefore, under these
conditions synthetic chalcopyrite has a rate constant approximately 2 x 10 4 greater than the natural Transvaal chalcopyrite used in this study. These results illustrate the striking difference observed for chalcopyrite from various sources.
Using the data at 27° C (fig. 7) and 85° C (fig. 16), the experimental activation energy ΔE was calculated to be 20.3 ± 5 kcal/mole. The involvement of the initial process plus development of uniform surface layers of sulfur makes exact evaluation of the activation energy difficult. It is of the order measured by Dutrizac, MacDonald, and Ingrahm. Just why the activation energy for diffusion through the sulfur layers is so large is not apparent, but must be related to the nature of the deposit formed. Basic iron sulfates may be deposited concurrently with elemental sulfur. Mixed layers of sulfur and basic iron sulfates have been observed to form during oxygen absorption through thin liquid films on wetted chalcopyrite surfaces. Once formed, these basic iron sulfates may essentially passivate the chalcopyrite surface to further oxidation by oxygen.
The leveling off of the kp value at high concentrations as shown in figure 20 may be attributed to the formation of ferrous sulfate complexes in solution. The important sulfate complexes are FeSO4+ and Fe(SO4)2- and are strongly favored thermodynamically. The equilibrium equations for these complexes are,

The values of K1 and K2 are approximately 10+4.2 and 10+6.4, respectively, at 25° C. At pH = 1.25, the mass balance equations for total ferric iron, Fe(III), and total sulfate, SO4(II) are approximately given by
Fe(III) = Fe+³ + FeSO4+ + Fe(SO4)2- = m………………………………………………(20)
SO4(II) = HSO4- + FeSO4+ + 2Fe(SO4)2-………………………………………(21)
also SO4(II) = 3/2 m + y……………………………………………………..(22)
where iron is added as Fe2(SO4)2 and y is the sulfate added as H2SO4 or some other form. Combining equations 18, 19, 20, and 22 results in an expression for the activity of ferric ion in solution,

where γ± is the mean activity coefficient of ferric sulfate. Since the kp values include αFe+³ it is apparent that as m increases the value of kp will approach a maximum. Equation 23 also predicts that the activity of ferric ion will diminish for large additions of sulfate. These results explain the effect of large concentrations of ferrous sulfate in reducing the rate of leaching of synthetic chalcopyrite as reported by Dutrizac, MacDonald, and Ingrahm. Sulfate added as ferrous sulfate increases and actually lowers the activity of ferric iron.
Dissolution of Chalcocite and Covellite in Sulfuric Acid Media
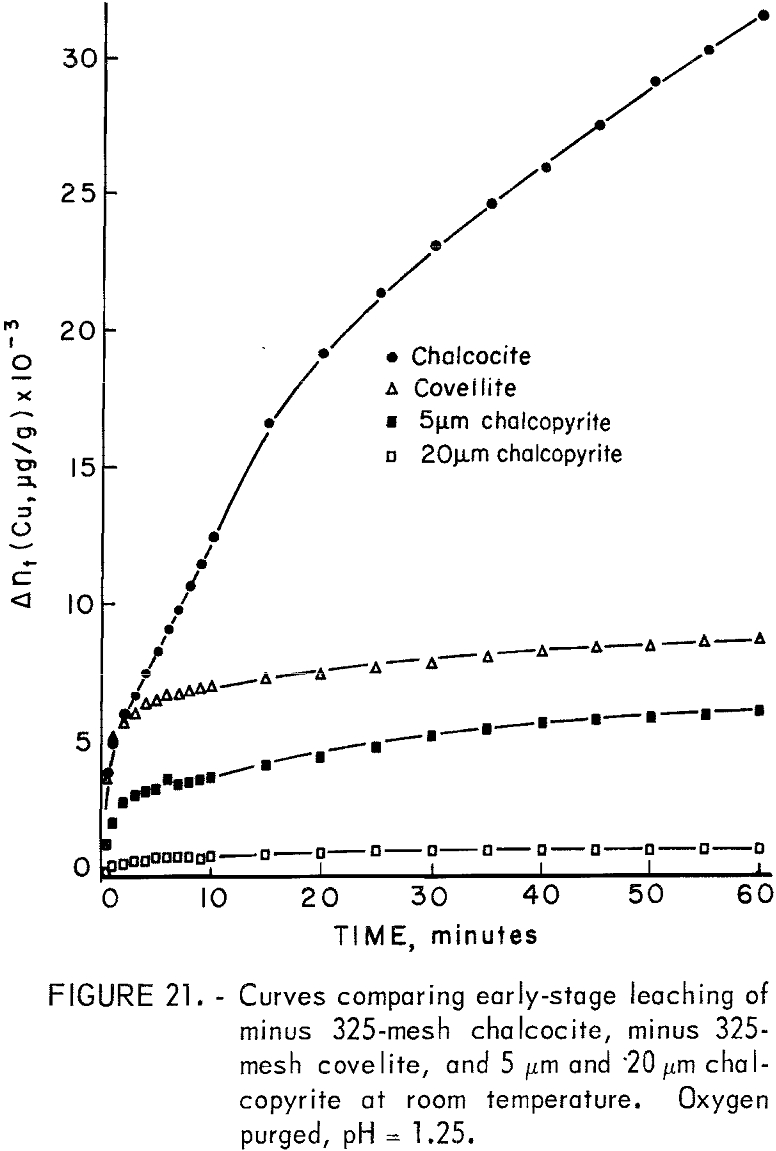
One sample each of minus 325-mesh natural covellite from the Cashin properties in Colorado and minus 325-mesh natural chalcocite from the New Cornelia mine of Ajo, Ariz., were neutron irradiated in the usual manner and subjected to specific leaching experiments using 0.5 g of mineral in 500 ml of solution. Time limitations permitted only a cursory examination, but some of the results warranted inclusion for the purpose of comparison. Figure 21 shows some comparison of the early stage leaching of chalcocite, covellite, and chalcopyrite in 0.1 N sulfuric acid at room temperature using an oxygen purge. Chalcopyrite samples of 5 and 20 micrometers were chosen for comparison because no dissolution rate data were available for minus 325-mesh material.
The increased solubility of chalcocite is immediately apparent. Also apparent is the similarity between the shapes of the covellite and chalcopyrite curves, while the chalcocite curve is nearly parabolic. Chalcopyrite dissolution kinetics did not become parabolic until temperatures in excess of 90° C were attained when oxygen was the oxidant.
Chalcocite has been reported to form CuS during initial leaching followed by the formation of elemental sulfur during a second stage when acidic ferric sulfate is used at low temperatures and if oxygen is used at elevated temperatures. Fisher and Roman found that in oxygenated sulfuric acid at room temperature, CuS was the final product with Cu2-xS formed as an intermediate product. Thomas, Ingraham, and MacDonald found digenite to form as an intermediate using ferric sulfate solutions. The results reported here indicate CuS does dissolve under these conditions but at a relatively slow rate. The predominant anodic reactions for the dissolution of chalcocite under these conditions are accordingly
Cu2S = Cu2-x S + xCu+² + 2x e-…………………………………………………………(24)
and Cu2-xS = CuS + (l-x)Cu+² + 2(l-x) e-…………………………………………..(25)
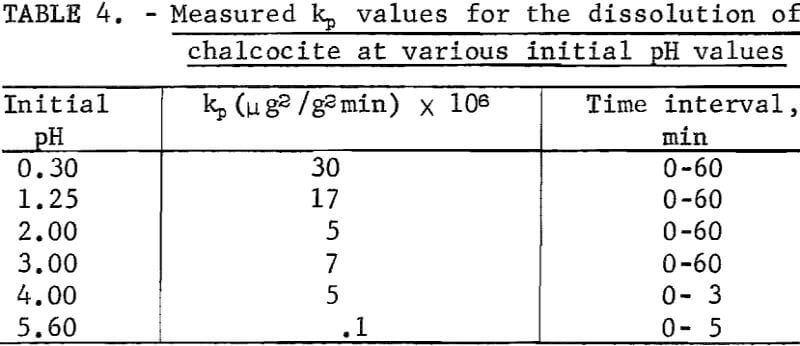
It is surprising that the kinetics are parabolic since it would be suspected that if a CuS layer is formed on the Cu2S, cathodic reduction of oxygen could occur at the CuS solution interface due to conduction of electrons through the CuS layer as suggested. This would result in linear rather than parabolic kinetics unless voltage effects as shown below are operative. Table 4 lists the measured parabolic rate constant kp measured for various pH values. It is evident that the rate is sensitive to pH. This was similarly noted by Fisher and Roman, who reported the rate to be directly proportional to hydrogen ion concentration and oxygen pressure. Outward diffusion of copper through the CuS layer may be considered to be rate controlling, but this would not account for the hydrogen ion and oxygen concentration effects.
As indicated previously, an alternative explanation for an approximate parabolic rate law results if charge transfer is rate controlling and the mineral potential E varies in such a way as to approximate parabolic kinetics. If the slow step is the cathodic discharge of oxygen involving hydrogen ions at the CuS-solution interface, the slow step may be represented by

where kc’ is the rate constant when E = 0, zc is the total charge transferred for the discharge of each oxygen atom, n is the number of electrons transferred in the charge transfer process, F is the Faraday constant, a is the transfer coefficient, and I is the current density per unit of area. If the reaction at the Cu2S-CuS interface is near equilibrium, the potential of the sulfide particle may be controlled by
Cu2S = CuS + Cu+ + e-………………………………………………………….(27)
The cuprous ion would be oxidized to the cupric state as it diffuses from the surface and reacts with oxygen in the solution, but there would be essentially no copper ion gradient since oxygen discharge is rate controlling. Consequently, the cuprous ion concentration within the CuS pores near the Cu2S-CuS interface (Cu+)s would be essentially the same as the bulk cupric ion concentration or (Cu+)s ~ (Cu+2). If these approximations are correct, the mixed potential E would be approximately that established according to the E0 of equation 27, or
E ~ E0 = Eo° + log (Cu+)s……………………………………………………..(28)
The current density I is related to Δn by

where k’ contains the necessary stoichiometry factor and conversion factors to give the rate in μg g-¹ min-¹. Equations 26, 28, and 29 may be combined, giving

Equation 30 may be integrated giving the rate equation
![]()
which would be parabolic if αn ≅ 1. Equation 31 neglects surface area variation, which is small for the extent of the reaction completed in these studies. The hydrogen ion dependence may be explained if an intermediate such as HO2 is formed by an initial, rapid, single-electron transfer process. Such an inter¬mediate has been proposed by Latimer and Huffman and Davidson for oxygen reduction by ferric ion and by Fisher and Roman for oxygen reduction in the dissolution of Cu2S.
According to the above model, the relatively rapid dissolution of chalcocite results from the discharge of oxygen at the CuS solution interface with conduction of electrons through the CuS product layer. The Cu2S-CuS interface equilibrium controls the potential of the CuS. Once the Cu2S has reacted, the CuS will react, yielding Cu+² and S° layers through which the oxidant must diffuse. This reaction is slow as is evident in figure 21, explaining why CuS was reported as the final product by Fisher and Roman.
Effect of Metallic Additions on the Dissolution Mechanisms of Chalcopyrite
Cathodic reactions of sulfide minerals have not received much attention even though they appear to have some interesting hydrometallurgical applications. One-half-gram samples of three finely divided metal powders (silver, copper, and iron) were added to ½-gram samples of 20-micrometer chalcopyrite in the usual experimental procedure. The standard electrode potentials are
Ag+ + e- = Ag°
Eh° = 0.799 v
Cu+² + 2e- = Cu°
Eh° = 0.340 v
Fe+² + 2e- = Fe°
Eh° = 0.409 v
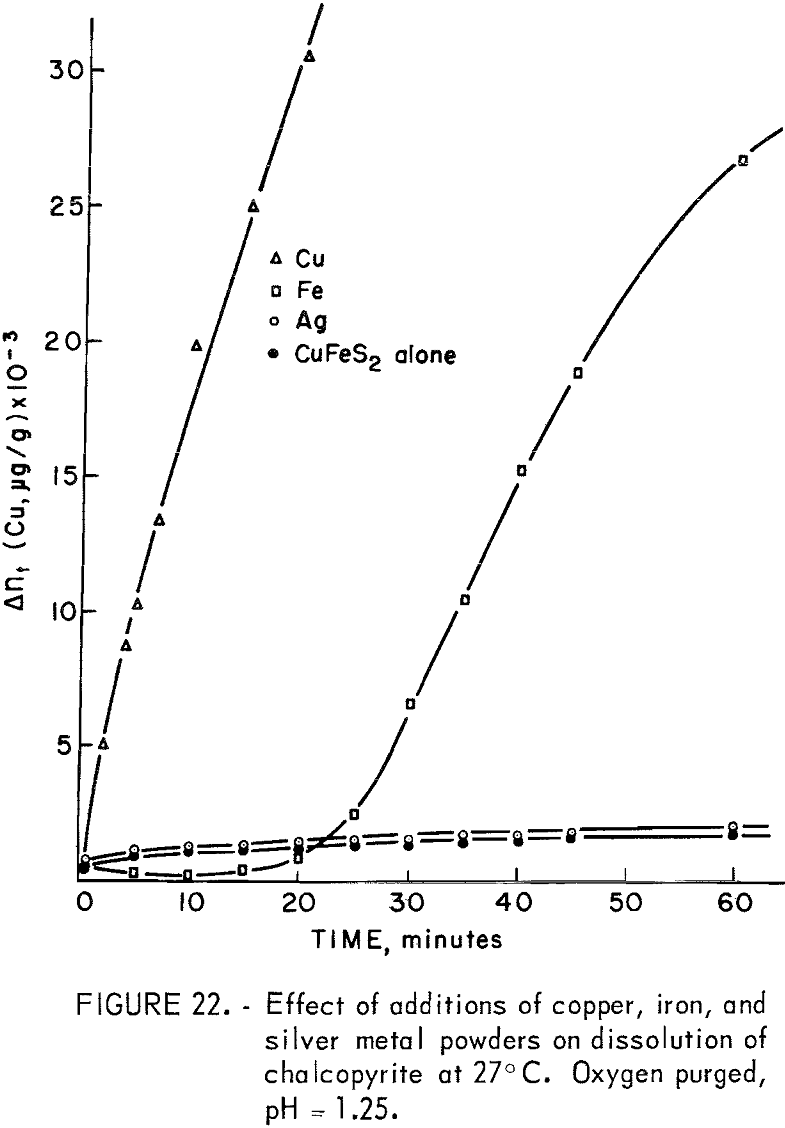
The silver couple is more positive, copper somewhat less positive, and iron much less positive than chalcopyrite, whose best value for Eh was found in this study to be 0.462 volt. Majima has reported the rest potential to be 0.56 volt versus S.H.E. (Saturated Hydrogen Electrode). As shown in figure 22, in which the dissolution curves for the metal additions are compared with that for no additions, the presence of silver metal produced practically no increase in the amount of copper dissolved. This is as expected because the couple Ag°|CuFeS2 would only increase the anodic voltage of the chalcopyrite to a value somewhere between 0.462 and 0.799 volt, and the mechanism would still be surface and difussion controlled. A marked increase in the dissolution of chalcopyrite is experienced when the anode voltage is increased to the point of discharge of oxygen by the oxidation of water and the consequent increase in oxygen concentration on the mineral surface. The presence of argentous ion in the solution, on the other hand, produced striking effects because of the exchange mechanism existing between lattice copper ions and solution silver ions resulting in the probable formation of argentite with copper going into solution. The slight solubility of silver in weak sulfuric acid probably accounts for the lack of enhancement of anodic dissolution in the experiment of figure 22.
Metallic iron additions produced a decrease in copper concentration for about 10 minutes followed by a rapid increase after about 30 minutes, as shown in figure 22. The iron has a lower potential than chalcopyrite
producing on contact a negative overpotential causing the chalcopyrite to react cathodically according to the equation
2CuFeS2 + 2e- = Cu2S + 2Fe+² + 3S-²……………………………………………..(32)
The S-² in the presence of H+ will form H2S according to the reaction
3S-² + 6H+ = 3H2S……………………………………………………..(33)
The anodic reaction is
Fe° = Fe+² + 2e-…………………………………………………….(34)
giving the overall reaction
2CuFeS2 + 6H+ + Fe° = Cu2S + 3H2S + 3Fe+²……………………………………….(35)
which is favored thermodynamically.
The initial copper concentration probably results from the usual anodic dissolution of CuFeS2. The decrease in copper results from reaction with H2S to form covellite, and from cementation on the metallic iron. A strong odor of H2S was evident for over 30 minutes. The evolution of H2S would continue until the CuFeS2 is essentially completely reacted according to equation 35. Particles reacted completely to Cu2S would be expected to dissolve anodically in the usual manner according to equations 24 and 25 producing CuS and copper in solution. Copper released to solution would precipitate as CuS until the H2S concentration was low enough to allow copper ion buildup in solution as noted in figure 22.
The rate beyond 30 minutes is parabolic with a parabolic rate constant kp = 24.5 x 10 6 (µg/g)² per minute, which is in good agreement with the value of 17 x 10 6 (µg/g)² per minute found at pH 1.25 for the Ajo chalcocite.
The effect of copper metal addition is complicated by the existence of the exchange mechanism between lattice and solution copper ions. Neglecting the exchange one may write the following reactions:
Cu° = Cu+² + 2e- (anodic)…………………………………………………….(36)
2CuFeS2 + 2e- = Cu2S + 2Fe+² + 3S-². (cathodic)……………………………(37)
The formation of H2S is suppressed by the preferred solution reaction involving cupric ion and sulfide ion, namely
3Cu+² + 3S-² = 3CuS………………………………………………….(38)
The immediate release of copper to solution as indicated in figure 22 indicates that the anodic reaction of Cu2S and metallic copper is rapid enough, in the presence of oxygen, to suppress the formation of H2S. The Cu2S formed is converted to CuS so that the overall reaction is
2CuFeS2 + 6Cu° + 3 O2 + 12 H+ = 2Fe+² + 4CuS + 4Cu+² + 6H2O………………………..(39)
which is strongly favored thermodynamically. In the absence of oxygen, sulfides of copper will form without copper extraction, but with the formation of H2S according to the reaction
CuFeS2 + 2H+ + Cu° = Cu2S + Fe+² + H2S…………………………………………(40)
According to equation 39, one-fourth of the total copper reacted is copper-64, since the metallic copper is nonradioactive. If the nonradioactive copper exchanges rapidly with the copper-64 in the CuFeS2, Cu2S, and CuS lattices, the concentration of copper-64 will be 2.5 times as great in solution as it would be if the exchange reactions did not occur. The data of figure 22 are parabolic, giving an apparent kp of 129 x 10 6 (μg/g)² per minute. However, this rate is too large by a factor of (2.5)². The true parabolic rate constant is thus approximately 20 x 10 6 (μg/g)² per minute, which compares well with the 17 x 10 6 (μg/g)² per minute for Ajo chalcocite, indicating that the overall kinetics are controlled by the anodic dissolution of Cu2S.
Theoretical Considerations
From the results of this study it appears that charge transfer processes for the anodic dissolution of chalcopyrite are not rate controlling. This undoubtedly is due to the buildup of product layers consisting of elemental sulfur and basic iron sulfates codeposited on the chalcopyrite surfaces. Transport through these layers, therefore, may be represented by parabolic rate equations once these layers have completely covered the mineral surface and are sufficiently thick. Electrochemical processes at interfaces occur and undoubtedly are important to the overall process explaining the measurable uptake of oxygen at room temperature as long as electrolyte is present. For thin films using oxygen as an oxidant, surface reactions are involved in the rate-control process.
A generalized equation for the dissolution process should include both film transport plus surface reactions for which charge transfer may or may not be rate controlling. Using oxygen as an example, the net cathodic reaction is
O2 + 4H+ + 4e- = 2H2O…………………………………………………………(41)
The net current flow would be given by Fick’s law

where I is the cathode current density, z is the number of electrons transferred for each oxidant species reacting, Δx is the thickness of the diffusion boundary, C0 is the concentration of oxidant in the bulk solution, and C0s is the concentration of oxidant at the mineral film interface. At the surface, the oxidant will react to form intermediates through a series of processes which may or may not involve charge transfer. In the case of oxygen a series of intermediates form such as H2O2 and HO2 and charge transfer has been postulated to involve a series of single electron processes at metal surfaces. Discharge of oxygen is relatively slow probably due to the breaking of the oxygen-oxygen bond. Under steady state conditions a series of first-order processes may be treated by a random-walk solution. The results observed in this study may be explained by considering two surface reactions, one of which does not involve charge transfer and one of which does. These may be represented by

Equation 43 represents a chemical reaction near the surface forming an intermediate C1, chemisorption on the mineral surface, or some chemical reaction following adsorption. Equation 44 represents the reaction of intermediate C1 to form intermediate C2 by a charge-transfer process. Equations 42, 43, and 44 may be combined, giving

The voltage E is the mixed potential, which is the potential resulting when the sum of all anodic and cathodic currents is zero. If the random-walk solution is applied for all processes for the complete reaction,
CuFeS2 + O2 + 4H+ = Cu+² + Fe+² + 2S° + 2H2O………………………………………(46)
the numerator of equation 45 becomes -C0 [1 – exp (ΔG/RT)], where ΔG is the overall free energy for the process. Since ΔG has a large negative value, equation 45 becomes

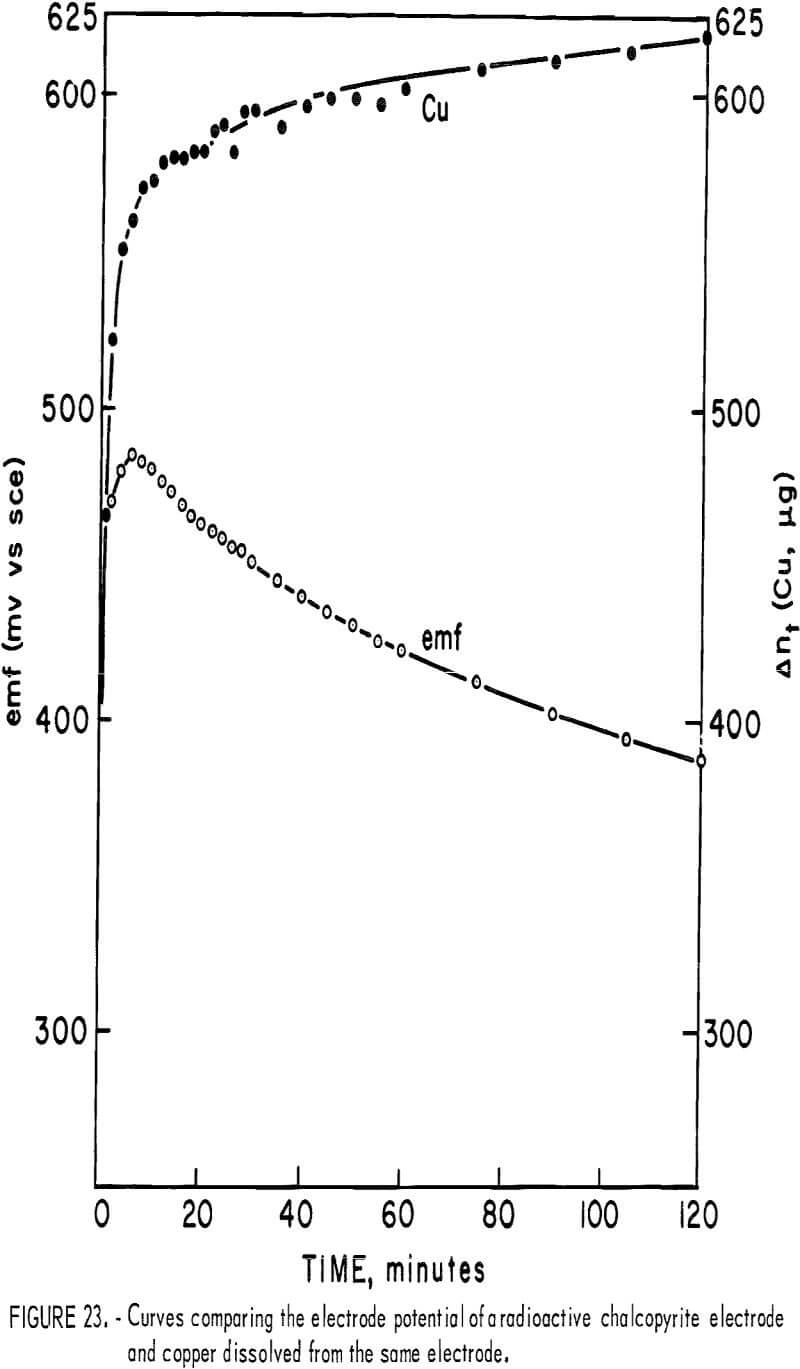
In order to evaluate the influence of potential on the observed kinetics, it was necessary to measure E during the course of the reaction. A radioactive electrode was made using a piece of massive chalcopyrite machined to cylindrical shape with a diameter of 1.25 cm. It was mounted in a quartz tube using epoxy cement and one flat surface was exposed as the electrode surface. It was finely polished and placed in 85 ml of 0.1 N sulfuric acid. The solution was stirred while exposed to air and the potential versus a standard calomel electrode was recorded versus time.
Figure 23 illustrates the voltage-time plot, including the simultaneous amount of copper dissolved from the electrode. Typically, the potential increases for the first 4 to 8 minutes, passing through a maximum just before the observed plateau for copper extraction. Following this, the potential diminishes. Vetter and Sato have considered the potentials of nonstoichiometric oxides and sulfides that are electron conductive. If the chalcopyrite changes in composition during reaction, its activity will change. For chalcopyrite this may be represented by the equation

where α’m and αm are the surface activities of the mineral, αm, xy, αm,ij respectively. The formation of a defect surface layer implies a negative energy contribution which would cause the potential E to increase. Thus, initially, both the buildup of metal ions in solution and the formation of a defect structure would produce an increase in E. This potential would be expected to become dependent only upon the metal ion concentration once the defect layer assumes a constant steady-state composition for which α’m = αm and x = y. The maximum in the potential time curve is attributed to the formation of the diffusion layer, which is enough in 4 minutes to affect diffusion of oxygen to cathodic cites.
If the mineral is considered as a reversible electrode that is in equilibrium with its immediate environment at the chalcopyrite-sulfur interface, the mixed potential would then simply reflect a polarization overpotential resulting from diffusion of oxygen inward and copper outward. This is clearly not the case, since an increase in Δnt must be associated with an increase in the surface concentration (Cu+²)s. Accordingly, the potential would increase. The decrease in potential indicates cathodic control beyond the maximum of the E-time curve. Considering the cathodic reduction of oxygen according to equation 41 the potential may be related to the surface concentration (H+)s and (Po2)s where

Sato measured Eh and pH values of natural mine waters of sulfide ore bodies and concluded the values observed were controlled by the hydrogen peroxide-oxygen gas couple
H2O2 = O2 + 2H+ + 2 e-………………………………………………….(51)
for which, at room temperature,
Eh = 0.682 – 0.059 pH + 0.0295 log Po2/H2O2…………………………………(52)
It also was observed that the mine waters from various oxidized sulfide zones had pH values which, in general, followed the Eh-pH lines for constant PO2:(H2O2) ratios. An essentially constant ratio may result if H2O2 is in equilibrium with oxygen as it passes through a sequence of steps as proposed by Latimer, but in steady state

Each step involves a proton in a 1-electron transfer process. The ratio of oxygen to hydrogen peroxide would remain essentially the same even if the pH changes, since each step in the process has the same hydrogen ion dependence. The actual rate controlling step would thus involve the breaking of the oxygen-oxygen bond of H2O2 rather than charge transfer, as follows:
H2O2 → 2OH (slow)……………………………………………………..(54)
OH + H+ + e- = H2O (fast)……………………………………………(55)
The observation that the linear rate process is potential independent as indicated by equation 52 may result from the adsorption of oxygen and H2O2 on the chalcopyrite surface. This is suggested by the k1 versus Po2 curve of figure 15, which resembles a Langmuir type I adsorption isotherm.
Using the data of figure 23, at the maximum for a pH = 1.3 (the initial solution pH) the calculated [Po2:(H2O2)]s ratio is 1.32. If this ratio remains constant, the decrease of potential from Eh = 0.727 at the maximum to Eh = 0.629 at 120 minutes would correspond to a pH change from 1.3 to approximately 3.0. This represents the interfacial ph and suggests the slow iron release beyond the plateau as shown in figure 5 as being due to the simultaneous formation of basic iron sulfates and elemental sulfur.
Equations 47 and 52 may be combined where Eh = E and concentrations are surface values. Assuming α ~ 0.5 and n = 1, the combined equations give

where Eoc = 0.682 for the hydrogen peroxide gas couple. If the ratio of oxygen to hydrogen peroxide remains essentially constant the decrease in E results from a decrease in (H+)s. The exponential term of equation 56 will become vanishingly small, so that the rate becomes

where ko’ includes cathodic surface area and appropriate conversion units. Equation 57 upon integration becomes the Wagner-Grunewald equation, equation 9.
Conclusions
- In considering various oxidants other than oxygen, such as Cr2O7-², H2O2, and Fe+³, the kinetics are controlled by the inward diffusion of oxidant and the resultant rate is related to the number of electrons involved in the total charge transfer process.
- In the case of oxygen the rate is uniquely slow and involves both inward diffusion and surface reactions. The rate-controlling surface reaction does not involve charge transfer since it is potential independent. The experimental activation energy for diffusion was determined to be 10.2 kcal/mole and for the surface reaction 12.5 kcal/mole.
- The kinetics of ferric ion oxidation follow parabolic kinetics and may be correlated with solution depletion. The parabolic rate constant varies with the activity of ferric ion, which approaches a maximum owing to the formation of sulfate complexes.
- Chalcopyrite will react cathodically with suspended particles having more negative potentials. Iron and copper additions resulted in rapid conversion of chalcopyrite to chalcocite increasing the rate of reaction to that of the intermediate chalcocite formed.
- Chalcocite kinetics show a strong pH dependence, while chalcopyrite kinetics are essentially independent of pH between 1 and 2.5.
- A rapid initial reaction rate follows first-order kinetics and may be explained as being due to the formation of a surface defect structure or dissolution of surface oxides. During this initial period iron is removed from the sample at a faster rate than copper.
- Voltage-time measurements during leaching show a maximum. The increase in potential is cathodically controlled. The decrease in potential may be explained by the reduction of oxygen, with the formation of hydrogen peroxide as an intermediate.
- The kinetics observed do not involve charge transfer processes in the rate-controlling steps. The overall kinetics may be explained as a series of potential independent and potential dependent reactions. Rapid depletion of H+ at the surface lowers the voltage increasing the rate of the cathodic charge transfer process so that other nonpotential sensitive reactions are rate controlling.
It is postulated that codeposition of basic iron sulfates with elemental sulfur accounts for the slow leaching of chalcopyrite. Oxygen is uniquely slow probably because of the breaking of the oxygen-oxygen bond.
