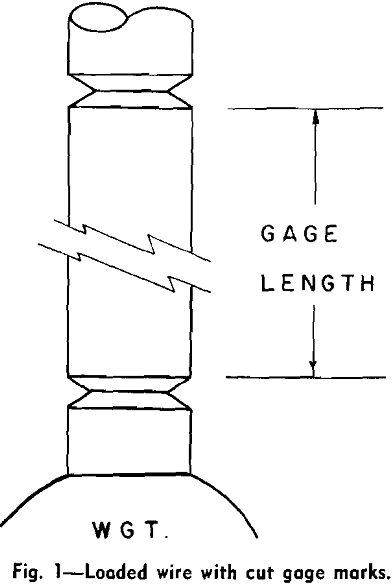
In the original Udin, Shaler, and Wulff technique for measuring the surface tension of copper, variously weighted wires were allowed to extend or contract in a copper cell held at elevated temperatures in vacuum. By plotting stress vs. strain for a wire array in one test, the stress at zero strain is obtained. This is the point where the contractile forces resulting from surface tension are balanced by the applied load, according to the expression:
![]()
where γ is the surface tension in dynes per cm; σε=0, the stress at zero strain in dynes per cm; and r, the radius of the wire in cm.
The presence of grain boundaries in the wires requires a correction to the original expression used. Thus:
![]()
where, n/l is the number of grain boundaries per unit length, and a, the ratio of grain boundary tension to free surface tension.
After cutting in the gage marks, each wire of a series of about 12 was differently loaded by welding a gold ball to one end. This was done by dipping the end of the wire in a cooling gold droplet, previously melted on a charcoal block with a No. 2 acetylene torch. The other end of the wire was strung through a hole in a gold lid and twisted over the edge to hold the wires fixed and in suspension from the lid. The lid and mounted wires were then dipped in pure ethyl alcohol to dissolve any skin oils and dirt on the surface of the wires due to handling. Finally the lid was put in place on an alundum crucible lined with gold so that the wires hung freely within the gold-lined chamber. This whole assembly was next heated in a quartz nichrome wound tube furnace and heated for a few minutes at 600°C to soften the wires.


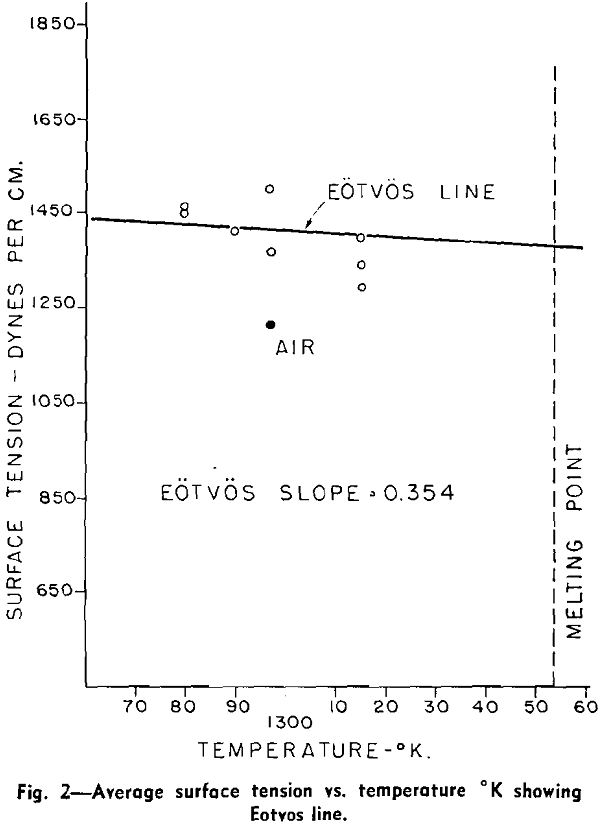
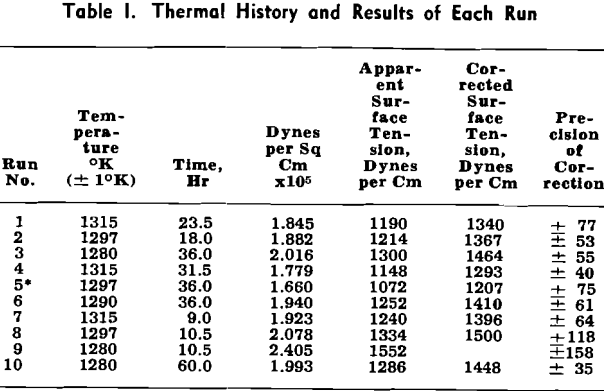
The average value for the apparent surface tension was found to be 1250 ± 50 dynes per cm over the range 1280° to 1315°K. For the corrected value, eq 2 was used, where n/l = 75, and a = 0.300, which together give a correction factor of 0.889. The average corrected value over the same range of temperatures then becomes 1400 ± 65 dynes per cm. The value for n/l was computed from the average grain count with respect to the average annealed gage length of ten randomly chosen wires.
The wires were of the typical bamboo or reed-like structures observed before. An excellent series of micrographs of gold wires appear in a paper by Alexander, Dawson, and Kling, showing kinking, offsetting, and what appears to be bulging. Similar effects were observed in the experiments reported here.
Although there is no reason to believe that the wires will assume the idealized condition, nevertheless any bulge and waist model would necessarily be some approach to the ideal. Only the departure of the actual from the ideal would introduce error into the results of the experiments.


