Adequate values for the standard heats and entropies of formation of silver chloride and silver bromide are available. However, thermodynamic calculations involving these substances have been hampered by the lack of accurate high-temperature enthalpy and entropy data. The enthalpy and heat capacity results reported in the literature are fragmentary and conflicting.
As part of a Bureau of Mines heavy metals program, this report gives the results of precision determinations of enthalpy and derived entropy increments above 298.15° K. Silver chloride was investigated in the range from 298.15° to 1,400° K, and silver bromide from 298.15° to 1,200° K.
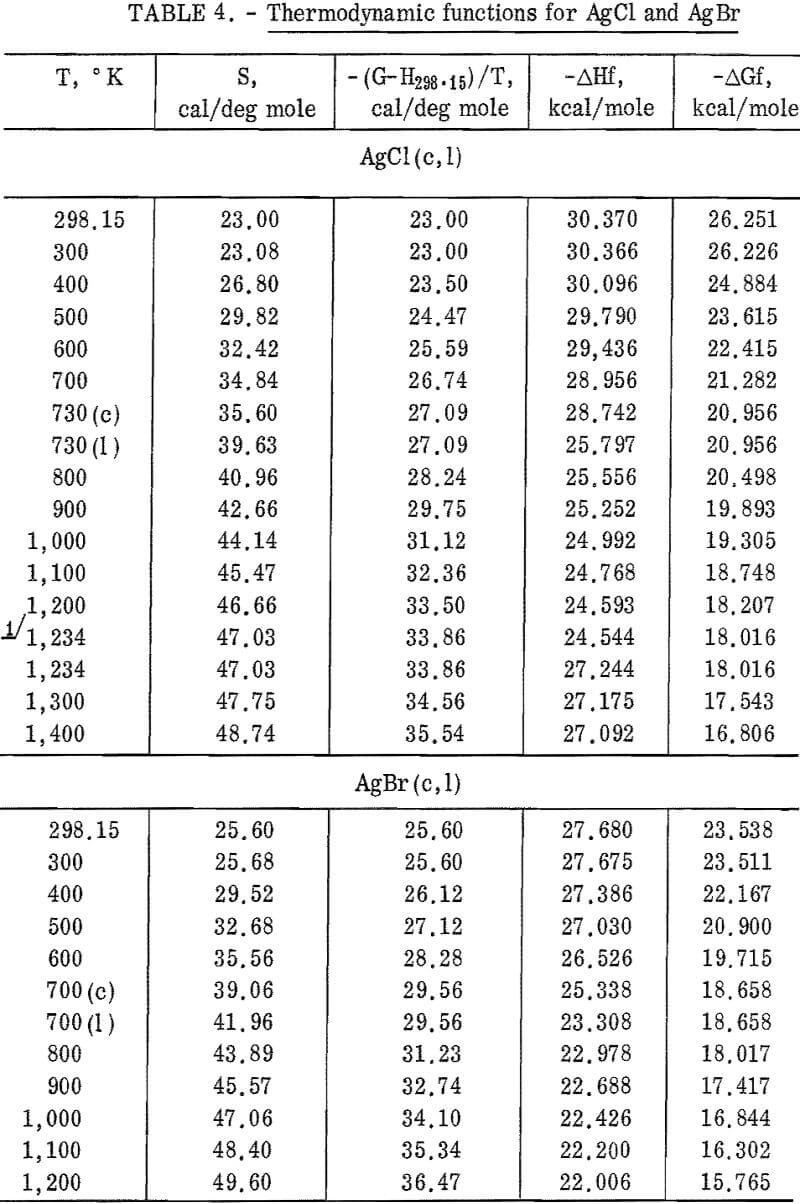
High-temperature heat and free energy of formation values have been calculated and tabulated for both compounds.
Materials
The silver chloride sample was obtained as a reagent-grade powder and the bromide sample as a commercially prepared single crystal. The only impurities, as shown by spectrographic analysis, were 0.01 percent or less of Ni in AgCl and 0.01 percent or less each of Al and Si in AgBr. Their X-ray diffraction patterns matched those in the ASTM Catalog of X-Ray Powder Data.
Measurements and Results
The enthalpy determinations were made with the copper-block calorimeter described by Douglas and King. This apparatus has been modified by replacing the potentiometer and galvanometer with a Guildline type 9176G nanopot and a Keithly model 147 nanovolt meter.
Results of the determinations are expressed in defined calories (1 cal = 4.1840 joules). Molecular weights were calculated from the 1962 Table of Atomic Weights. The international Practical Temperature Scale of 1948 was used throughout. The mass of the AgCl sample used was 7.6116 g. Four AgBr samples, all from the same single crystal, were used during the investigation. The masses of AgBr were 12.6504 g, 13.7634 g, 12,4390 g, and 11.8344 g.
Preliminary tests showed that molten AgCl severely attacks Pt-Rh capsules, which are normally used as sample containers. Therefore, entahlpy determinations of both AgCl and AgBr were made using silica-glass capsules. These containers were not chemically attacked by the halides. The enthalpies of the glass containers were determined in separate experiments.
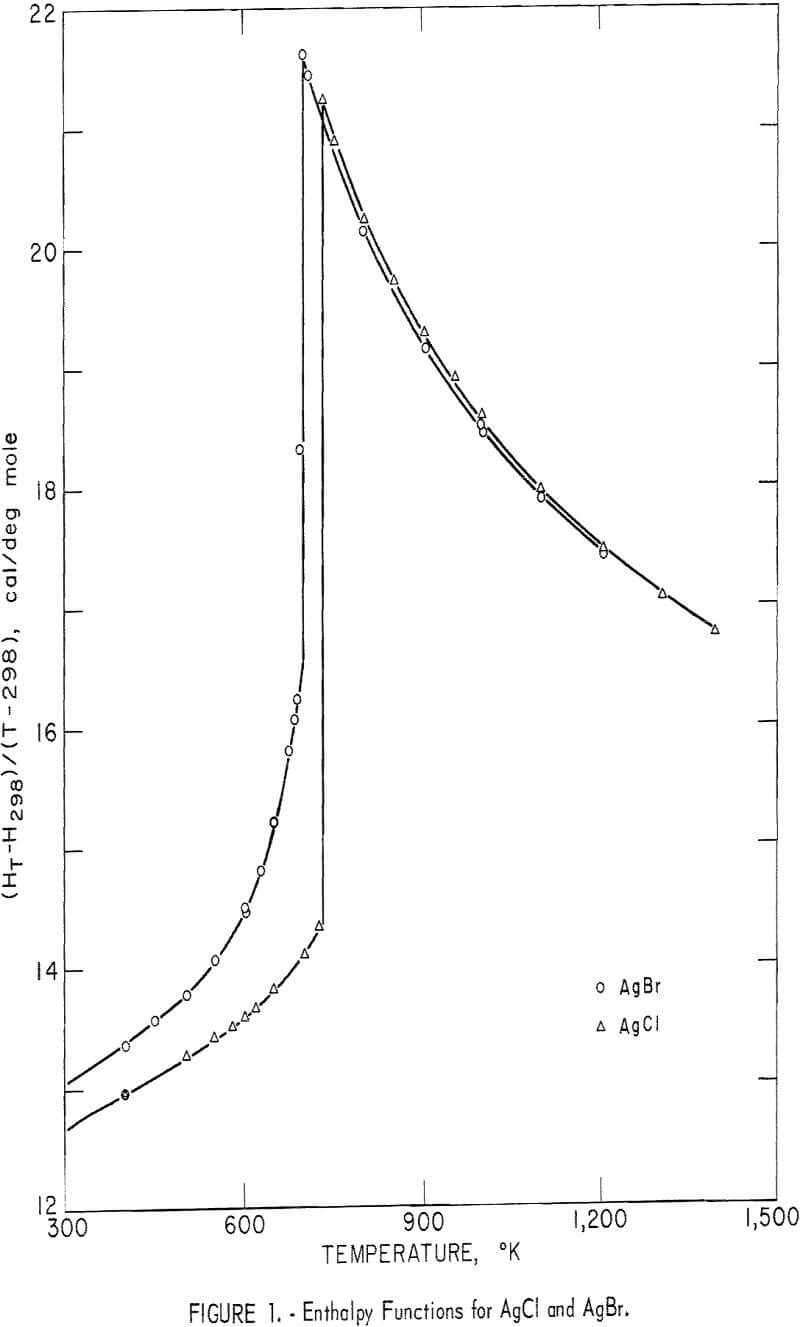
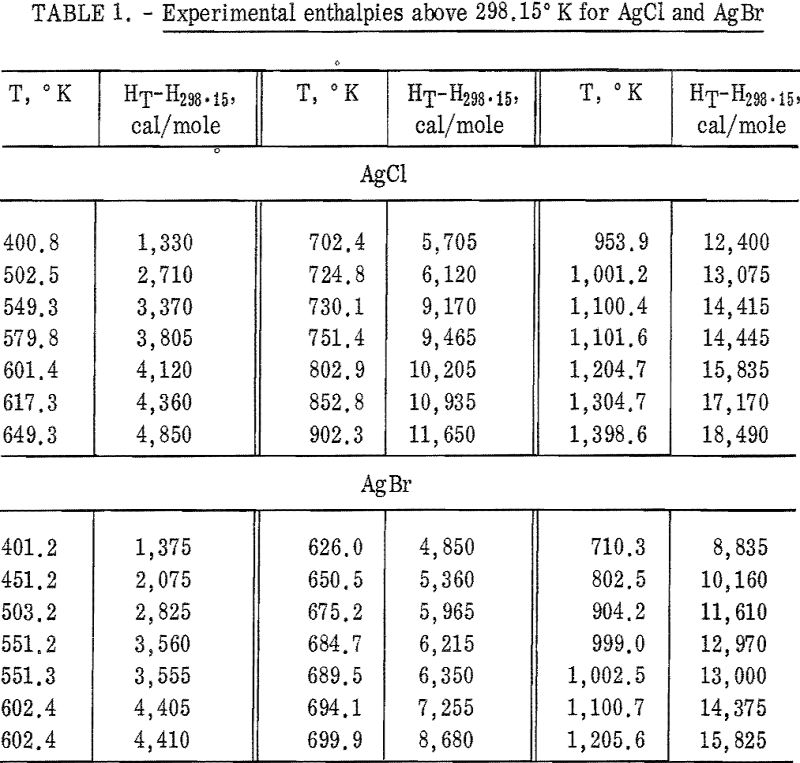
Experimental enthalpy values for AgCl and AgBr are given in table 1. In figure 1 they are plotted against temperature as the function (HT-H298.15)/(T-298.15). The standard error is 0.1 percent for each substance. The absolute uncertainty of enthalpy is estimated to be about 0.3 percent.
Some of the enthalpy determinations of AgBr above the melting point (700° K) resulted in the cracking of four of the silica-glass containers. This effect was caused either by a volume change upon rapid freezing during the dropping process, or by wetting of the container walls with subsequent strain on the container upon freezing. For whatever reason, the cracking occurred inside the calorimeter, so that an adequate number of successful runs were obtained in the liquid range. After clearly establishing the enthalpy curve above the melting point, runs of AgBr were discontinued at 1,205° K.
No similar problem of strain was noted for AgCl. In this case devitrification of the glass container was the temperature-limiting factor. Determinations were carried to 1,400° K for this substance.
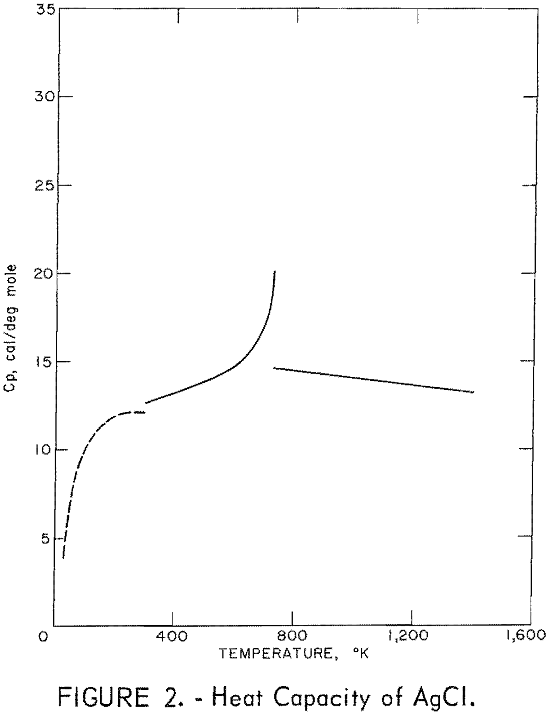
Silver chloride melted at 730° K with a measured heat of fusion of 2,945 cal/mole. Silver bromide melted at 700° K and had a heat of fusion of 2,030 cal/mole. Both samples exhibited an abnormal increase of enthalpy (and, therefore, heat capacity) with temperature below their melting points. This effect has been observed by other investigators. It is associated with lattice defects, which are discussed later in this report. Also, both samples showed decreasing heat capacities with increasing temperature from their melting points to the highest temperature investigated.
Values of the enthalpies relative to 298.15° K at even temperatures are given in table 2 for AgCl and in table 3 for AgBr. Included in these tables are the corresponding entropy increments as well as heat capacity values.
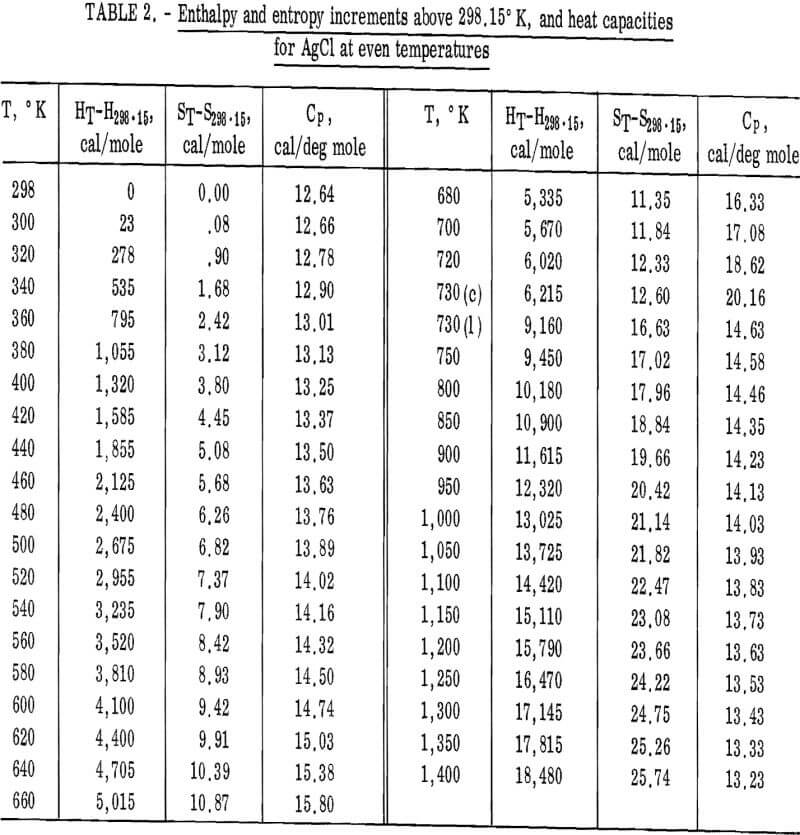
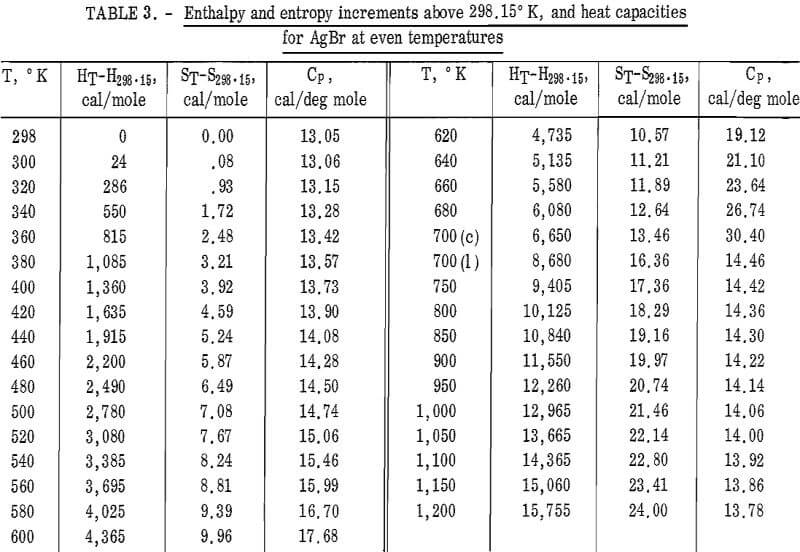
The following equations were fitted to the enthalpy values in tables 2 and 3 by Kelley’s method. The average deviation of these equations from the tabular data and the temperature ranges of validity are given in parentheses.
AgCl(c): HT-H298.15 = 7.19T + 6.33 x 10-³T²
– 1.50 x 10 5 T-¹ – 2,203
(0.1 pct; 298° – 730° K)
(1): HT-H298.15 = 16.17T – 1.06 x 10-³T² – 2,079
(0.1 pct; 730° – 1,400° K)
AgBr(c) : HT-H298.15 = 21.52 x 10-³T² – 8.74T
– 7.96 x 10 5 T-¹ + 3,363
(2.3 pct; 298° – 700° K)
(1): HT-H298.15 = 15.30T – 0.60 x 10-³T² – 1,736
(0.1 pct; 700° – 1,200° K).
The enthalpy and entropy increments given in tables 2 and 3 were combined with other reported thermodynamic data to give the heats and free energies of formation from 298.15° to 1,400° K for AgCl, and 298.15° to 1,200° K for AgBr (table 4). Also calculated and tabulated are entropies and free energy functions. The enthalpy and entropy data for silver metal above 298.15° K were taken from Hultgren, and the 298.15° K entropy was taken from Furakawa and coworkers. The heats of formation at 298.15° K of the halides were taken from NBS technical Note 270-4. Enthalpy and entropy data for Br2(g) and Cl2(g) both were from the JANAF tables. Entropy values given in table 4 are those of this work combined with the 298.15° K values given in the compilation of Kelley and King.
Discussion
Older enthalpy data for these compounds were reviewed and compiled by Kelley. His selected values were derived from data most of which were reported more than 60 years ago. They do not show the anomalous increase in enthalpy below the melting point. Kelley’s enthalpy values differ from those reported here by as much as 2 percent for AgCl and 6 percent for AgBr. Recently, Carre, Pham, and Rolin reported enthalpy data for both halides. They investigated, by drop calorimetry, AgCl and AgBr in the solid and liquid ranges. They did not tabulate their experimental data, so that critical comparison with the present work cannot be made. Their enthalpies are reported as two overlapping equations for each solid, and one equation for each liquid. However, these equations are in disagreement. Also, enthalpies of fusion from Carre’s equations are 1,900 cal/mole for AgCl and 400 cal/mole for AgBr. These values are inconsistent with those given elsewhere in their report as 3,100 cal/mole for AgCl and 2,130 cal/mole for AgBr.
Kobayashi reported heat capacities above 298° K for AgCl. Compared with the data given in this report, his values are 1.3 percent higher at 298° K and 2.8 percent lower at the melting point. The two sets of data cross near 480° K. This agreement between the present values and those of Kobayashi is satisfactory. Here the heat capacity was obtained as a derivative of the enthalpy, whereas Kobayashi measured heat capacity directly.
Kanzaki, Christy and Lawson, and Pochapsky all reported heat capacity data above 298° K for AgBr in the form of small graphs. This presentation of data, used in lattice defect investigations, makes close comparison difficult. Christy and Lawson’s lowest value, near 350° K, is approximately 13.5 cal/deg mole, or about 1 percent higher than the value in table 3. At 600° K their value is about 4.5 percent higher and at the melting point, 15 percent higher. The data of Kanzaki and Pochapsky are in agreement. However, their heat capacity values are generally lower than the other reported values. For example, their heat capacity of the solid at the melting point is near 23.5 cal deg/mole, compared with the present 30.4 cal/deg mole.
Figures 2 and 3 show curves of heat capacity versus temperature. The curves above 298° K in both figures are heat capacities derived from the enthalpy data in tables 2 and 3. The curve below 298° K for AgCl represents the data of Eastman and Milner; the curve below 298° K for AgBr represents the data of Eastman and Milner and of Eucken, Clusius , and Woitinek, who agree closely. No explanation can be readily found for the disparity between the 298.15° K heat capacities reported here and those from the low-temperature data. Experience has shown that the function (HT-H298.15)/(T-298.15) will usually give a reasonable extension of high-temperature enthalpy data to 298° K. For AgCl, this extension gave a heat capacity at 298° K of 12.64 cal/mole. Neither this nor Kobayashi’s value of 12.82 cal/deg mole agrees with Eastman and Milner, whose data provide 12.14 cal/deg mole.
For AgBr, the data of Eastman and Milner and those of Eucken and coworkers are in good agreement with a 298° K value of 12.52 cal/deg mole. However, even with four heat capacity values at 298° K from high-temperature data, no
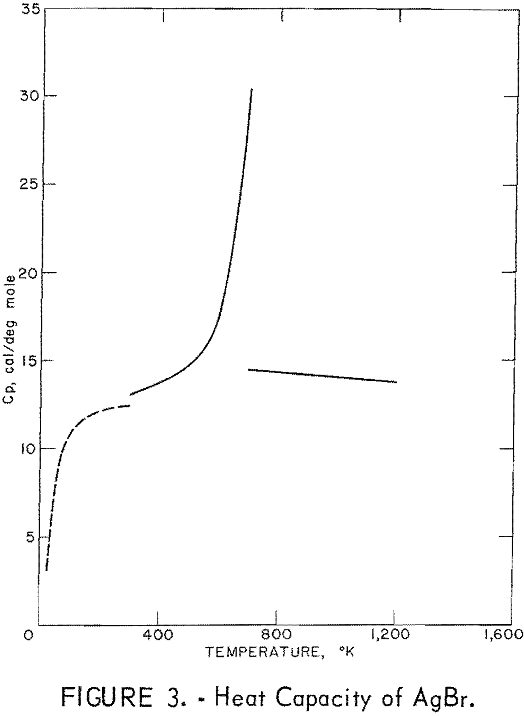
general agreement can be found, Kanzaki and Pochapsky agree with a value near 12.2 cal/deg mole. The heat capacity reported here for AgBr at 298.15° K is 13.05 cal/deg mole. Christy and Laws on reported about 13,5 cal/deg mole. Obviously, further low-temperature heat capacity investigation is needed to establish the heat capacity values at 298° K of both AgCl and AgBr.
Enthalpies may be determined by integrating heat capacity data or, as done in this investigation, by direct measurement. Heat capacity data above 298° K reported in the literature do not agree and therefore do not appear to be suitable for derivation of enthalpies. Directly determined enthalpies previously reported either are from very old work or show inconsistencies that are too great to permit reliable thermodynamic use. Consequently, it is felt that the enthalpies presented in this report are the best available for both compounds in the solid and liquid ranges.
Lattice defects of AgCl and AgBr crystals have been the subject of several investigations. The heat capacity measurements of Christy and Laws on, Kanzaki, and Pochapsky were made primarily to study these defects. Kobayashi, in a later paper, used his data to calculate a heat of activation and a concentration of these defects.
Using the heat capacity data in tables 2 and 3, the Frenkel defect formation enthalpies (ΔHF) can be calculated. For AgCl, ΔHF = 34,800 cal/mole, and the mole fraction defect concentration can be estimated as 8.7 x 10-³ at the melting point. The integrated value of the excess enthalpy at 730° K is 210 cal/mole. Kobayashi reported these values as 35,200 cal/mole, 7.5 x 10-³ and 220 cal/mole, respectively. For AgBr, the present data give ΔHF = 31,900 cal/mole, a mole fraction defect concentration of 2.8 x 10-³ at the melting point, and an excess enthalpy of 900 cal/mole. Christy and Lawson gave 29,400 cal mole, 3.7 x 10-² , and 1,070 cal/mole. Considering the sensitivity of the calculations to the parameters chosen, these values are in good agreement.
