Table of Contents
The principal official test performed by the Bureau of Mines to determine the permissibility of coal-mine explosives, commonly referred to as the gallery test, has been in use at the Bruceton station for many years. In this test the explosive under study is loaded into the borehole of a steel cannon and fired into a flammable mixture of natural gas and air or natural gas, air, and coal dust. To meet the requirements for permissibility, the explosive must not ignite the gas mixture under the conditions of the test. There is little doubt that these tests have succeeded in the main objective, namely, to screen the relatively safe from the relatively hazardous explosives. It has been generally conceded that adoption of permissible explosives by the coal-mining industry in the United States has substantially reduced the frequency of disastrous underground explosions caused by blasting.
In recent years, however, research workers planning programs for improving the safety of coal-mine explosives have felt the growing need of a more quantitative method for measuring the incendivity of explosives based on a better understanding of the role of the important variables in the gallery tests. Accordingly, it was decided to apply certain statistical methods and techniques to the gallery test to develop it into a more precise tool for evaluating permissible explosives. One of the first and more important methods applied for this purpose was the up-and-down technique. It was demonstrated that the weight of the explosive charge directly affects the ignition probability of the natural gas-air atmosphere and that the curve of ignition probability versus charge weight is a cumulative normal curve. Following these experiments, a program, still in progress, was set up to study how the addition of sodium chloride to various permissible-type explosives affects their incendivity. This program resulted in 3,294 shots, yielding enough data to afford a unique opportunity for using statistical methods in establishing the important variables of the gallery test. As the up-and-down design yields approximately equal numbers of ignitions and non-ignitions, a deviation from the expected ignition probability of 0.5 for any particular level of a given variable reflects the effect of that level of the variable on the test result. This principle was basic to substantially all of the statistical analyses of these data in this report. Should there be variables other than the charge weight (which is recognized by prior knowledge as a main variable) that exert a significant effect on the ignition probability, such information is, of course, fundamental. Therefore, the main object of the statistical analysis was to ascertain, from the available body of data, which of the measured variables had a significant effect on the ignition probability of the flammable atmosphere. Identification of these variables and an evaluation of their effects are prerequisite steps for: (a) Reducing the experimental error to provide improved reproducibility of the results, (b) performing the gallery test more economically, and (c) formulating appropriate experimental designs.
It is difficult to describe briefly and lucidly an involved statistical analysis of a relatively complex experiment, such as that in the gallery test. However, to aid the reader, this report deals principally with descriptions of the procedures involved and discussions of the interpretations of the statistical analysis. For persons interested in the details of the statistical methods and calculations, these are described, in condensed form, in the appendixes at the end of the report.
The authors have attempted to present the important findings of this analysis , but they wish to point out that much of the derived secondary information cannot be included in the limited space of this report, This information, taken together, has provided deep insight into the true nature of the gallery experiment, which is not afforded by other methods of approach.
The Data
The program of experimentation with the up-and-down method was conducted more or less continuously over a period of 25 months and yielded data pertaining to 3,294 shots, as mentioned. These data and the data reduction methods will be described briefly.
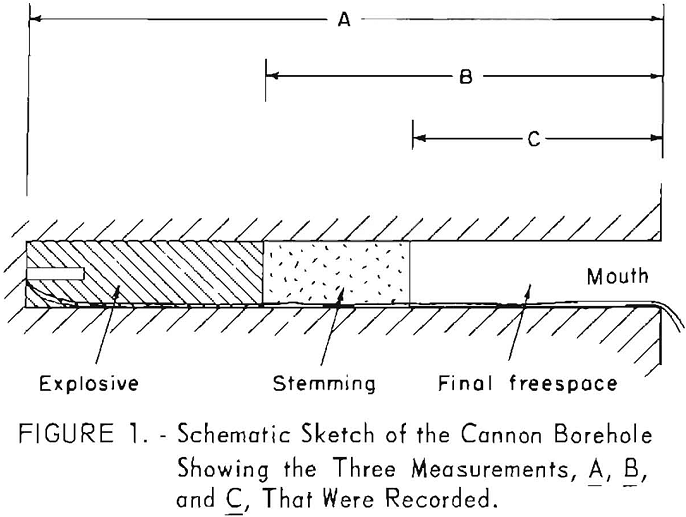
Data were obtained for 11 measured or recorded variables: (1) The weight of explosive charge; (2) the length of empty borehole (fig. 1, dimension A); (3) the distance from the cannon mouth to the end of the explosive before the stemming is placed (dimension B); (4) the final freespace (dimension C); (5) the borehole diameter; (6) the temperature and (7) the methane content of the gallery atmosphere; (8) the time of year; (9) the cannon designation; (10) the detonator lot; and (11) the operator. In addition to these data pertaining to the variables, the result of each test was recorded as an ignition or
nonignition. Therefore, 39,528 bits of data, subdivided into 12 categories, were available for the statistical analysis.
This large amount of data was handled by means of a punched-card electronic computer (a Remington Rand Univac 120) used in conjunction with appropriate auxiliary machines, such as an automatic typewriter punch, an automatic verifying machine, an electronic sorter, and a printing tabulator. The data were entered on individual punched cards so that each card contained all the information available for a given shot. From these cards, the desired distributions were obtained for the statistical analysis, and certain preliminary calculations were conducted on the electronic computer. This phase of the work was performed under the supervision of Robert Smith, Jr., of the Electronic Computer Service Section. As the study continued, the desired iterative calculations became apparent, and these were programmed insofar as was possible on the computer. The final statistical calculations, which often did not justify the use of the electronic computer, were performed with desk calculators. Wherever possible, systems of checks on the calculations were employed.
Classification of the data with respect to the explosives involved is of interest. A total of 102 explosives was tested. These included 98 permissibles and modifications of permissible formulations obtained from five U.S. explosives manufacturers, two coal-mining explosive compositions of Japanese origin, and two nonpermissible American explosives. The American explosives included nongelatin and semigelatin compositions. From a statistical standpoint, these 102 explosives constituted the sample of the universe to be studied. Although the universe is hypothetically infinite (that is, there is conceivably an infinite number of explosives formulations which may be subjected to the gallery test), it may be accepted that this sample of 102 explosives, composed largely of permissible explosives, is fairly representative of those explosives subjected to the gallery test over a long period of time.
Experimental Procedure of Individual Shots
The experimental procedure, which generated the body of the data previously described, consisted of two parts, namely, the procedure for the individual shots and that for the pattern followed in arranging the order in which the shots were to be fired. The latter, of course, is the experimental design and will be described.
The usual procedure of loading the explosive charge in the cannon, inserting the plug of fire-clay stemming, and firing the charge into the flammable atmosphere in the gallery has been described elsewhere and will be only briefly mentioned. All shots were loaded with slitted cartridges carefully tamped in the borehole with hand pressure; a single No. 6 fulminate-chlorate electric blasting cap, placed in the explosive at the rear of the borehole, was used for detonating the charge. The diameter of the borehole of a new cannon was 2-¼ inches, and its length was 21-½ inches. For 2,270 of the 3,294 shots, 1 pound of dry fire-clay stemming was used; for a relatively few shots, special asbestos stemming devices sealed the explosive in the borehole. The remaining shots were unstemmed. The explosive charge was weighed, to the nearest gram, on a laboratory balance just before it was loaded in the borehole. A nearly constant flammable atmosphere, consisting of approximately 8 percent natural gas in air, was prepared in the gallery just before the shot.
Statistical Designs as Part of the Procedure
The Up-and-Down Technique
The up-and-down technique was used to evaluate the gallery variables, so the important features of this method will be briefly presented. The up-and-down method is a procedure of the “go-no go” type, especially useful for measuring the sensitivity properties of explosives. The procedure used in the gallery shots consisted of firing a shot with a certain weight of explosive and noting whether an ignition or a nonignition resulted. For the succeeding shot the weight of explosive was increased or decreased by an arbitrarily chosen increment, depending upon whether the first shot produced an ignition or a nonignition. The typical procedure is illustrated by the sequential plot of figure 2, which represents the results of a 60-shot sequence. The first shot (500 grams) resulted in an ignition; accordingly, the second shot was made with the next lower increment of weight (450 grams). From the 60-shot sequence, the mean weight, or W50, and the standard deviation of the underlying distribution, assumed to be normal, were calculated. The W50 value is defined as the weight of explosive charge which would be expected to produce 50-percent ignitions and 50-percent nonignitions in a series of shots. A W50 value was obtained for each of the 102 explosives tested. The results of the up-and-down evaluation of 87 individual explosives have been reported elsewhere by Hanna and others and will not be discussed in this report. The corresponding data on the remaining 15 explosives as part of the 3,294 shots will be reported later.
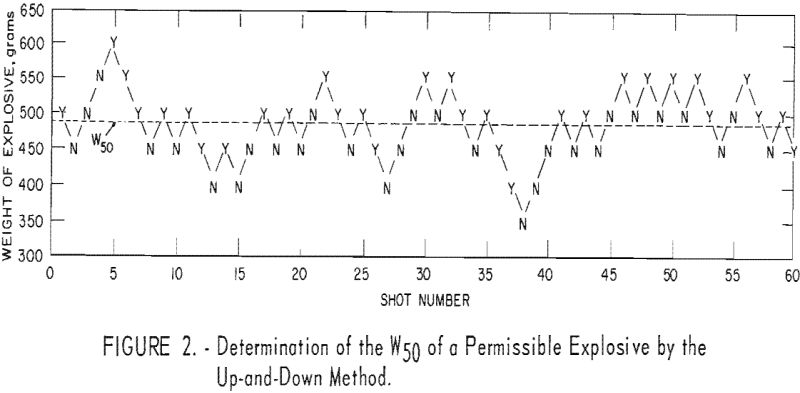
The up-and-down method provides a distribution of ignitions and nonignitions of approximately equal magnitude. These distributions reflect the variability of the data and constitute the starting point for the statistical analysis; that is, if the levels of a given variable are progressively increased and if that variable has no effect on the ignition probability, then the latter would remain statistically at 0.5. Conversely, a significant change in the ignition probability above or below 0.5 would reflect an effect of that variable.
Alternative approaches, such as a series of shots for which all nonignitions are obtained, provide no variability in the data and are consequently of no use for statistical analysis. In contrast, the up-and-down method as applied in this investigation permits the simultaneous study of a large number of variables, thus considerably increasing the efficiency of the experiment. All of the information in this report is a byproduct of the main program on the evaluation of permissible explosives but was obtained without the need for additional shooting schedules.
Randomization
The purpose of randomization is to insure that the resulting data will be applicable to subsequent samples and that the comparisons and conclusions will be generally valid. For this reason the principle of randomization was integrated into the overall experimental procedure. Because of the impossibility of randomizing all 102 explosives over 25 months to produce a completely randomized experiment, the explosives were randomized in a number of series of about four to eight explosives each; each series contained one to several hundred shots. In addition to the explosives, the nature of the operation randomized the cannons in blocks of two or six; this, in turn, effectively randomized the final freespace. As an illustration of this process of randomization, the first shot in a particular series might consist of 400 grams of explosive A in cannon No. 1, with a freespace of 11 inches, and the second shot might have 650 grams of explosive B in the same cannon. Several other variables, which in principle were held constant, such as the methane content and the temperature of the gallery atmosphere, actually varied in practice. Because of the long time of experimentation, they could reasonably be assumed to be random samples varying around a mean. Over the 25-month period a limited randomization of the time or season of the year could be assumed.
In the subsequent process of taking subsamples from these data by means of the electronic computer, care had to be exercised not to destroy the randomization. This was accomplished by using the electronic sorter to arrange the punched cards in the randomized order in which the shots were fired. It was necessary to reorder the punched cards before each subsampling operation.
Interpretations of the Analysis
First Analysis Leading to Tentative Conclusions
The first task was to identify, from the data, the important variables affecting the results of the gallery test. Therefore, the first analysis was in the nature of a screening test to separate the main variables from the secondary variables in order that time and effort would not be expended on variables subsequently found to have little or no importance. The contingency-table chi-square test served conveniently for this purpose, as this method establishes the existence of a significant or non-significant relationship between two variables and the calculations are relatively simple. For the data in question the results, expressed as ignition probabilities, represented one variable and any of the measured conditions, such as weight, and freespace, the second variable. The results of these calculations showed that only 5 of the 11 variables have an important bearing on the ignition probability. These were: (1) The methane content of the gallery atmosphere, (2) the weight of explosive charge, (3) the final freespace in the borehole, (4) the operator, and (5) the time of year expressed as winter versus summer. These findings were accepted as tentative conclusions until suitable tests were made on the significance of two-factor interactions between the five main variables. If calculations demonstrated that there were no significant Interactions, the main variables could be assumed to be independent, and the tentative conclusions could be accepted as the final conclusions. On the other hand, if significant interactions were found, the tentative conclusions would be modified.
Of the remaining six variables, four had no significant effect: (1) The temperature of the gallery atmosphere (within the normal experimental limits of 20° to 30° C.), (2) the diameter of the cannon borehole, (3) the detonator lot, and (4) the cannon designation. The two remaining variables were the freespace of the empty borehole (dimension A, fig. 1) and the length from the mouth of the cannon to the end of the explosive charge before placing the stemming (dimension B, fig. 1). These were found to be related to the weight (or length) of the explosive and the final freespace, so no additional information was obtained that was not available from the weight of explosive and final freespace. The conclusions concerning these six variables were such that no further time was devoted to their study.
Second Analysis Leading to Final Conclusions
The second phase of the statistical analysis was concerned with detailed studies of the significance of the two-factor interactions and a summary of the interpretations of the effects of the significant variables.
There were three possible two-factor interactions—interaction between weight and freespace, methane and weight, and methane and freespace. A critical examination by analysis of variance methods led to the conclusions that the two-factor weight-freespace interaction was significant but that the methane-weight and the methane-freespace interactions were not. It then became clear that the principal remaining problem of the statistical analysis was to interpret the role of the significant weight-freespace interaction on the results of the gallery test expressed as ignition probabilities.
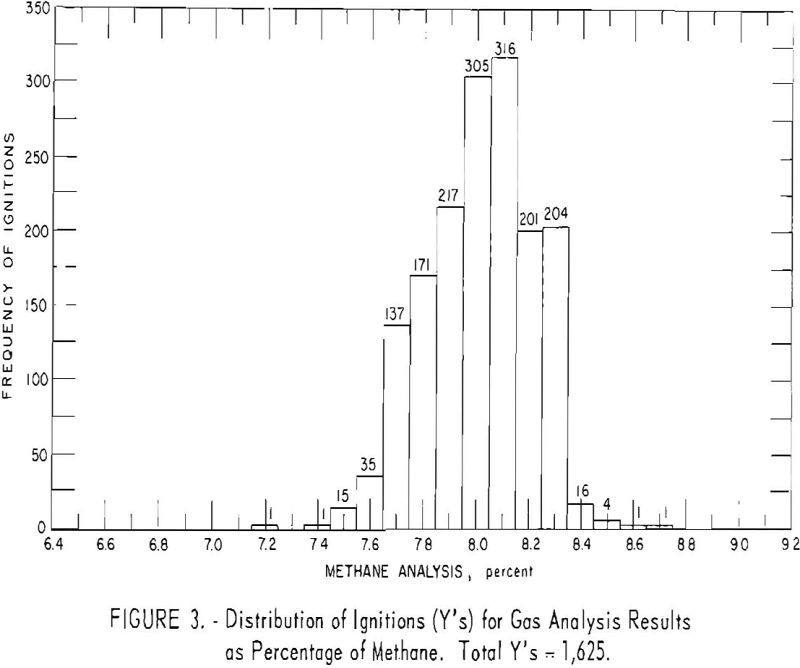
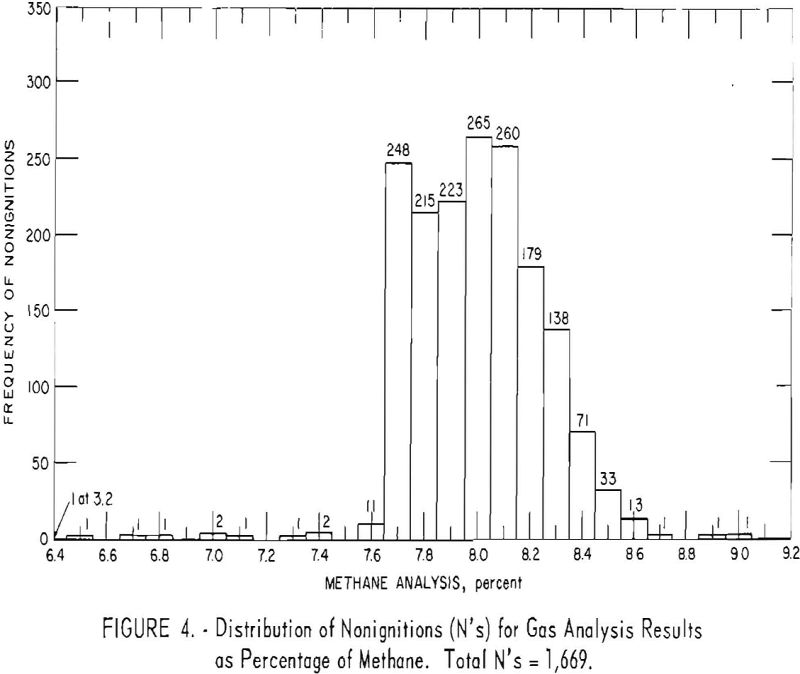
The effect of methane could be simply summarized by stating that it was significant and independent of the other variables, as it was involved in no significant interactions. However, a study of the distributions of the frequency of ignitions and nonignitions for different levels of methane indicated that bias existed in these data. To illustrate: Figures 3 and 4 show a greater than expected frequency of Y’s (ignitions) for 8.3 percent methane and a greater than expected frequency of N’s for 7.7 percent methane. The values 7.7 and 8.3 are the limits for methane in permissibility testing. Since a bias was indicated, it was deemed advisable to base the statistical analysis on the center of the distribution, that is, 7.8 to 8.2 percent methane. The experimental procedures which allowed the entry of bias have been modified as a result of this study.
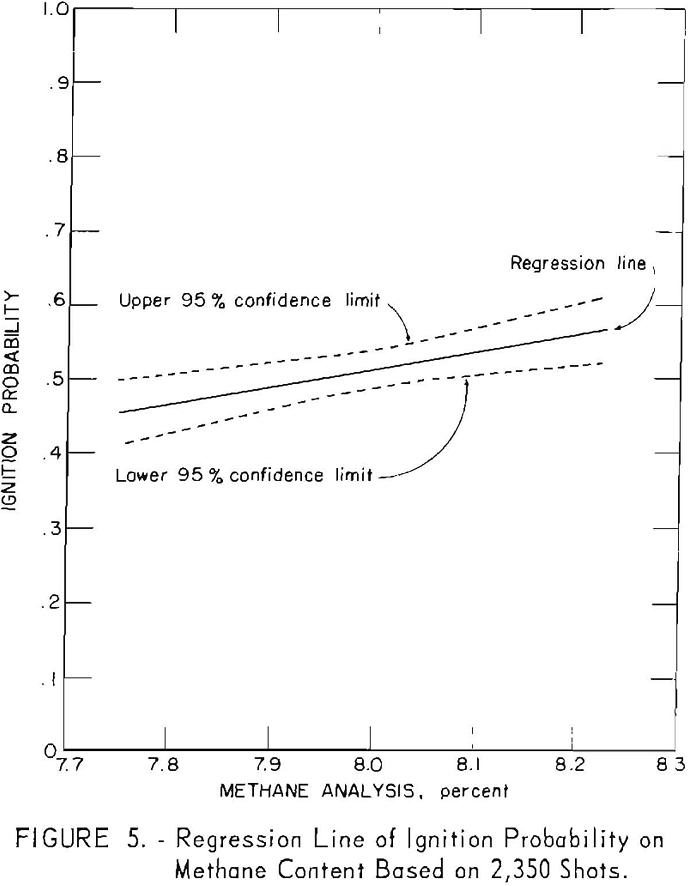
The considerable effect methane has on the ignition probability is shown by the significant positive slope of the regression line of ignition probability versus methane in figure 5. The slope is distinctly greater than zero and indicates a real relation between methane content and ignition probability. This plot reveals another aspect of the problem, namely, that the methane content corresponding to the maximum ignition probability is evidently not 8 percent, as had been assumed, but some greater value. The two curves for the 95-percent confidence limits of the regression line reveal the expected reproducibility of the total experiment. The interpretation is as follows: If the 2,350-shot experiment which determined this line were repeated 20 times and 20 regression lines were computed, it could be predicted that 19 lines would fall within the two confidence curves and one would fall outside the confidence curves. The line of regression also permits an estimation of the most likely ignition probability that may be expected for a given methane value. For example, for 7.8 percent methane, this is 0.46; for 8.2 percent methane, it is 0.56.
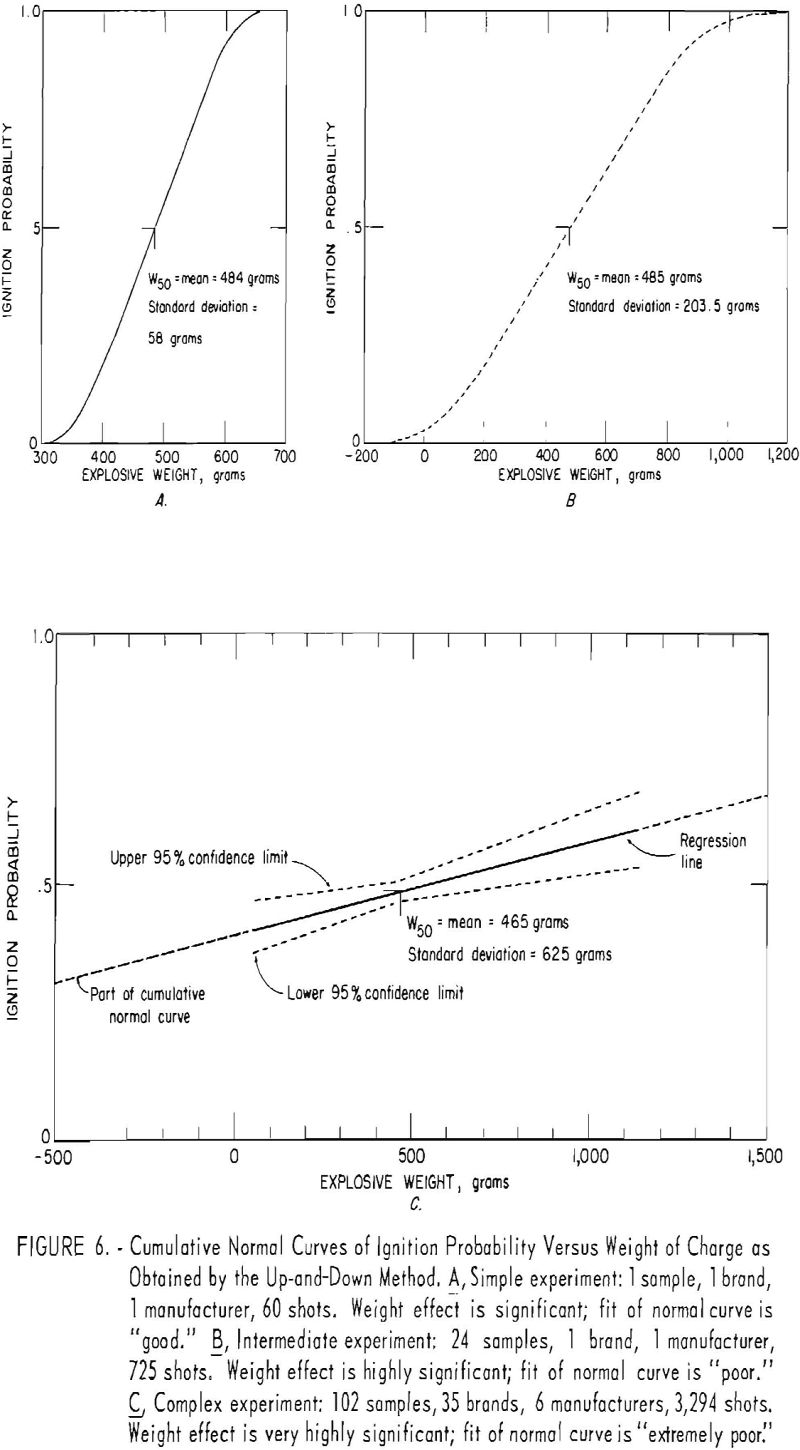
As regards the weight of explosive, the present investigation has established that this factor has a significant effect on the probability of ignition. To illustrate the nature of the effect of this variable, three types of experiments of progressive complexity were analyzed. The simplest experiment
involved a single explosive (one sample). The results of the 60-shot sequence by the up-and-down method are given in figure 2 and plotted as the cumulative normal curve in figure 6, A. For these results, the weight effect is significant, and the fit of the normal curve to the data is good. The results of an experiment with modifications of one brand of one explosive made by one manufacturer (24 samples), totaling 725 shots, are plotted as the curve in figure 6, B; the weight effect is significant, but the fit of the normal curve is poor. This means that only a weak justification exists for fitting the latter data with a cumulative normal curve. A complex experiment is represented by the 102 different explosives made by five different manufacturers (different samples, brands, and manufacturers) that yielded 3,294 shots (fig. 6 C). For these data, the weight effect is highly significant, but the fit of the normal curve is very poor. This means that one is strongly justified in drawing a straight line but not at all justified in drawing a cumulative normal curve to represent these data. For all three cases, it is emphasized that the effect of weight of explosive is significant.
Analysis of variance for the complex experiment with 102 explosives showed that the weight-freespace interaction was significant. The relation of ignition probability, weight, and freespace is graphically illustrated in figure 7, A and B. The nonparallel property of the lines in each of these two plots indicates the existence of interaction. A consequence of this interaction is that, at large freespace values, an increase in weight did not result in the expected increase in ignition probability, whereas with small freespace values probabilities were greater than expected. However, the individual points in figure 7, A and 13 carry different weighting, as each represents a different number of shots, and the plots must be interpreted with this reservation. Closer examination shows that only a small fraction of the total data is represented by the extremes of weight and freespace and that the bulk of the data falls within the midrange of weight and freespace where the interaction
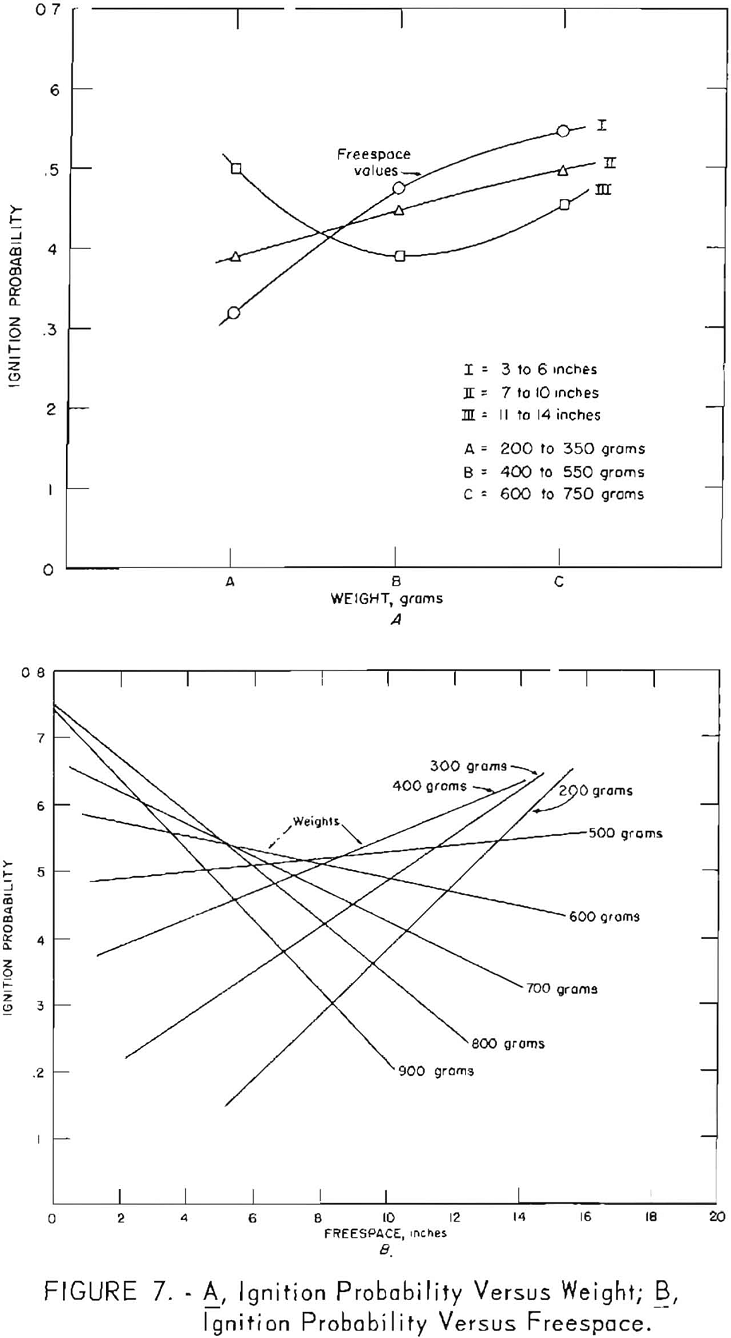
between weight and free-space is small. This result suggests (and it was confirmed by an analysis of variance) that a disregard of the results obtained at the extremes would lead to the conclusion that the effect of weight-freespace interaction has no significance. For the experiment with 102 explosives, including all data, a significant weight-freespace interaction was found.
The solid line of figure 6, C summarizes as a regression line the relation between the weight of explosive and the ignition probability for the experiment with 102 explosives. The two broken lines define the upper and lower 95- percent confidence limits for the regression line. The slope of this line is small (0.000176) but significant. It should be pointed out that this regression line is for a complex experiment with 102 explosives. For a simple experiment with one explosive, the slope will be considerably greater, as shown in figure 6, A.
The relation of ignition probability, weight, and freespace may be best represented by the three- dimensional plot in figure 8. The surface depicts the model for an experiment involving the two variables, weight and freespace, and the result expressed as ignition probability. These relationships are demonstrated by means of this model. The ignition probability generally increases as the weight of explosive is
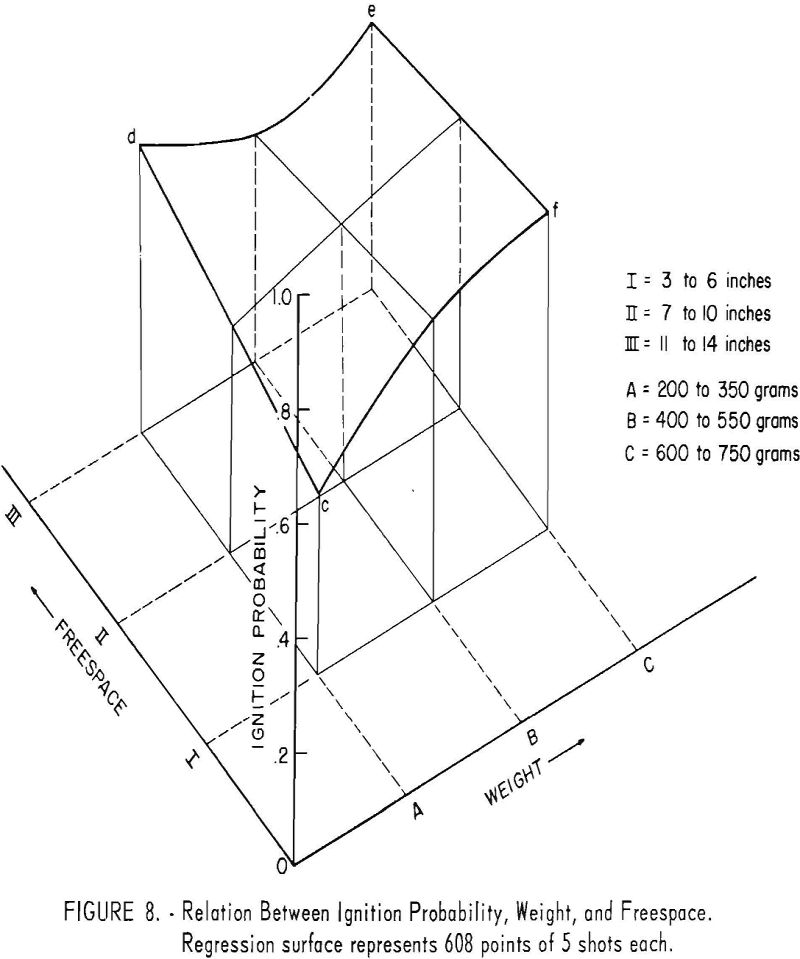
increased. Only for the corner designated by d, representing a small fraction of the total number of shots, is this not true. If this corner is disregarded, the slope of the surface is upward in the direction of increasing weight. The weight-freespace interaction is revealed by the reversal of slope of the line cd compared with that of fe in the direction of increasing freespace. For weight A, an increase in freespace causes an increase in ignition probability; for weight C, an increase in freespace causes a decrease in ignition probability. Accordingly, it is not correct to speak of the freespace effect without reference to the weight associated with the freespace; that is, the freespace effect is not independent of the weight effect but exerts its effect through the weight-freespace interaction. A previous investigation of freespace effect with small cannons, in which the weight was maintained constant, showed that an increase in freespace from some small value to a larger value led to a sharp increase in ignition probability. This conclusion agrees with that indicated by line however, it does not agree with conclusions indicated by weights B and C. It is suggested that anomalous results with cannon shots, reported by previous investigators, may be attributed to the operation of weight-freespace interaction. The model reveals that if the extremes of weight and freespace could be avoided in the performance of the experiment, the effect of interaction would be minimized.
Unexpectedly, the operator had a significant effect upon results. This fact indicated the introduction of personal factors in the loading procedure and pointed to the need for further standardization of these operations. Frequently, it has been inferred that the weather, time of year, or winter versus summer influenced the results. Although no significant effect was found with respect to month or season of the year, a significant effect manifested itself when the results were classified into winter and summer data. The shots made in winter gave higher ignition probabilities than those made in summer. A plausible explanation, related to previous work at Bruceton, is that the decrease in absolute humidity in winter would increase slightly the oxygen content of the gallery atmosphere, and it is known that the ignition probability is sensitive to the oxygen in the firedamp atmosphere.
Observers of gallery shots frequently have noted runs of ignitions or nonignitions. Such events have raised the question as to whether the result of one shot influenced the result of the immediately succeeding shot. It is understood that one station has used “sensitization” shots to minimize the effect of a given shot on another. The chi-square test was used to answer this question, and the data for 2,126 consecutive shots were tested accordingly. It was found that the probability of an ignition is the same following either an ignition or a nonignition. It was concluded that the result of a given shot does not influence the result of the next shot in the gallery test. This conclusion agrees with that of Sartorius and Thouseau.
The final conclusions reached, by the statistical analysis are that the principal variables of the gallery test are: (1) The methane content of the atmosphere of the gallery; (2) the weight of explosive charge in the cannon; (3) the weight-freespace interaction, with the freespace effect not independent of the interaction effect; (4) the time of year, subclassified as summer and winter; and (5) the operator loading the cannon.
In terms of application of the results of the analysis to the gallery test for its improvement as a tool for evaluating permissible explosives, the following conclusions may be stated:
- The principle that an increase in the weight of explosive charged into the cannon causes an increase in the probability of ignition of the gallery atmosphere is sound and may be used as a basis for measuring the relative incendivities of permissible explosives.
- For cannon tests involving weight and freespace variables, the final freespace in the cannon must be either controlled or randomized; since it cannot be controlled conveniently in the test as currently conducted, it must be randomized.
- Improved control of the methane, or combustible, content of the gallery atmosphere will improve the reproducibility of the ignition probability for a given explosive.
- Performance of the gallery test so that the extremes of weight and freespace are avoided should reduce the effect of weight-freespace interaction, reduce the error due to this factor, and lead to a more precise result from the test. In any event, calculations to determine the significance of this interaction should be carried out for each given experiment.
