Table of Contents
In the commercial electrowinning of zinc, zinc oxide is leached from the roasted calcine with an aqueous acid sulfate electrolyte. The zinc-rich solution is purified and then passed into an electrolytic cell where a fraction of the metal is cathodically deposited. The spent electrolyte is pumped from the cell to readjust the zinc concentration by recirculating over fresh calcine. The electrolyte, newly enriched in zinc is passed again through the cell and more zinc is deposited.
Impurity concentration in the electrolyte is of paramount concern to the electrolytic zinc industry. Serious reductions in zinc current efficiency sometimes can occur with impurity concentrations of less than 0.01 mg/l. While impurity effects can be minimized by rigorous purification of the neutral leach solution, impurity concentration levels may not be rendered sufficiently harmless because of synergistic effects. In addition, it is not always possible to detect chemically, impurities which may be deterimental to the process.
Once an impurity enters the electrowinning cell, it is virtually impossible to counteract its effect because the mechanism by which the impurity becomes active is not understood. Certain impurities in the electrolyte are known to cause re solution of the deposited zinc. Re-solution usually occurs after a period of zinc deposition which can be considered as an incubation period. Attempts have been made to establish relationships between process conditions and impurity concentrations with overall efficiency. Unfortunately most of the findings have been only qualitative in nature , making it difficult if not impossible to apply to the general situation.
Ordinarily, a metal ion impurity can codeposit on zinc if it is more electropositive than zinc and if there is a sufficient amount present in the bulk solution In practice, impurity bulk concentrations are very small compared to those of the zinc. Consequently, deposition of the impurity on zinc may be controlled by the diffusion rate to the double layer in which case only a small part of the electrode surface is covered by the impurity (2) This small part of the electrode surface evolves large amounts of H2 by acting as either a cathode for H+ reduction or a local cell cathode in the corrosion of zinc previously deposited It is very difficult to distinguish between the two unless sufficient resolution occurs so that a part of the deposit is dissolved away.
Another important aspect of the deposited zinc is the physical appearance of the surface. It should be smooth, uniform, and free of dendrites and pits to allow easier handling and reduce the melting loss caused by excessive oxidation. The surface morphology is influenced by the combined effects of the deposition time, current density, impurity concentration, addition agents, and cell temperature, as well as acid and zinc concentrations.
The general nature of the deposited zinc will depend on its electrocrystallization process. According to the Bravais law for free growth of crystals (without adsorption of hydrogen or colloid particles), growth velocity depends on atomic population (reticular) density of the planes. For zinc, population densities (Dh k.1) decrease in the following order: (00.2), (10.0), (10.2), (10.1), (11.0), and (10.3) so that growth velocity (Vhk.1) and current density (Lhk.1) should vary inversely with population density. Therefore, zinc should crystallize by a lateral growth mode with preferred (00.2) orientation under free-growth conditions. This condition can be obtained by either increasing the cell temperature and current density or by additions of oxidizing agents. However, ideal conditions for free growth are very difficult to obtain.
Since the surface structure and the current efficiency fluctuate considerably with impurity level relationships between the surface morphology and impurity species should be established. Particular emphasis in this study was placed on the behavior of the added impurities on the zinc electrode surface during electrodeposition.
The primary objectives of this research were two-fold
- To determine the effect of various impurities on the morphology and growth of electroiytically deposited zinc (If a behavior pattern did emerge, a method of predicting what impurities were active in the process would be possible, allowing specific corrective actions to be taken sooner than is now practiced.)
- To determine the mechanisms by which impurities become active during electrolysis, with particular emphasis on the time dependency of current efficiency.
Experimental Procedure
A neutral zinc sulfate solution was prepared by dissolving 249 gpl French process ZnO into a dilute sulfuric acid solution containing 300 gpl H2SO4. This solution then was purified at pH 5 to 55 and after adjusting the volume the zinc concentration was 200 gpl. The purification consisted of an addition of 0.1 to 0.2 ml/l of 0.1 N KMnO4 ,heating to near the boiling point with vigorous stirring, settling of precipitates for 30 minutes at 80° to 85° C, and filtering. The filtrate was then purified by adding 2 gpl of zinc dust, heating to near the boiling point with stirring for 30 to 45 minutes, and filtering to remove the excess zinc dust
The starting cell solution was prepared by mixing the purified solution with dilute sulfuric acid to make acid and zinc concentrations of 200 and 65 gpl, respectively. Purified neutral solution was fed into the cell during the electrolysis to keep the acid and zinc concentrations constant.
Impurity stock solutions were prepared by dissolving the respective reagent grade sulfates in 1 N sulfuric acid, except for Al, Mn, Cr, and Sb. The Al, Mn, and Cr stock solutions were made by dissolving each metal in 1 N sulfuric acid, while the Sb solution was prepared by dissolving antimony tartrate in water to avoid hydrolysis. These solutions were prepared to give an ion concentration of 10 mg/ml which could be diluted to the desired level when added to the electrolyte or to the neutral feed solution.
Electrolyses were conducted in a 1-liter beaker with a modified pouring spout using an Al cathode (1.25 by 3.75 inches and 0.05 inch thick) between two Pt anodes (1 00 by 3.75 inches and 0-01 inch in thickness). Plexiglas edge strips were used on the cathode.
The deposits were stripped from the Al cathode at the completion of each run, thoroughly washed and dried, and then weighed . Current efficiency calculations were made for all deposits and were based on the final weight of the deposit compared with the theoretical amount which should have been deposited. The total coulombs passed were determined by means of an ampere-minute meter. A constant current power supply was used. A Luggin electrode was used to measure a difference in the cathode potentials between the re-solution site and the rest of the cathode surface.
Representative portions of the electrode were then prepared for X-ray and (SEM) analyses.
The neutral purified solution did not show a detectable amount of any impurity as determined by atomic absorption techniques The detectable limit varies depending upon the elements in question but the range is usually 0.01 to 1 mg/l or 0.01 to 1 ppm.
Experimental Results
No Impurity in the Electrolyte
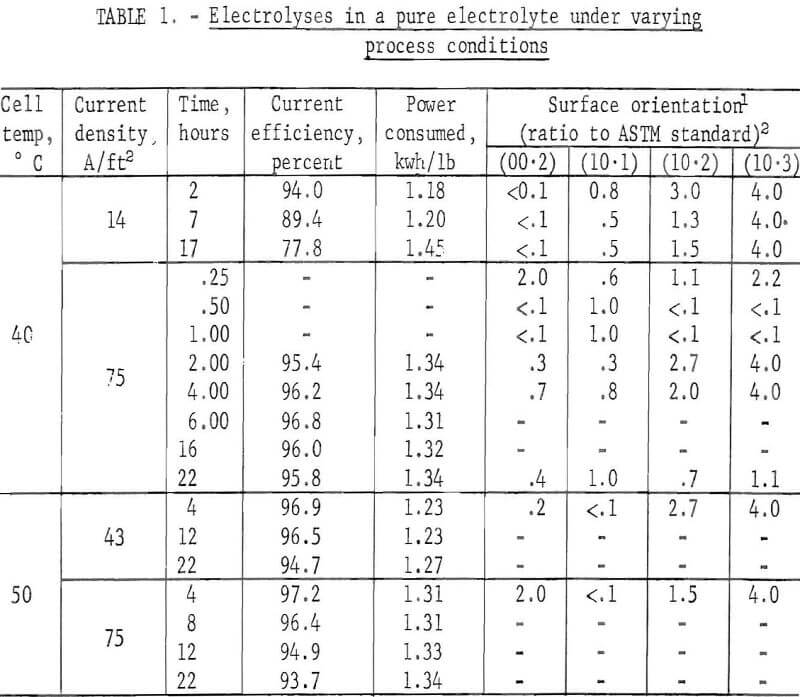
Several deposits with different electrolyzing times were prepared from an electrolyte containing 200 gpl H2SO4 and 65 gpl Zn in order to study the time dependency of the current efficiency at 40° C and 75 A/ft². The orientations of these deposits also were examined for later comparison with the deposits prepared from electrolytes containing various impurities or additives.
The current efficiency remained fairly constant throughout the electrolyzing period. The changes in the preferred orientation were m the following sequence: (00.2) at start; (10.1) after 1 hour; (10.2) and (10.3) after 2 hours; and random orientation being obtained after 22 hours. However, it was
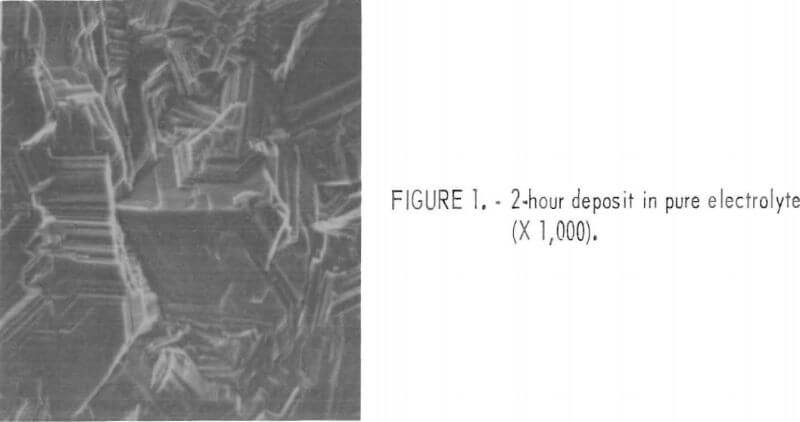
difficult to examine the orientation of the 22-hour deposit due to the rough surface structure. Figure 1 shows the surface morphology of the 2-hour-deposit, as obtained on the SEM.
Table 1 summarizes the results and also shows the results obtained when the electrolyzing conditions were changed.

Impurities in the Electrolyte
Zn deposits were prepared from electrolytes containing a varying amount of a single impurity which included Ag, Al, Cd, Co, Cr, Cu, Ge, Mn, Ni, Sb, Sn, and Ti, in order to determine what effect each had on the Zn current efficiency or on the surface morphology. A specific concentration of the impurity was added initially During the electrolysis, the impurity also was added continuously to the cell with the neutral feed solution. The electrolysis was carried out at 40° C and 75 A/ft² Table 2 summarizes the results.
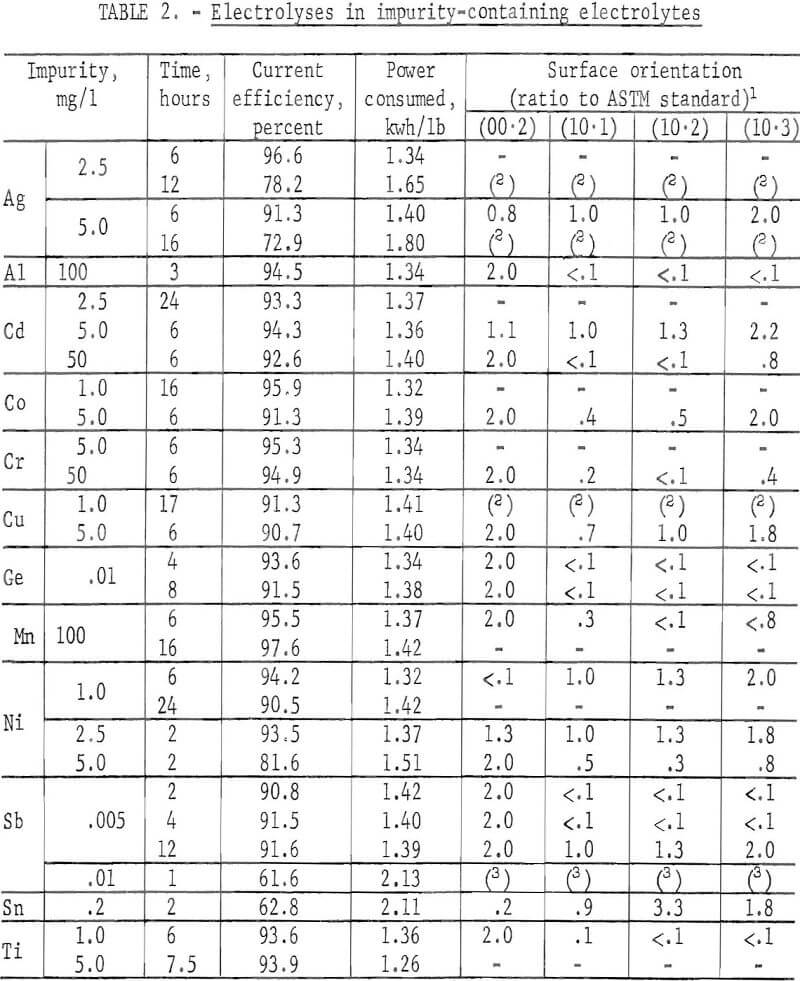
The impurities are divided into three classes according to their effect on the orientation, as follows:
Class 1.- Metal ions which produced a (00.2) basal plane orientation, for example, Al, Ge, and Sb
Class 2.- Metal ions which produced a (00.2) preferred orientation along with other orientations; for example, Cd, Co, Cr, Mn, and Ti.
Class 3.- Metal ions which caused random-type orientation; for example, Ag, Cu, Ni, and Sn.
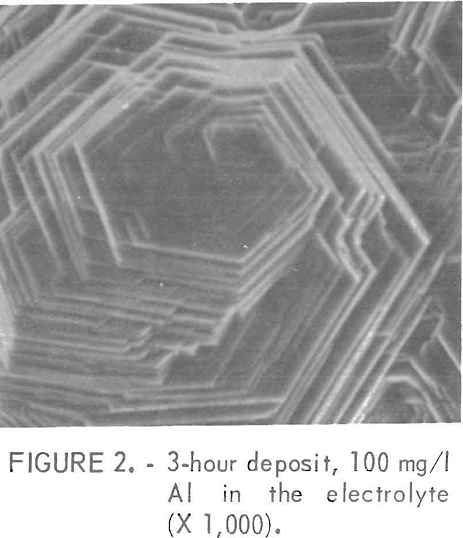
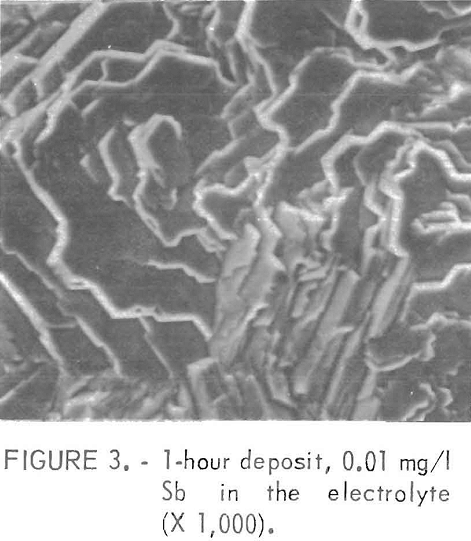
Figures 2 and 3 show examples of the surfaces resulting from the class 1 impurities. These deposits were prepared in electrolytes containing 100 mg/l Al and 0.01 mg/l Sb , respectively. The platelets in figure 2 are very sharp while those of figure 3 are rounded or irregular with more of a corroded appearance. The rounded platelets also were produced using an electrolyte containing 0.01 mg/l Ge. Sometimes pits were found on the rounded plates, but no evidence of an added impurity was found either in the pits or on the rest of the electrode surface when examined by a nondispersive X ray spectrometer
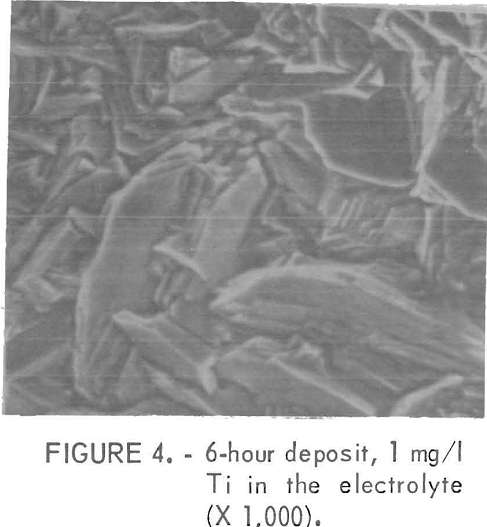
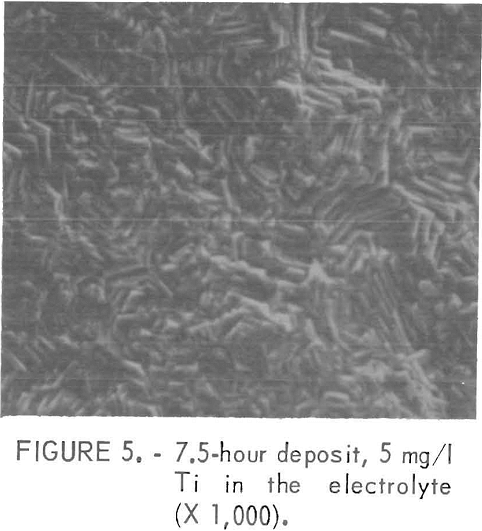
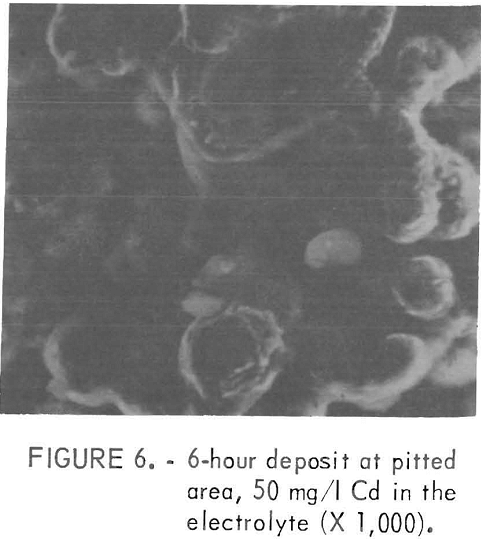
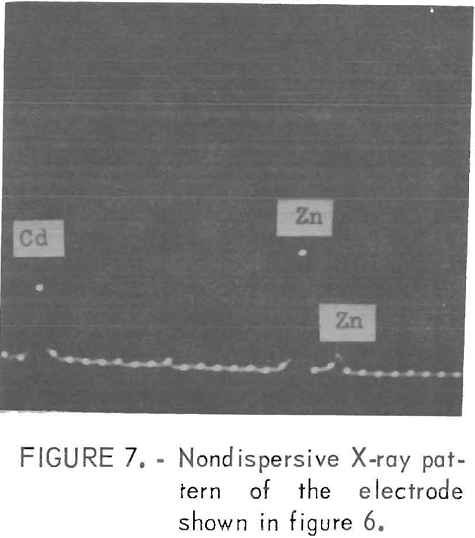
The impurities which belonged to class 2, except Mn, usually gave fine facets with increasing amounts of impurity Figures 4 and 5 show examples of the change in the facet size with increasing Ti additions. With these impurities in the electrolyte, sometimes a visually pitted or waffled structure was obtained, the degree of waffling being dependent on the amount of impurity and the electrolyzing time. Sometimes the added impurity was detected on the surface by nondispersive X-ray spectrometer. If this was the case, the impurity was usually found near the pitted areas, as was true for deposits made from solutions containing 50 mg/l Cd. Figures 6 and 7 show the pitted area and the presence of Cd in the nondispersive X-ray pattern, respectively.
All metal impurities in class 3 except Sn caused re-solution of the deposit at preferential sites, usually at the top or edges of the cathode, and the re-solution rate increased with time as a part of the deposit dissolved away. When this occurred, Hg gas was evolved from the Al sheet on which Zn was originally deposited. The time required before the start of re-solution was decreased as the amount of impurity was increased. The presence of Sn
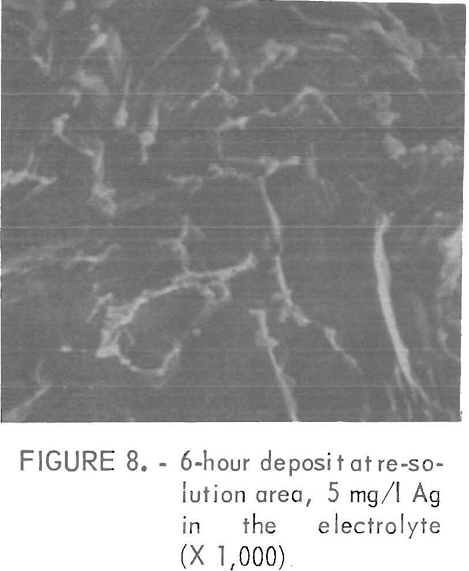
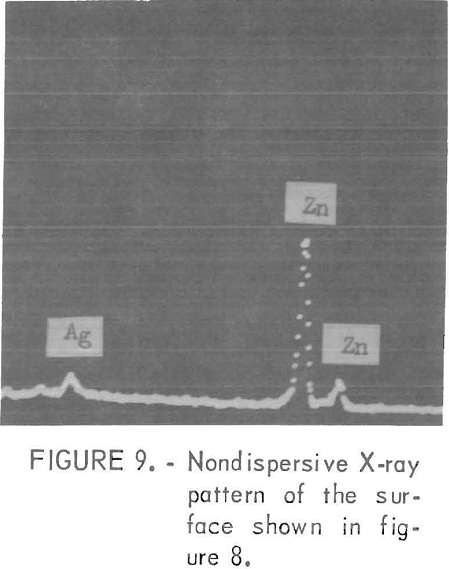
in the electrolyte caused overall corrosion of the Zn . and H2 gas was evolved over the entire electrode surface. Sometimes Sn was found in or near pits with the deposit having a very filmy appearance in these areas. An example of a re-solution site is shown in figure 8. This electrode was prepared in an electrolyte containing 5 mg/l Ag Figure 9 shows the presence of Ag on the electrode surface at the re-solution site. Generally, class 3 impurities, with the exception of Sn, did not affect the overall electrode surface.
Reduction in the current efficiency was dramatic in the presence of less than 1 mg/l Ge, Sb, and Sn in the electrolyte. Glass 3 impurities usually caused re-solution of the deposit at specific locations while the presence of
Ge, Sb, and Sn produce H2 evolution over the entire electrode surface. Thus both groups, class 1 and 3, decreased the Zn efficiency to some degree. The presence of Al and class 2 impurities did not decrease the current efficiency drastically at the level tested.
Electrolyses with Additives and/or Al and HCl
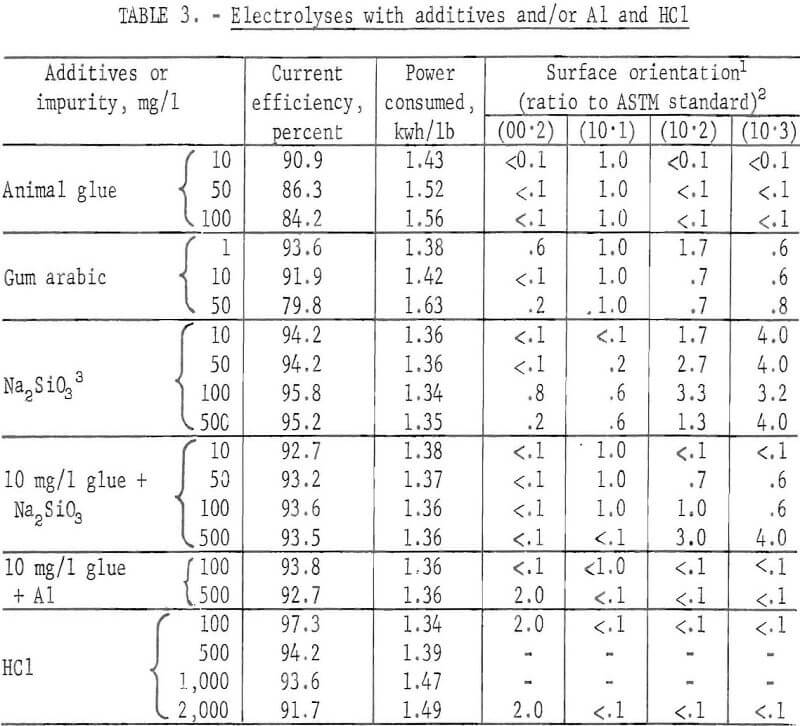
Animal glue, gum arabic , and Na2SiO3 , common additives used in Zn electrowinning, were added to the electrolyte either individually or in combination and 2-hour deposits were prepared. Additions of Al with the glue were also made to determine the combined effect on the orientation of the deposit. Additions of HCl were made to the electrolyte since it is usually present in industrial practice
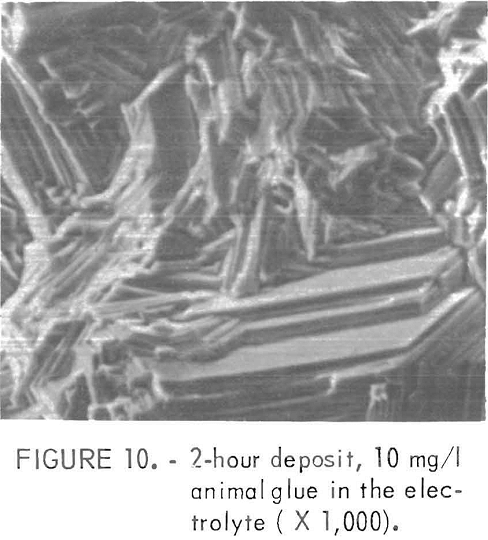
Animal glue additions produced a pronounced (10.1) orientation of the deposit while gum arabic caused more random-type orientations. However, (10.0) and (11.0) orientations were missing or very weak, with less than 10 percent of the intensity shown in the ASTM standard. Figure 10 shows the surface structure of the deposit prepared in an electrolyte containing 10 mg/1 animal glue With these additives in the electrolyte the resulting electrode had a smooth surface. The grain size generally decreased with an increase in the amount of addition. The current efficiency also decreased with increased amounts of the glue or gum arabic,
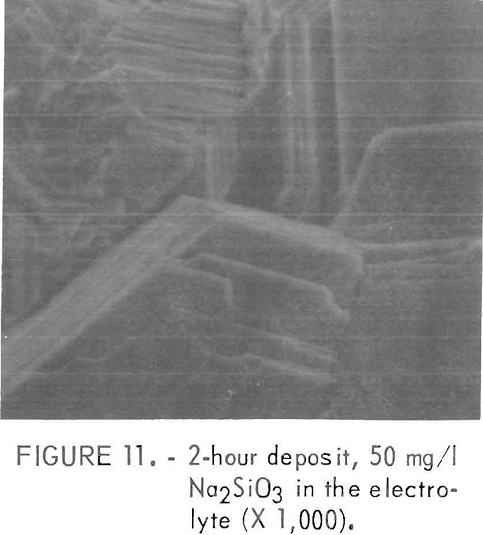
The presence of Na2SiO3 in the electrolyte caused strong (10.2) and (10.3) orientations. This was similar to the orientations of a 2-hour deposit prepared in a pure solution except the platelets were larger with the Na2SiO3 additions as shown in figure 11. This cathode was prepared in an electrolyte containing 50 mg/l Na2SiO3. The current efficiency was independent of the amount of addition.
A (00·2) basal plane 0rientation, simllar to the Al additions, was observed with HCl additions. A few pits are also in evidence on the (00·2) plane. The cell voltage increased and the current efficiency decreased with increased addition of HCl.
The combined additions of 10 mg/l animal glue with 100 mg/l Al produced a pronounced (10.1) orientation, similar to the glue addition only, while the orientation changed to (00.2) basal plane-type when Al was increased to 500 mg/l. The grain size also increased with increasing Al additions. A similar effect of increasing grain size was observed when the addition of Na2SiO3 was increased in the presence of 10 mg/l animal glue. The orientation was also altered to (10.3) preferred from the (10.1) as the addition of Na2SiO3 was increased. It appeared that the detrimental effect of the glue on the current efficiency was noticeably reduced by the presence of Al or Na2SiO3 in the electrolyte.
Table 3 summarizes the results.
Electrolyses in the Presence of Pb Compounds
Additions of PbO2 and PbSO4 were made to the cell in order to determine their effects on contamination of the Zn since these compounds are usually found in commercial practice. In a few cases combined additions of PbO2 with PbCO3 or SrCO3 were also made to study the effect of these additives on the amount of Pb in the deposit. All electrolyses were carried out after stirring and then settling for 2 hours at 40° C. Table 4 summarizes the results.
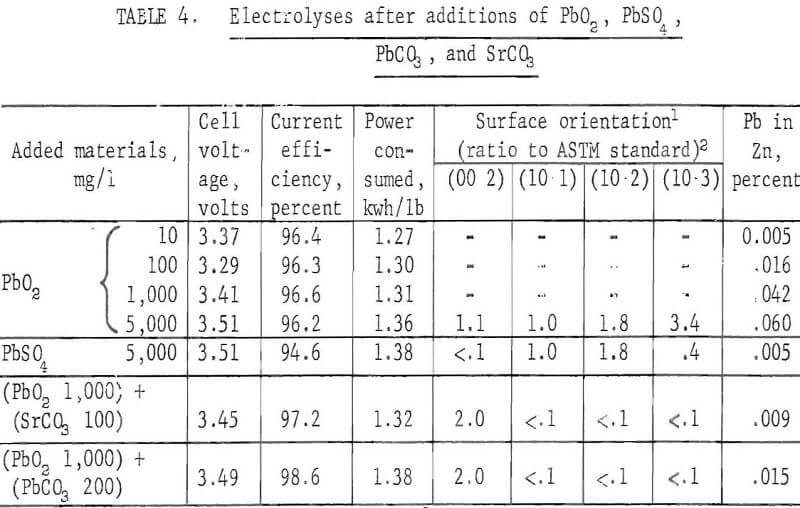
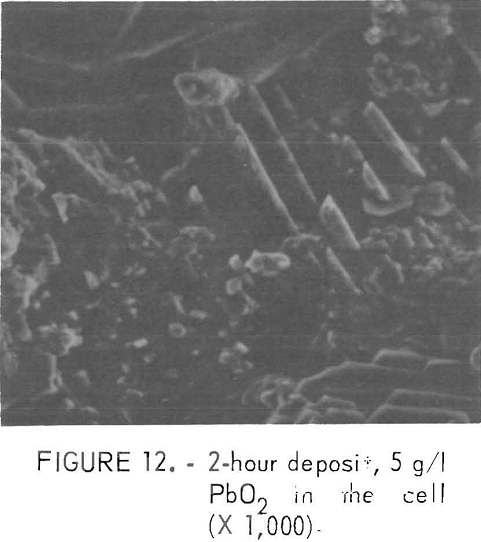
The Pb content in the deposit increased with increases in the PbO2 addition, Particles which were shaped like the PbO2 appeared to cling to the deposit surface when a large amount of PbO2 was added. Figure 12 shows the surface of a deposit, prepared after the addition of 5 gpl PbO2, on which Pb was found using the X ray spectrometer. The compound was possible PbSO4 which was formed by the reduction of PbO2 on the cathode The addition of PbSO4 to the cell produced a deposit with 0.005 percent Pb and there was no indication of the sulfate remaining on the surface as shown in figure 13. The combined additions of PbO2 with PbCO3 and SrCO3 decreased the Pb content from 0.042 to 0.015 and 0.009 percent, respectively.
In an electrolyte containing 5 gpl PbO2, the orientation of the deposit was found to be mixed. With the same amount of PbSO4 in the cell, a similar mixed orientation was produced. However little (00.2) orientation was detected. PbCO3 or SrCO3 addition with PbO2 gave a pronounced (00.2) orientation All other orientations resulting from these additions were very weak.
The current efficiency was high regardless of the added species.
Effect of Ni on Zinc Deposits With Varying Process Conditions
A more concentrated study was made of zinc deposits prepared from electrolytes containing various amounts of Ni under varying electrolyzing conditions in an attempt to determine the re-solution mechanism for this type impurity. Some orientation studies were also made on a few of the short-time deposits. Ni was chosen since it seemed to be represenataive of impurities where a very small concentration reduced the current efficiency by re-solution of the deposit.
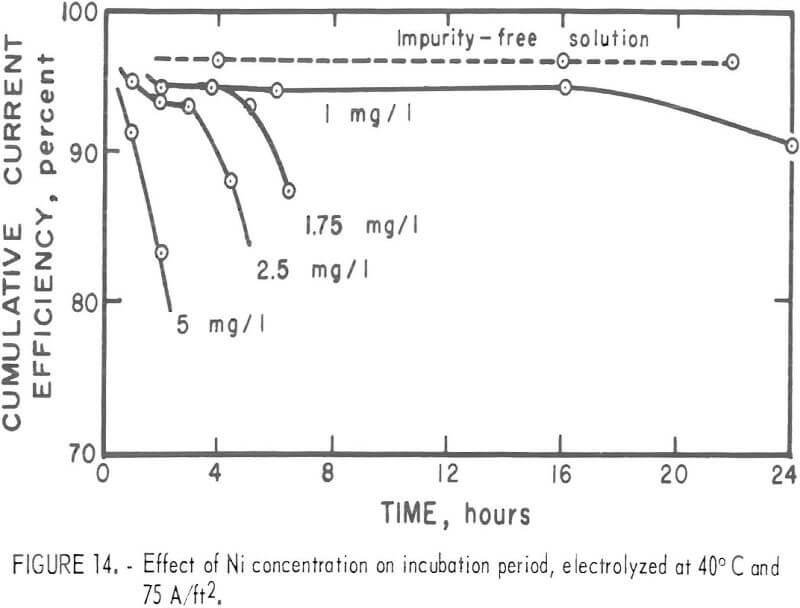
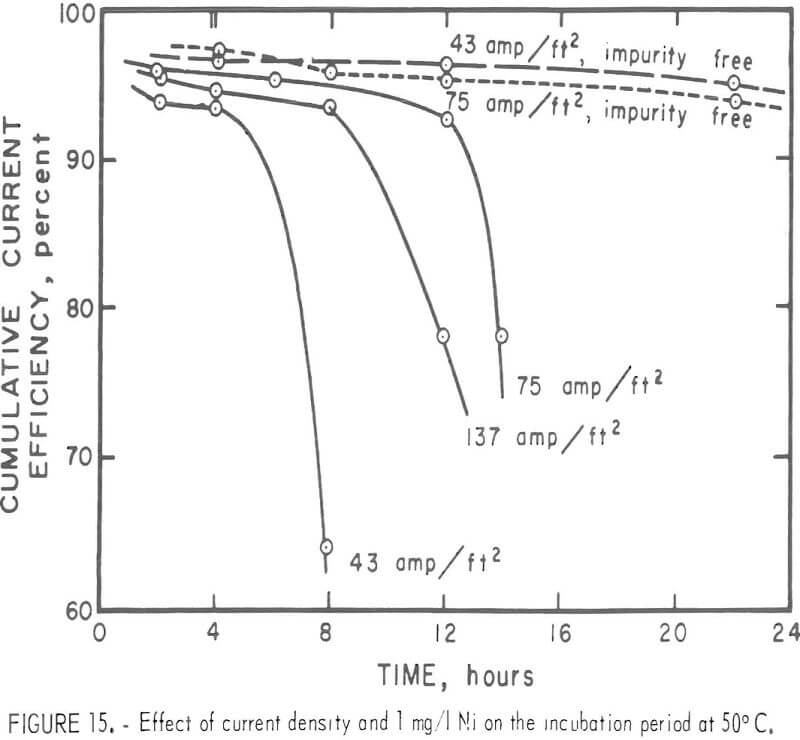
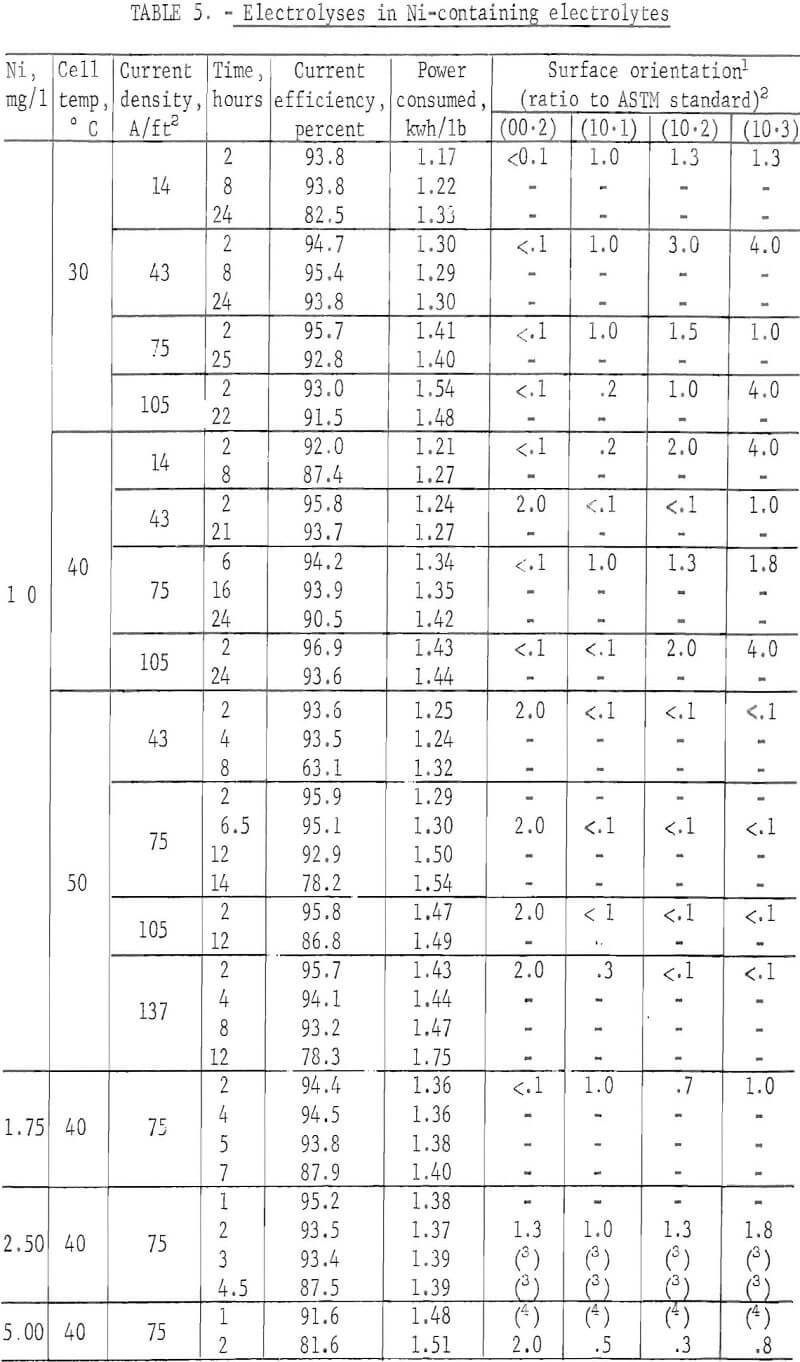
The surface of the deposit produced was fairly smooth, with no apparent corrosion sites found during the period before any impurity effect became evident. For this so-called incubation period, the current efficiency was high and remained constant. The incubation period decreased with increases in the Ni concentration in the electrolyte as shown m figure 14. These deposits were all prepared at 40° C and 75 A/ft². With 1 mg/l Ni in the electrolyte, no drastic reduction in the efficiency occurred at 30° or 40° C for the time interval studies. However, lower current densities tended to give a lower current efficiency with time. The incubation period was apparent when the electrolysis was carried out at 50° C as shown in figure 15. Figure 15 also shows the time independence of the deposits prepared m a pure electrolyte at 50° C and 43 or 75 A/ft². Table 5 summarizes the results.
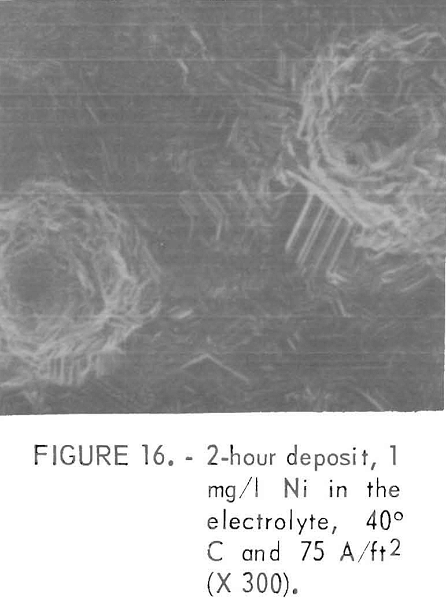
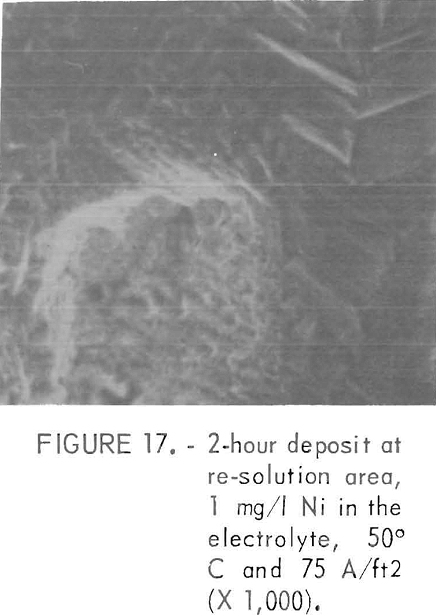
During the initial stage of the re-solution, pits formed which became larger in area with electrolyzing time. Pitting was usually more prevalent at lower current densities or higher cell temperatures. There were only a very few pits in the deposit prepared at 30° and 40° C at current densities of 43 A/ft² or higher. The presence of pits could be detected within 15 minutes of the start of deposition by the presence of Hg bubbles clinging to the cathode surface. The surrounding areas of these pits had a deposition-type or corrosion free morphology with sharp platelets as shown in figure 16 with an absence of a detectable amount of Ni. The deposition-type structure was indicated by the clear facets and an absence of any film like deposits on the pit walls. When the deposit was formed at 50° C the surface exhibited a spiderweb structure with time and very large pits were observed. Figure 17 shows an example of the corrosion-type pit in the early stages with no detect able amount of Ni m the pit With increasing electrolyzing time, this type of pit eventually grows completely through the deposit and is accompanied by vigorous Hg evolution from the pit area. The current efficiency was high even with pits present, provided there was no Ni in the pit.
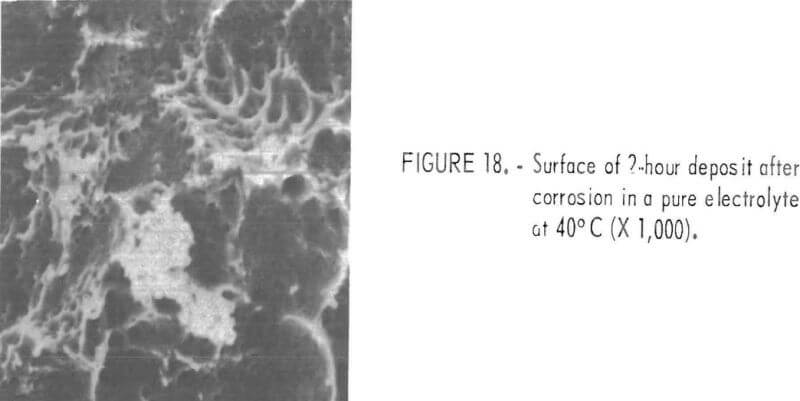
A part of the added Ni codeposited with Zn even though the current efficiency was relatively high. The presence of Ni was verified by corroding the deposit in a pure electrolyte without an applied potential. Figure 18 shows the surface of such a corroded deposit. This film contained a detectable amount of Ni. The corrosion sample was prepared from a deposit which was formed in an electrolyte containing 1 mg/l Ni at 40° C and 75 A/ft².
The codeposited Ni could not be detected m the as-deposited condition by the spectrometer at low concentrations if it was deposited homogeneously throughout the electrode. When re-solution of the Zn occurred, the codeposited Ni tended to remain on the site , thus accumulating to a detectable concentration.
The cathode potential at the re-solution site was more positive than the bulk surface (by approximately 0.1 volt) when the electrolysis was carried out at 75 A/ft² in an electrolyte containing 5 mg/l Ni. However, the overall cathode potential remained fairly constant until the corrosion area became very large The potential difference between the corrosion site and the rest of the electrode surface was very small at the beginning of re-solution. The difference became a maximum when a part of Zn was corroded away and Hg gas evolved from the Al sheet. It was extremely difficult to accurately measure the cathode potential at the re-solution site since the Hg gas from the electrode surface quickly filled the Luggin capillary.
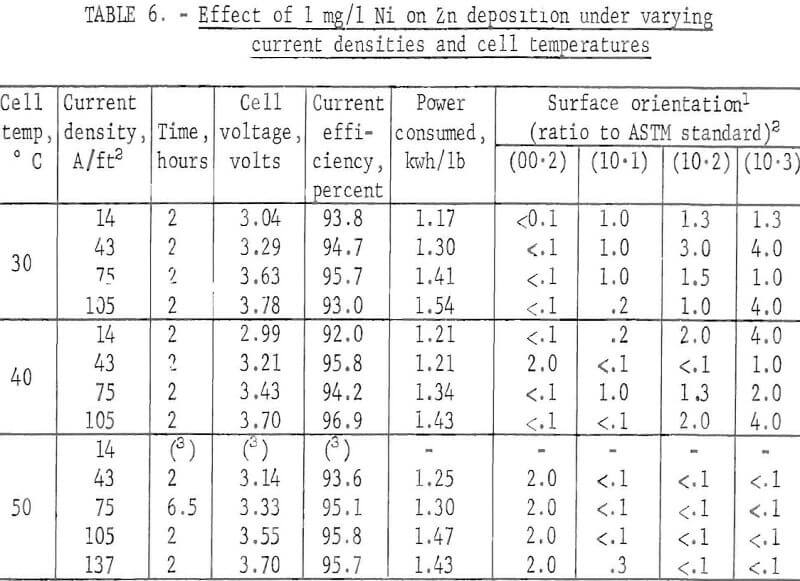
When the orientations of the short-time deposits, prepared from an electrolyte containing 1 mg/l Ni, were compared, the following trend was observed. Generally the (00.2) plane orientation was missing at 30° and 40° C regardless of the current density with the exception at 40° C and 43 A/ft². At 50° C the (00.2) orientation became preferred. It was obvious that the changes in the current density contributed little to alteration of the orientation. Table 6 summarizes the results. Current efficiency was high for all deposits while power consumption was lowest at 30° C and 14 A/ft².
Discussion
Results of this study show that the morphology, orientation, and current efficiency of deposited Zn are dependent on the conditions imposed during electrolysis. The process is so complex that in many instances synergistic effects have made interpretation of certain observed phenomena difficult.
Although anomalies are present in some cases, it is possible to explain, at least partially, two aspects of Zn electrowinning, electrocrystallization, and deposition efficiency. Their explanation should assist in establishing a clear understanding of this process. While these two aspects are intimately related, they will be discussed separately in order to provide more individual emphasis.
Electrocrystallization
The electrocrystallization of metal involves several steps. In the initial or epitaxal stage of growth, the size, shape, and orientation of the deposited crystals are usually influenced by the substrate. This effect was observed for the crystallization of Zn on Al cathodes, as a preferred orientation of (00.2) was common for all deposits at the initial stage of growth, regardless of the electrolyzing conditions. The initial (00.2) basal plane orientation probably was caused by a high concentration of Al+³ in the double layer during the first stage of growth because the (00.2) preferred orientation remained predominant throughout the deposition period when Al+³ was added as an impurity. After a certain time of deposition, a definite orientation pattern was established which depended on the additions made to the electrolyte and the process conditions. The orientation, once established, usually remained constant throughout the electrolyzing period. This indicated that a crystal with well-defined faces could be considered the product of its growth history. Since all crystal faces did not grow at the same rate, the rate of growth determined the probability of their survival. Fast-growing faces disappeared while slow-growing faces survived.
It has been shown previously that a lateral growth mode with (00.2) orientation is favored with increasing temperature, decreasing current density, and an absence of organic additives, such as glue. In general, the (00.2) preferred orientation occurs under conditions where the cathode overpotential is low and there is less interference with the Zn deposition step. The orientation of the Zn electrodeposited from a pure acid Zn solution at 40° C and 75 A/ft² showed a strong mixture of (10.2) and (10.3) preferred orientation after a few hours of deposition. However, the (00.2) orientation was preferred at 50° C These facts indicate that the growth mode changed at 40° C from lateral to more outward as the effect of Al+³ became negligible while the lateral growth mode remained at 50° C. Therefore, it is assumed that the growth rates or velocities for the various planes are the reverse of the population densities or approximately in the order >V(10.3) > V(10.1) > V(11.0) > V(10.2) > V(00.2) with a (00.2) preferred orientation being obtained for a lateral growth mode.
When impurities or organic additives were added to the electrolyte, a change in the relative growth mode occurred For the electrolyzing conditions imposed (40° C and 75 A/ft²), the orientation was dependent on the type and the amount of added species. The presence of Al, Ge, or Sb in the electrolyte tended to produce (00.2) basal plane orientation with the (00.2) plane growing at the slowest rate, assuming lateral growth. However, the (00.2) basal plane edges of the Zn deposit in the presence of trace amounts of Ge or Sb had an irregular step-like or corroded appearance and sometimes pitting was in evidence, particularly as the current efficiency decreased. This particular morphology was characteristic of deposits made with Ge and Sb additions and could be used as a definite indication for the presence of these impurities in the electrolyte. All other cationic impurities caused a mixed or random type orientation; however, the orientation tended to shift toward the preferred (00.2) as the concentration of the impurities increased. It was evident that a more outward mode of growth occurred in the presence of Pb compounds or organic or inorganic additives. The presence of PbO2 in the cell caused a mixed orientation with a strong (10.3) plane showing whereas in the presence of PbSO4 the (10.3) orientation was weak and the (00.2) plane was absent.
The organic additives, animal glue and gum arabic, gave a preferred orientation of (10.1) with a reduction in the current efficiency and facet size also being noted. The reduction in the efficiency can be attributed to a polarization of the cathode or shielding of the available cathode surface for Zn crystallization by the adsorbed additives. The glue itself, or impurities in the glue, could also be serving as sites for Hg evolution due to their lower H2 overpotential. When the amount of adsorbed material became significant, the overpotential on Zn appeared to increase. The hydrogen or Zn overpotential on Zn should vary depending on the orientation and morphology. Assuming that the overpotentials are a function of planar density, these values should increase in the reverse order of the growth velocities. This increased overpotential shifts the mode of deposition from a combination of lateral and outward to a more outward growth with a subsequent decrease in the (00.2) orientation.
The surface morphology was also greatly influenced by the type and concentration of ions in the electrolyte. When the deposits were prepared in electrolytes containing low levels of cationic impurities at 40° C and 75 A/ft², the surfaces of the Zn cathodes had a smooth physical appearance, similar to the pure deposit. However, as the level of impurities increased pitting, waffling or honeycombing (considerable interconnecting porosity giving a low density deposit), and at times localized re-solution became evident, depending on the added species. Occasional pits were found in the deposits prepared from an electrolyte containing Ag , Al, Cu, Mn, or Ni, However, in the presence of Ag, Cu, or Ni impurities localized corrosion occurred usually at the edges or top of the cathode. The remainder of the electrode surface was usually unaffected. The honeycombed surface was found in the deposits prepared from an electrolyte containing Ti.
Pitting became more prevalent with reduction in the current density or an increase in the cell temperature when the electrolyte contained Ni or Sb.
No physical surface irregularities were found on the Zn deposits prepared from electrolytes containing Pb compounds and organic or inorganic additives.
In general, facet size became smaller with increasing levels of added impurities. This can be explained by the fact that the impurities codeposited or interfered with the Zn deposition sufficiently to create more nucleation sites. The reduction in the facet size was more prevalent with the additions of Cd, Cr, Ti, and Pb compounds. With these impurities present, the current efficiency remained nearly constant. This behavior was typical for additives with high hydrogen overpotentials. These impurities appeared to polarize the electrode sufficiently to alter the growth pattern of Zn from that obtained from pure solutions. The Pb content of the cathode was considerably higher when PbO2 was in the cell than for the same amount of PbSO4.
The effect produced by additions of two different additives was of particular interest. The (10.1) preferred orientation obtained in the presence of 10 mg/l animal glue in the electrolyte was altered to a (00.2) basal plane type orientation upon adding 500 mg/l Al+³ with the glue. However, the (10.1) orientation was retained when only 100 mg/l Al+³ was added with 10 mg/l of animal glue. A similar effect was noted when Na2SiO3 replaced the Al+³. With low concentrations of Na2SiO3 the morphology, orientation, and current efficiency appeared to be controlled by the glue. As the silicate content was increased, the surface characteristics remained constant but the current efficiency increased. Finally, the silicate completely overcame the glue effect and gave results similar to those when no glue was present. This points out the importance of controlling the relative ratios of all chemical species in the cell. The results can be optimized only if the relative effects of the additives are accurately known. For example, it is possible to keep the good effect of the glue as a leveling and grain refinement agent and yet increase the current efficiency by means of Al+³ or Na2SiO3 additions. The latter seem, to act as buffering-type agents with respect to hydrogen evolution. After a certain level is reached, however, the electrocrystallization is controlled by the buffering agents and any advantages to be gained from the glue are completely lost.
The results also indicated that any desired orientation could be obtained by a proper adjustment in the concentrations of the impurities and additives. It is now quite evident that merely monitoring the organic additions to the cell for deposit control is not sufficient. Even small concentrations of those classes of impurities normally described as “noninterfering” can alter the deposit substantially and should not be overlooked. This illustrates the importance of completely characterizing the electrolyte if the cathode structure and current efficiency are to be controlled.
Cathode Current Efficiency
The Zn current efficiency was 95 percent or higher and time-independent when Zn was electrolysed from a pure solution at 40° C and 75 A/ft², at least up to 22 hours of plating time Impurities added to the electrolyte usually reduced the current efficiency below that obtained fr om pure solution. The concentration at which a substantial drop in the current efficiency (5 to 10 percent) occurred varied with the impurity and the electrolyzing conditions. It was impossible to compare these results with much of the previous work since no indication of the electrolyzing time was given in most instances.
The cation impurities that greatly lowered the Zn current efficiency can be classified into two groups according to the nature of the reaction involved in reducing the efficiency. The presence of Ag, Cu, or Ni in the electrolyte produces a preferential re-solution of the deposit while Ge, Sb , or Sn causes evolution of H2 over the entire electrode surface without localized corrosion of the Zn.
When the electrolyte contained Ni there was little or no physical evidence of re-solution until a certain electrolysis time had elapsed. When re-solution did start, it was most prevalent at the top or sides of the electrode, with entire areas of the deposit being dissolved and exposing the underlying Al. These areas grew with time and once they were present, there was a continual decrease in the current efficiency with time. Even though large areas of the Al were re-exposed to the solution, no deposition of Zn ever occurred on them This was probably due to the fact that there were certain minute concentrations of impurity remaining there, which lowered the hydrogen overpotential sufficiently to prevent Zn deposition. The degree to which this effect was noted was directly proportional to the Ni concentration. No Ni was detected in the pits or at re-soltuion areas so long as the current efficiency was high, but an accumulation of Ni at these places became apparent when the current efficiency dipped sharply. This usually indicated the end of the incubation period and the beginning of active re solution, With 1 mg/l Ni in the electrolyte there was no evidence of re-solution at 30° or 40° C and 75 A/ft², and the current efficiency was high. At 50° C pitting was apparent from the beginning of the deposition. The pits were shallow initially but eventually they went through the deposit revealing a part of the Al cathode. There was no detectable amount of Ni in the pits in the early stage of deposition. However, a large concentration of Ni on the inside wall of the pits was observed when a sharp drop in the current efficiency occurred. At 50° C the incubation period was shorter at 137 A/ft² than at 75 A/ft² in the presence of 1 mg/l Ni. The higher current density unexpectedly did not protect the Zn from corrosion. This can probably best be explained by the difference in the surface morphology, since the pits were deeper at 137 A/ft². This condition might have made Zn+² diffusion difficult or produced a potential gradient along the pit wall, thus enhancing the corrosion process.
The incubation period became shorter with higher Ni concentrations m the electrolyte at 40° C and 75 A/ft². This was due to more Ni being codeposited with the Zn. Even with the higher Ni concentrations, the only detectable amounts were found at the re-solution sites and not on the unaffected portion of the surface.
The concentrations of Ge, Sb, and Sn required to cause reduction in the current efficiency were very low, by almost an order of magnitude, when compared to the other impurities. These impurities reacted from the start of the deposition but they were never found on the electrode surface, except for Sn. The presence of Sn on the electrode surface can be explained by the fact that the Sn+² originally added to the electrolyte may be oxidized to hydrated SnO2 (collodial) by the O2 in the electrolyte. This oxide then is attached to the electrode. It is not felt that this is the active form of Sn responsible for the poor current efficiency.
Impurities found at the re-solution sites by means of the X-ray spectrometer were Ag, Cu, and Ni while Cd , Pb , and Sn were found in pitted areas. No Al, Co, Cr., Ge Mn, Sb, or Ti was detected on the Zn. If the impurities causing re-solution are of the Ni type, it would be possible to detect their presence by techniques similar to those used in this study. It would not be possible to directly detect the cause of low current efficiency if impurities such as Ge and Sb were active However, these impurities gave such a distinctive morphology that indirect determination of their presence might well be possible
Two mechanisms can be proposed to explain the reduction in the current efficiency due to the presence of impurities in the Zn electrolyte. They are (1) reduction of H+ on codeposited impurities with low hydrogen overpotentials combined with localized cell corrosion and (2) continuous codeposition and evolution of Hg on Zn without preferential areas of Zn corrosion. Mechanism (2) may involve interaction between the impurities and hydrogen ions in the double layer without the impurities actually depositing cathodically on Zn. For example, it has been proposed that hydrides form in the double layer thus providing an alternate path for hydrogen evolution. This reasoning can be substantiated by the fact that these (hydride forming) impurities have never been found on the deposit and only very small concentrations are required in the electrolyte for them to become active. Also they have fairly high hydrogen overpotentiais and would not be expected to be particularly harmful when deposited in the metallic state Among the various impurities tested, Ag, Cu, and Ni can be classified under mechanism (1) while Ge, Sb , and Sn can be grouped under (2)
The following steps are proposed for mechanism (1), and are based on the experimental results obtained. This mechanism would account for the decrease in current efficiency with time which is so prevalent in Zn electrolysis. It is felt that this mechanism is appropriate only when the active impurities are ones with Hg overpotentials lower than Zn and suitable decomposition potentials to allow cathodic deposition
- Initially codeposition of the impurity occurs over the entire electrode surface. The deposition rate will be proportional to the impurity concentration. At this stage the impurity concentration is not sufficient to cause corrosion of the Zn During this period the surface remains generally smooth and uniform and the current efficiency is high. Since the codeposited impurity is uniformly distributed over the entire electrode, a uniform cathode potential exists without the. presence of any extensive mixed potential regions. During the early stage of deposition, the specific current density is very close to the geometrical current density which also assists in producing a uniform cathode potential over the entire electrode surface
- After a certain time, activation of the codeposited impurity begins due to a change in the surface morphology or surface roughness. When the surface becomes rough, the specific cathode current density for Zn decreases at recessed areas This creates a local potential difference on the cathode surface ; which initiates local cell Zn corrosion. The re-solution usually starts at the top or the edges of the cathode. The electrolyte is stagnant at the edges due to adherence of H2 on the edge strips. The highest concentration of the evolving gases is found at the solution level These conditions probably account for the initiation of re solution or local corrosion at these sites
- As the corrosion of Zn becomes more extensive, more impurity is exposed and it tends to agglomerate since it is cathodically protected Thus, the area of exposed impurity increases at the corrosion site. This also creates a high pH and a more positive potential at the corrosion site, which further accelerates the reactions. The pH at the corrosion site can be higher due to a deficiency in H+ which is reduced to H2 by corrosion of Zn When the impurity site becomes larger in area the corrosion rate increases.
- When the corrosion of Zn proceeds so as to expose the Al sheet on which the Zn has been deposited, H2 evolution occurs at two sites, on both the corrosion area and the Al cathode. At this stage, a drastic reduction in the Zn current efficiency is observed. When H2 is evolving from the Al sheet the originally codeposited impurities on Zn accumulate on the Al- Thus , the current density on the Al surface is higher than on the bulk areas where Zn is depositing. The process is therefore somewhat autocatalytic.
In step 1 of mechanism, H2 evolves slightly from the codeposited impurity-site and the Zn current efficiency is inversely proportional to the amount of current used for the Hg evolution. However, this proportionality can only be applied when homogeneous deposition of Zn is taking place. Then the Zn current efficiency is given by
C. E = (1 – i,θ)100/1
where 1 is the geometrical current density, is the current density at the impurity-site, and 0 the fraction of the total surface area covered by the impurity. If 0 is assumed to be proportional to the bulk concentration then
θ = kc0
where k is a constant involving surface conditions such as orientation, grain or facet size, surface roughness, internal stress and c0 is the bulk concentration of the impurity. Based on these assumptions, reversal of the cathode polarity may reveal a magnified effect of the codeposited impurity since dissolution of Zn can take place not only by anodic reactions but also by galvanic reactions between the impurity and Zn. Thus, some of the newer techniques used in Cu electrolysis for improving current efficiency such as periodic current reversal would probably not be applicable in commercial Zn electrolysis. However, if the mechanism proposed is correct, this might afford a shorttime method for evaluating Zn electrolytes In light of the work presented here, this would offer an excellent means of overcoming the effect of impurities in the electrolyte, particularly those which decrease current efficiency by proposed mechanism
In mechanism, H2 evolution would occur by the following steps:
- An impurity hydride forms in the double layer and subsequently diffuses out into the bulk solution.
- The hydride stability would be less in bulk solution due to the lower pH and also there would be no cathodic protection of the hydride, thus the hydride would decompose
- Upon decomposing, H2 would evolve leaving the cation free to participate in another identical sequence of chemical steps The H2 evolution reaction would not have to take place directly on the Zn electrode since the hydride could be formed in the double layer without depositing the impurity on Zn. An example of this reaction is as follows:

These impurities could act as hydrogen depolarizers and their effective concentrations could be orders of magnitude lower than impurities which actually deposit with Zn since they are not consumed by the reaction.
Cell temperature was also an important factor that affected the current efficiency when an impurity, which reduced the current efficiency was present in the eletrolyte. Ordinarily a higher current density assists in improving the current efficiency but this beneficial effect can be eliminated by an increase in the cell temperature. The efficiency for a 24 hour deposit was above 93 percent at 40° C and 43 A/ft² in the presence of 1 mg/l Ni in the electrolyte. However, an increase of the cell temperature by 10° decreased the current efficiency to 80 pet for an 18-hour deposit at 75 A/ft². Mantell states that the maximum level of Ni allowed in industrial practice is 0.01 mg/l in order to have a reasonable current efficiency. However, there is no mention of the electrolyzing time or the surface morphology. For example, if the deposit is very pitted or honeycombed, such as when Ti is present, the allowable level of Ni can be expected to decrease substantially.
Redox potentials of the impurities are very useful in predictiug corrosion behavior. All metals with reversible potentials more negative than hydrogen will tend to be corroded by acid solution in the absence of oxidizing reagents. Half-cell potentials can be used to establish a criterion for corrosion. The half-cell potentials may indicate a spontaneity of metal corrosion but they do not necessarily indicate that corrosion will occur. Metals will be essentially corrosion-free if protective films form or anodic passivation occurs. The exchange current density of hydrogen evolution on metals can be used as a guideline for prediction of the impurity effect on the Zn current efficiency However, the exchange current density is dependent on the specific surface area., and as a consequence, it is dependent on surface roughness.
The effect of impurities on the cathode potential or hydrogen overpotential on Zn is very difficult to correlate since many impurities reacted locally. However, a few previous studies indicated that the cathode potential became more positive in the presence of Ni in the electrolyte. In this study this effect was observed only when localized corrosion of the deposited Zn occurred. The cathode potential also became more positive when H2 evolution occurred over the entire cathode surface. Generally, the hydrogen overpotential decreased with an increase in the area of the impurity-site on the cathode. This might shift the cathode potential toward a more positive value causing increased corrosion of Zn.
While, it is always desirable to decrease all impurities that cause reduction in the Zn current efficiency to a negligible level, this is not always feasible. Considering the difficulties involved in solution purification, it is better to obtain a reasonable current efficiency for a long-time (more than 24 hours) deposit by extension of the incubation period rather than by trying to completely eliminate the impurities. The may be accomplished by making the electrode surface smooth and uniform and free of pits and dendrites. Exact procedures that can be used to accomplish the aforementioned objectives are dependent on the process conditions.
It is essential to properly characterize the entire electrodeposition system before attempting to correct any deficiencies. One important part of this characterization is the orientation and morphology. Unless these determinations are made on a routine basis, it is difficult to believe that the cathodic deposition of Zn can be controlled.
Conclusions
- Electrolcrystallisation of Zn is greatly affected by electrolysis process conditions, such as temperature, current density, and chemical composition of the electrolye . Temperature becomes particularly critical over 40° C.
- Most catonic impurities tend to produce a (00.2) preferred orientation with increasing concentration indicating a lesser degree of electrode polarization with conditions of free growth.
- Organic additives polarize the electrode to a greater extent than most inorganic additives and shift the growth mode from lateral to outward.
- Impurities which are active in an electrolyte may be determined approximately by SEM examination of the deposits. Certain impurities consistently produce a specific type of surface morphology.
- The mecahnism whereby the Zn current efficiency is decreased depends on the active impurity. Experimental results indicate two different mechanisms. One involves the codeposition of a low overvoltage metal with the Zn and subsequent local cell autocatalytic corrosion. The second involves the reaction of the active impurity with hydrogen in the double layer with subsequent decomposition of the hydride in the electrolyte, leaving the impurity free to react again. These results indicate that a greater amount of impurity is necessary for the first mechanism to be valid.
- The presence of certain active impurities is detectable by means of the nondispersive X-ray spectrometer on the SEM. This is particularly true for metals which would decrease current efficiency by the first mechanism. Some active impurities which either do not plate out or are too low in concentration cannot be detected.
- The incubation period is inversely proportional to the impurity concentration and temperature. Morphology of the deposit is important also in evaluating this parameter as rough, irregular, or pitted deposits present conditions more conducive to initiation of Zn corrosion, which is one of the important steps (step 2) to be considered in mechanism (1) described under Cathode Current Efficiency.
- The amount of Pb contamination in the Zn cathode is dependent on the chemical phase of Pb in the electrolyte, for example, it is higher with PbO2 in the cell than with PbSO4.
Related: Best Metal Glue for 2022
