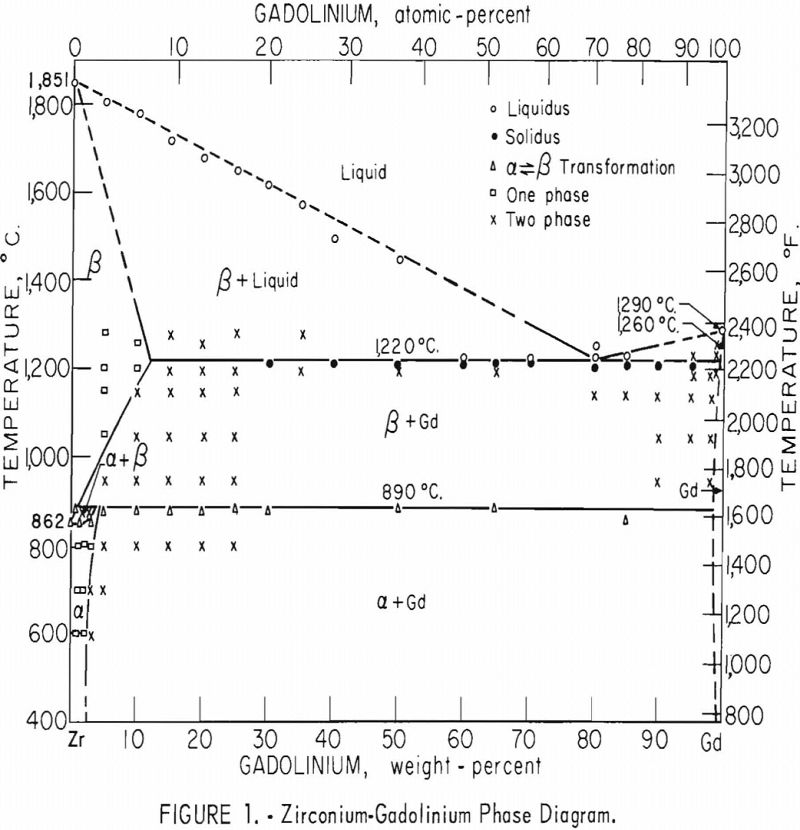
The investigation of the zirconium-gadolinium equilibrium diagram revealed a eutectic system with limited terminal solubilities and one peritectoid reaction. The eutectic point occurs at about 82 percent gadolinium. The eutectic isotherm, at 1,220° C., extends from about 12 to 99+ percent gadolinium. The peritectoid isotherm, at 890° C., involving the alpha-beta transformation of zirconium, extends over essentially the entire composition range, from about 2 to 99+ percent gadolinium. Very little solubility of zirconium in gadolinium was indicated. A transformation was observed at 1,260° C. in both unalloyed gadolinium and gadolinium alloyed with zirconium.
The equilibrium diagram in figure 1 is believed to be accurate within the limits of this investigation. The eutectic and peritectoid isotherms and gadolinium transformation are accurate within ±5° C.; the other temperatures are accurate within ±15° C. The compositions are believed to be accurate within 1 percent by weight.
No attempt was made to measure the physical properties of the alloys investigated other than the hardness of as-cast and cold-rolled alloys. Because of the reactivity of gadolinium, alloys containing more than 5 percent would probably exhibit reduced corrosion resistance.
The investigation of the zirconium-gadolinium equilibrium diagram was part of a program to investigate rare earth alloys for use as nuclear reactor control materials.
Investigation of the zirconium-gadolinium equilibrium diagram revealed a eutectic system with limited terminal solubilities and one peritectoid reaction. The eutectic composition occurs at about 82 percent gadolinium, and the eutectic isotherm, which occurs at 1,220 ±5° C., extends from about 12 to 99+ percent gadolinium. A peritectoid isotherm occurs at 890 ±5° C. and extends from about 2 to 99+ percent gadolinium. The solubility of gadolinium in beta zirconium decreases from about 12 percent at 1,220 ±5° C. to about 2 percent at 890 ±5° C. The solubility of gadolinium in alpha zirconium decreases from approximately 5 percent at 890 ±5° C. to between 2 and 3 percent at 600° C. Very little solubility of zirconium in gadolinium was indicated. An allotropic transformation of gadolinium was observed at 1,260 ±5° C. A change of the gadolinium transformation temperature on alloying with zirconium was not observed.
The principal methods used in determining the zirconium-gadolinium phase system were melting-point determinations, thermal analyses metallography, and X-ray diffraction. Melting, heat treating, swaging, and thermal analyses were conducted in a vacuum, helium atmosphere, or a protective sheathing because of the avidity with which oxygen combines with zirconium and gadolinium at elevated temperatures. As every known refractory contaminates these metals to some extent at temperatures above their melting point, special techniques were employed to contain them.
Introduction
The investigation of the zirconium-gadolinium phase diagram is part of a project undertaken by the Bureau of Mines and sponsored by the Atomic Energy Commission to investigate rare-earth alloys. Gadolinium is of interest as a control material for use in high-temperature nuclear reactors because of its high thermal-neutron absorption cross section of about 46,000 barns. However, gadolinium is very reactive, and must be protected from reactor coolants. Investigations are being conducted to reduce the reactivity by alloying. Zirconium was selected as an alloying material because of its excellent corrosion resistance. A search of the literature revealed no information on zirconium-gadolinium alloys.
The physical properties of zirconium are well established, but only recently were the properties of gadolinium accurately determined and reported. Some of the physical properties of zirconium and gadolinium which were important to the development of an equilibrium diagram and which would be useful in evaluating alloys of these two metals are listed in table 1.
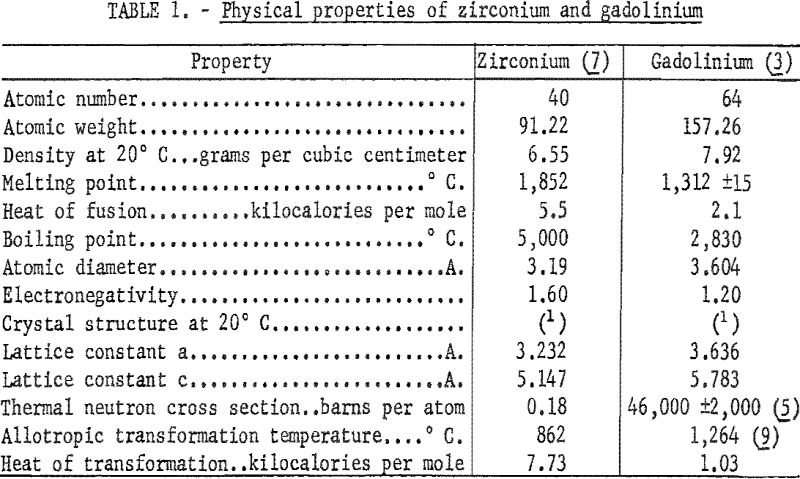
A review of the theories of alloying indicated the possibility of considerable terminal solid solubility of zirconium-gadolinium alloys. The differences of atomic diameters of zirconium and gadolinium atoms is between 8 and 15 percent, indicating considerable solid solubility of these two elements. The classical Hume-Rothery rule predicts considerable solubility when the atomic sizes differ by no more than 15 percent. Similarities of crystal structure also play a role in the solubilities of elements. Zirconium and gadolinium both have close-packed hexagonal structures up to their transformation temperature. Zirconium above 862° C. is a body-centered cubic structure. The differences in electronegativities apparently play an important part in the extent of terminal solubility and formation of compounds. According to Gschneider, a difference in electronegativities of 0.4 between two alloying elements is the maximum limiting value at which any terminal solubility can be expected. The difference between the electronegativities of gadolinium and zirconium listed in table 1 is 0.4. A later work, by Montgomery, gives a value of 0.95 for the electronegativity of gadolinium. Montgomery indicates that the difference between the electronegativities of gadolinium and zirconium is 0.75.
Experimental Procedure and Results
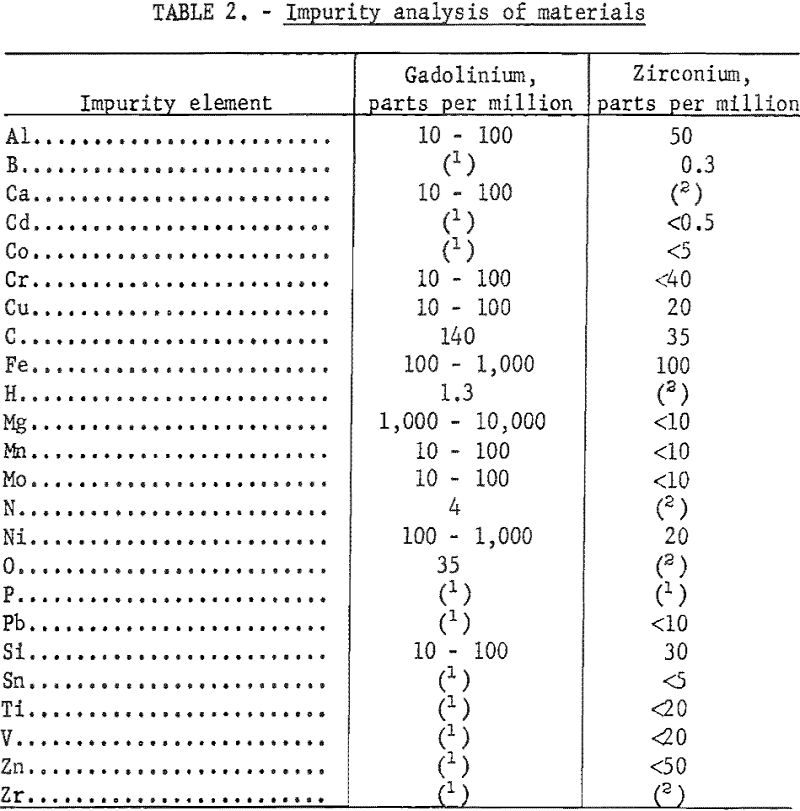
High-purity crystal-bar zirconium and gadolinium of better than 99-percent purity were used in this investigation. Impurity analyses of the gadolinium ingot and iodide crystal-bar zirconium are presented in table 2.
These alloys were melted in an arc furnace using a nonconsumable tungsten electrode and a water-cooled copper hearth. The crucibles in which the alloys were melted into buttons were shallow depressions machined in the hearth. Evacuation helium backfilling, and scavenging with zirconium were employed to control the furnace atmosphere. Proportioned charges of 30 to 50 grams of zirconium and gadolinium were melted four times; buttons were turned between melts. When small round ingots were desired for hot-working by swaging, the alloy buttons were melted near the upper edge of one of the crucibles in the hearth and then drawn downward by suction into a round, tapered copper mold in the bottom of the crucible. The nominal composition of materials before melting, the X-ray fluorescent analyses after melting, and the hardness of as-cast alloys are tabulated in table 3.
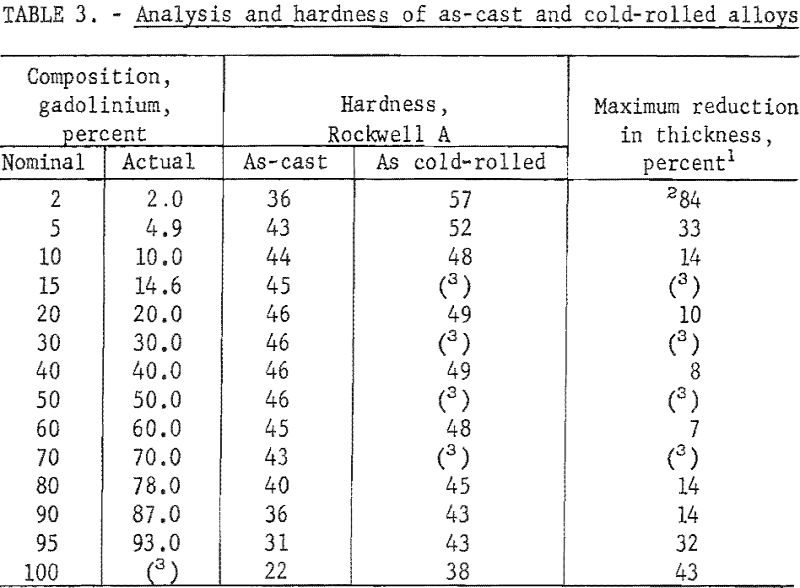
The as-cast buttons were hot- and cold-worked. Several buttons, representative of various consolidated alloys, were cold-rolled at room temperature until they began disintegrating. Only alloys containing less than 10 percent zirconium or gadolinium were significantly amenable to cold-working; reduction in area before disintegrating and hardness after cold-rolling are also listed in table 3. Most of the data accumulated in this investigation were based on hot-worked material. The round-cast ingots were sheathed in iron pipe prior to being hot-worked. Alloys containing less than 50 percent gadolinium were heated to 850° and alloys with more than 50 percent gadolinium were heated to 750° C. prior to being hot swaged. The sheathed ingots were reduced to 1/8- to 3/16-inch diameter after desheathing. All alloys hot swaged readily without breaking.
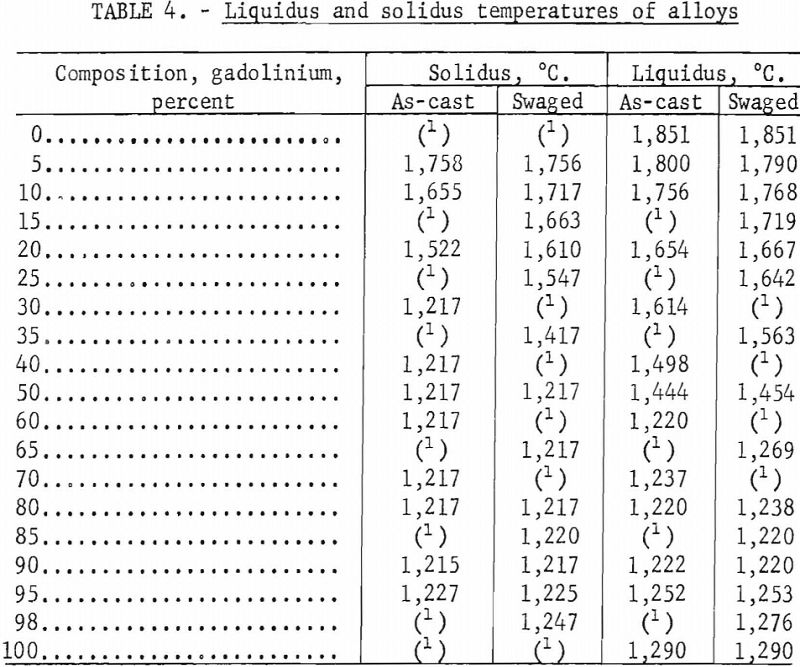
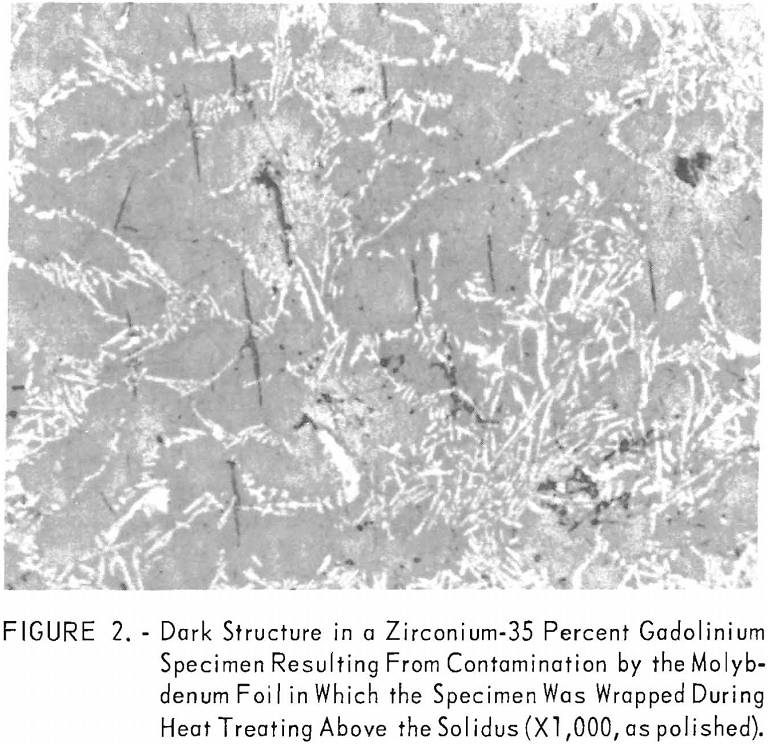
Solidus and liquidus determinations were made by a melting-point determination method reported by Deardorff and Hayes. In this method, a specimen with a specially prepared hole for black-body conditions is heated by induction. The melting points observed on as-cast and hot-worked specimens are listed in table 4 and illustrated in the zirconium-gadolinium equilibrium diagram in figure 1. Melting-point data indicated one or two eutectics. Somewhat erratic results were obtained in alloys with high-zirconium content. Solidus points were observed at lower temperatures in coarse, as-cast structures than in homogenized materials. Several materials, such as molybdenum, graphite, tungsten, tantalum, and boron nitride, were investigated for use as crucible materials in which to conduct melting-point determinations. Unfortunately, all of these refractories contaminated the alloys. Contamination of a zirconium-35 percent gadolinium specimen by molybdenum is illustrated in figure 2. The dark contamination structure was observed by metallography in the specimen after it was sheathed in molybdenum foil, held above the liquidus at 1,280° C. for 1 hour, and water quenched.
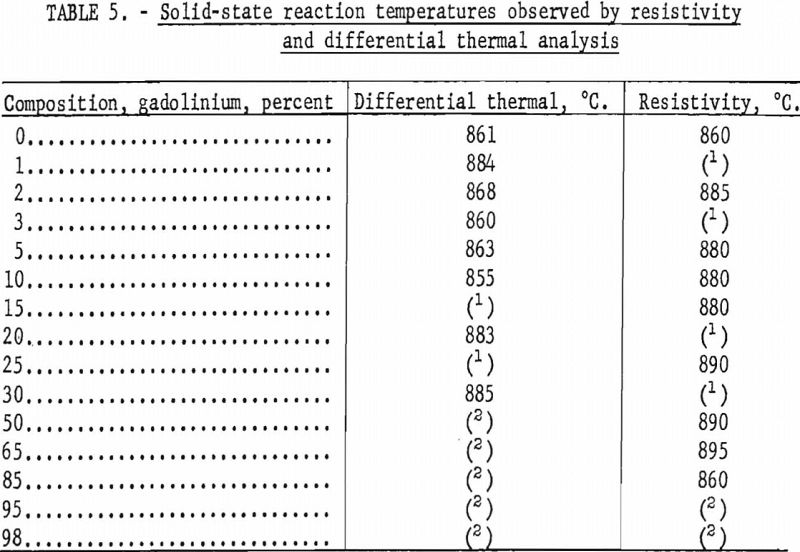
Solid-state reaction temperatures were determined by differential thermal analyses and resistivity measurements at elevated temperatures on swaged alloys. Contact was made on the resistivity specimens by spot welding molybdenum wire to the ends. Chromel-alumel thermocouples were connected to the differential thermal specimens by spot welding. Resistivity and thermal analyses were conducted by suspending the specimens in a quartz tube and heating the tube in a resistance furnace. The tube was evacuated and backfilled with helium, which had been scavenged by zirconium, to slightly above atmospheric pressure. Solid-state reaction temperatures were obtained by cyclic heating and cooling. Some of the transformation temperatures observed on swaged samples are tabulated in table 5.
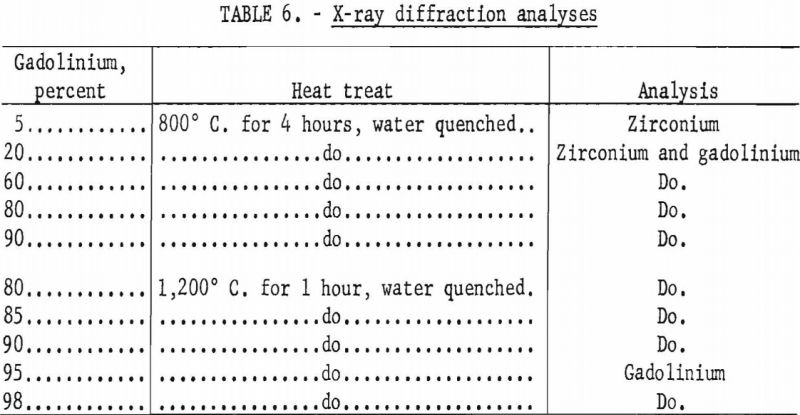
X-ray diffraction studies were conducted on only a limited number of samples, and the results are listed in table 6. Solubility of between 5 to 20 percent gadolinium in zirconium was indicated at 800° C. Analyses of alloys with large percentages of gadolinium, which had been heated to 1,200° C. for 1 hour and water quenched, indicated a solid solubility of 5 to 10 percent zirconium in gadolinium. The presence of secondary phases were not indicated by X-ray diffraction analyses.
Melting-point, X-ray diffraction, and solid-state transformation temperature data indicated an equilibrium diagram with one or two eutectics and limited terminal solid solubility. Also, extended eutectic and solid-state reaction isotherms were indicated.
This investigation required considerable metallographic work. The preliminary metallographic investigation was conducted on as-cast alloys to determine existing phases and to establish eutectic compositions. The vast majority of the metallographic work was conducted on swaged and heat-treated specimens.
Specimens were sealed in helium-filled quartz ampules, heated at temperatures from 600° to 1,290° C. for 1 to 240 hours, and water quenched by transferring the ampule containing the sample as rapidly as possible to ice water and breaking the ampule under water. These specimens were mounted in bakelite and polished by standard procedures employing water as the abrasive suspending agent and lubricant except for the last two polishing steps. As gadolinium oxidizes readily in aqueous solutions, the last two polishing steps were conducted with 6- and 1-micron diamond compounds, respectively, using kerosene as a lubricant. The abrasive and kerosene were washed off with anhydrous methyl or ethyl alcohol.
No difficulty was encountered in etching zirconium-rich alloys, but as the gadolinium content was increased, difficulty from staining and overetching was encountered. Cain-B (1) etch (45 milliliters of H2O, 45 milliliters of HNO3, and 10 milliliters of HF) was very satisfactory for zirconium-rich alloys up to 35 percent gadolinium. Several types of etchants were investigated for use on gadolinium-rich alloys after polishing, but the most satisfactory were nital etchants (1-5 percent by volume of HNO3 in a solution of absolute methyl or ethyl alcohol). It was necessary to use anhydrous alcohol in the etchant and as a subsequent wash to prevent staining of gadolinium-rich alloys.
The phases observed by metallography in heat-treated alloys are illustrated in the zirconium-gadolinium diagram in figure 1. Only metallographic data that were considered to accurately locate phase boundaries were listed.
Discussion of Results
Very little difficulty was encountered in melting and hot swaging zirconium-gadolinium alloys. The analyses of all the alloys prepared were very close to the intended composition. Also, no difficulty was encountered in separating the iron-pipe sheathing from the alloy by machining after hot swaging.
Melting-point data indicated the possibility of two eutectic points. These data were checked by
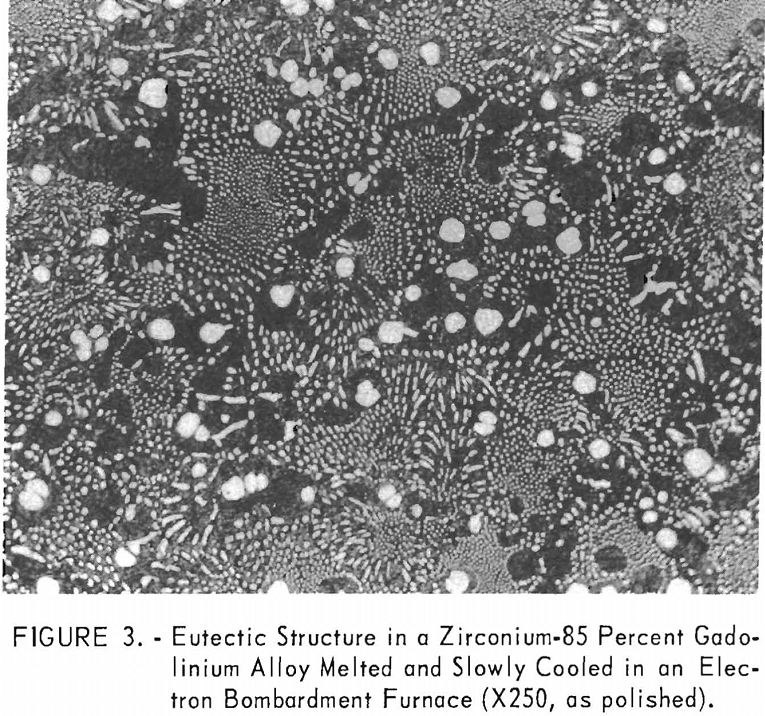
metallography. The eutectic composition of alloys melted and cooled on the water-cooled copper hearth could not be resolved even at high magnification because of their very fine structures. The melting and slow cooling of alloys to obtain coarse structures was investigated by several methods. All the refractory materials investigated for use as a crucible were valueless because they contaminated the alloys melted in them too extensively. The problem was surmounted by melting in an electron-bombardment furnace. A swaged alloy rod was suspended in the furnace, and a droplet was melted on the lower end of the rod and slowly cooled. A zirconium-85 percent gadolinium alloy eutectic structure formed in this manner is illustrated in figure 3. No contamination or segregation by gravitational separation was observed on as-cast structures produced in the electron-bombardment furnace. Metallographic examination of electron-bombardment melted alloys indicated the presence of one eutectic point at about 82 percent gadolinium.
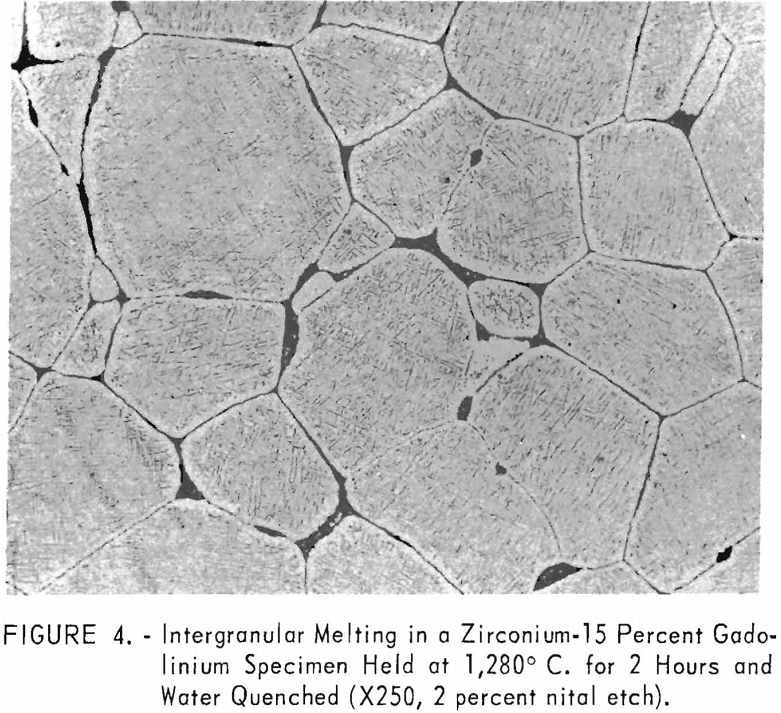
Solubility limits and the location of the
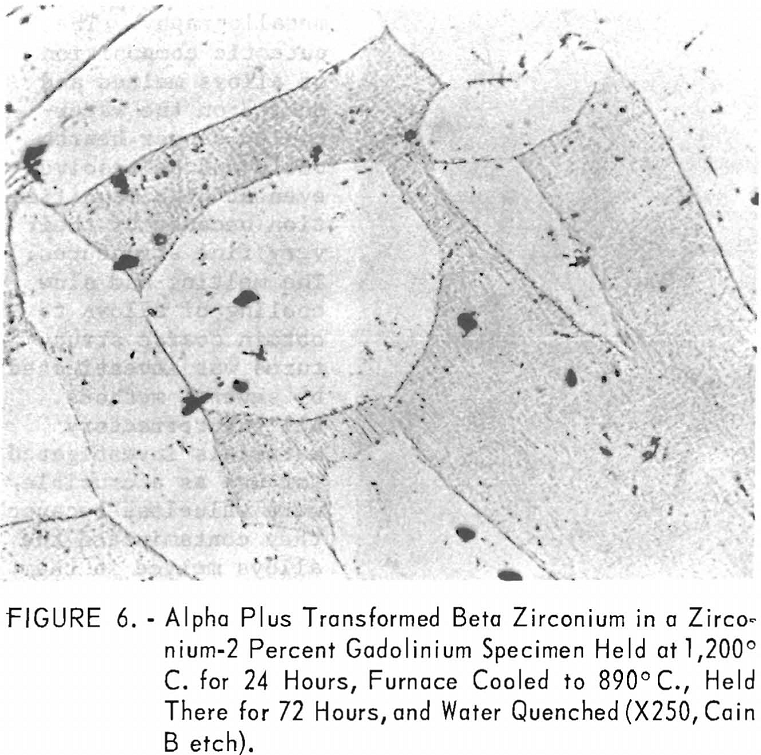
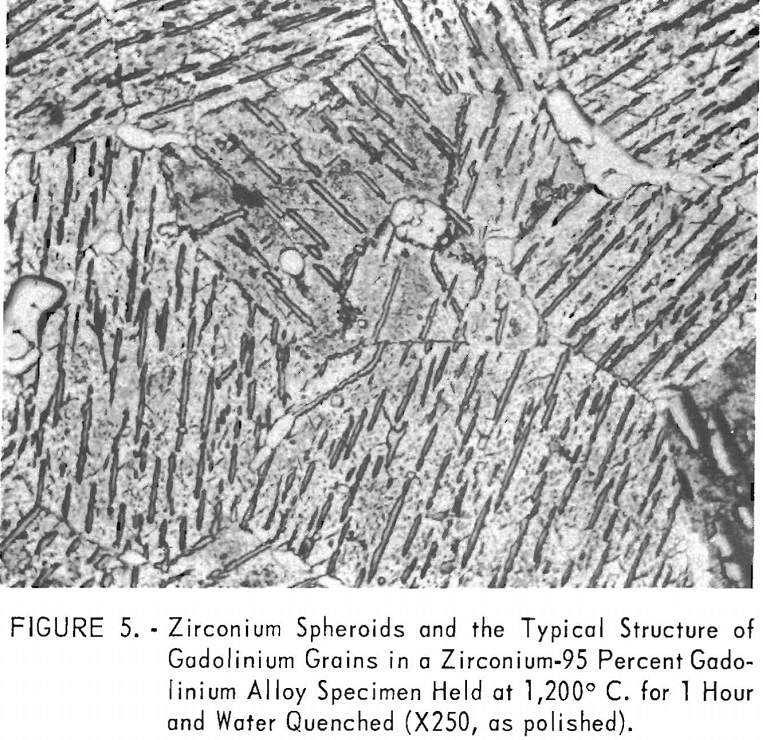
eutectic and peritectoid isotherms were established by metallography. The position of the eutectic isotherm agreed very well with the melting-point data. Metallographic data indicated far less solubility of gadolinium in beta zirconium than melting-point data indicated. The structure of a zirconium-15 percent gadolinium alloy specimen, which was one of many specimens that helped determine the maximum solubility of gadolinium in beta zirconium, is illustrated in figure 4. This specimen, with intergranular melting, was held slightly above the eutectic isotherm at 1,280° C. in the beta + liquid field and then water quenched. The maximum solubility of gadolinium in beta zirconium was determined to be about 12 percent gadolinium. Very little solubility of zirconium in gadolinium was observed. The structures revealed in figure 5 exemplified the presence of about 5 percent zirconium and the characteristic structure of gadolinium in a zirconium-95 percent gadolinium alloy specimen. Metallographic data on the location of the peritectoid isotherm agreed very well with resistivity measurements at elevated temperatures and differential thermal data except for the gadolinium-rich portion where solid-state reaction indications were not observed by metallography. The alpha plus transformed beta structure of a 2-percent gadolinium specimen, which helped position the narrow alpha plus beta field, extending from about 1 to 5 percent gadolinium, is illustrated in figure 6.
A solid-state reaction was observed in gadolinium at 1,260 ±5° C. by differential thermal analyses which agreed very well with that reported by Spedding and Daane. A lowering or raising of the transformation of gadolinium on alloying with zirconium was not observed by extensive metallographic and differential thermal analyses.
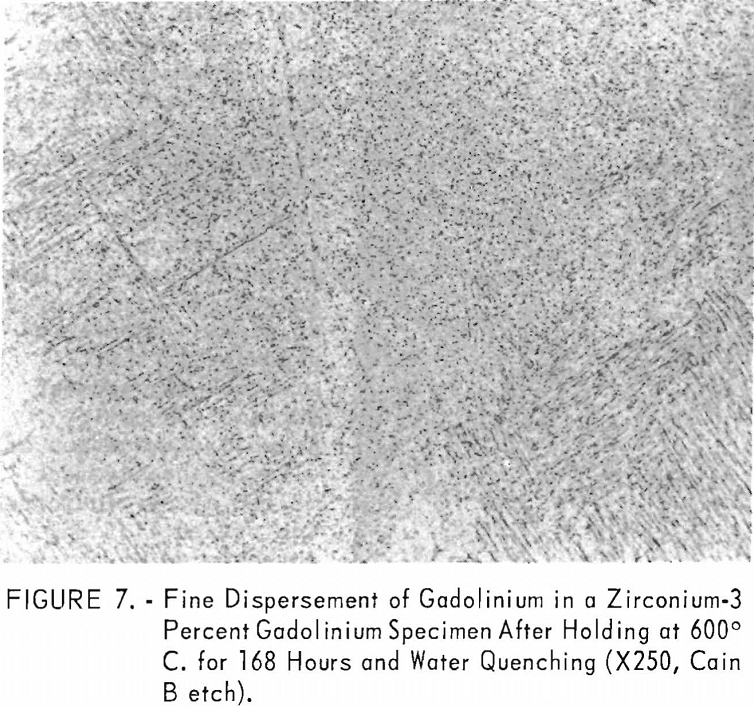
The alpha (alpha + beta) solvus position in the equilibrium diagram was determined largely by metallography. One of the specimens, a zirconium-3 percent gadolinium alloy, which helped position this solvus, is illustrated in figure 7. The gadolinium-rich delta phase was accentuated by the Cain-B etchant more than the actual composition warrants. This property was not noted on specimens which were quenched from temperatures in the alpha- zirconium field.
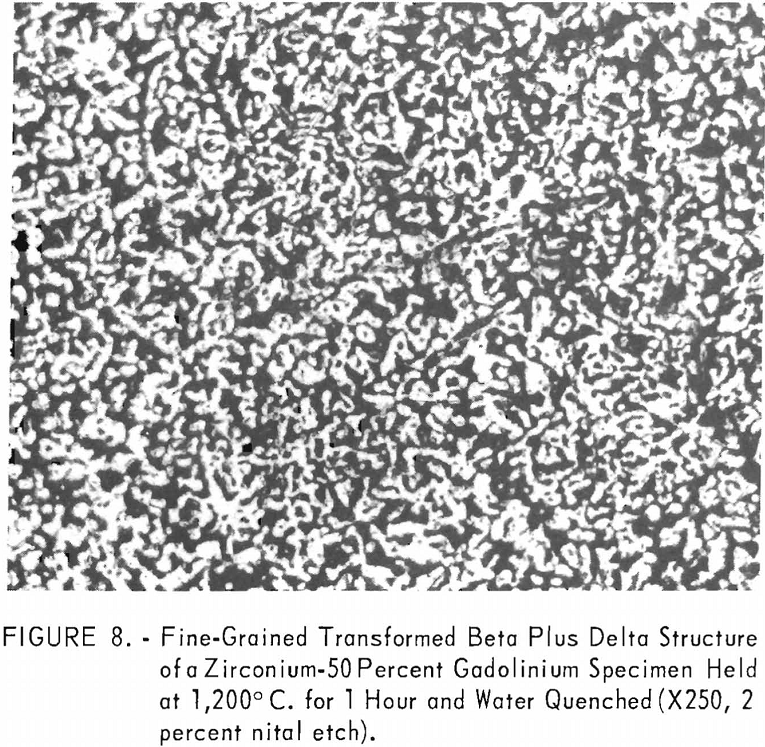
A structure typical of many of the alloys that were quenched from the beta plus delta field is illustrated in figure 8. The metallurgical structures of these alloys were fine grained.
