New mineral processing techniques being investigated by the Bureau of Mines and others, such as processing at elevated temperatures, leaching with acids and bases, chloride leaching, and dissolution in fused salt baths, may require the use of construction materials that, have good corrosion resistance. One example is the construction material needed to line leaching vessels used in the extraction of alumina from clay using hydrochloric acid (HCl), nitric acid (HNO3), or sulfuric acid (H2SO4). In the HNO3 extraction process studied by the Bureau, acid concentrations range up to 50 pct and temperatures to 120° C.
Industrial equipment designers, fabricators, and material suppliers of acid processing systems were surveyed for their recommendations on ceramic construction materials to be used in HNO3 and other environments. Although the suppliers recommended acid brick, carbon brick, or dense firebrick, they advised that materials be tested in an environment simulating actual conditions because of limited experience with HNO3 processing and the uniqueness of each industrial process. In general, the suppliers could say only that their brick would pass ASTM-C279 specifications, which deal with H2SO4 rather than HNO3.
A general listing compiled from the literature by Samsonov and Vinitskii gives the resistance of several refractory compounds to acid and alkali attack at various times and solution concentrations. An indication of the compound’s acid resistance is given by the amount of insoluble residue remaining after acid exposure. The reaction behavior of refractory compounds in different chemical environments (including acid) is discussed by Samsonov in a list collected from various literature sources. No reference is made to acid concentrations.
A general rating of the performance of 17 ceramic materials subjected to different acids was reported by Campbell and Sherwood with no reference to acid concentration or temperatures. A general ranking of the resistance of 10 ceramic materials to acid attack was made by Lay in 1979 based on data from literature and commercial manufacturers, and on the weight loss of materials exposed to concentrated boiling acid for about 30 min. A study conducted by Clinton, Lay, and Morrell evaluated the resistance of a reaction-bonded silicon carbide exposed to various acids, bases, and molten salts and metals at temperatures varying from room temperature to 1,100° C and at times from 0.5 to 168 h. The chemical resistance was determined by visual appearance and specimen weight loss per unit surface area.
A 1981 literature review by T. A. Clancy, on the corrosion of ceramic materials by various aqueous solutions of acids and bases, indicated that nearly all the data available refer to glass. Corrosion data on other industrial ceramic products were scarce and based primarily upon supplier information, which often does not cover the specific conditions of interest. This lack of definitive data was partly due to the wide variation in industrial products and their applications. Therefore, fundamental engineering data on the corrosion resistance of candidate materials under a variety of conditions are necessary.
This report presents the results of tests to evaluate the resistance of eight commercially available ceramic materials (two red shale, two fireclay, a carbon, a silica, a clay-bonded silicon carbide, and a high-alumina brick) exposed to 40 wt pct HNO3 at 70° and 90° C and 60 wt pct HNO3 at 50°, 70°, and 90° C for 110 days.
Test Equipment and Sample Description
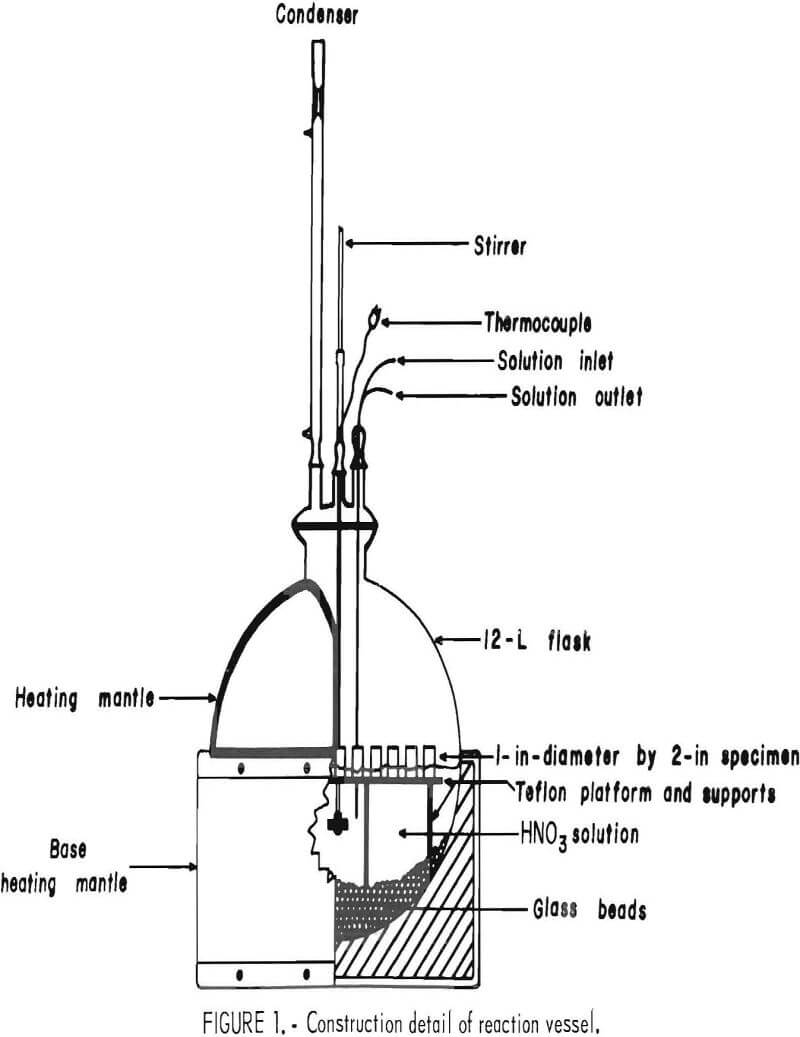
A test reactor to expose the selected ceramic materials to various conditions was designed and constructed. The test unit, shown in figure 1, operates at temperatures up to 250° C. Heat was supplied to the spherical Pyrex heat- resistant glass reaction vessel by heating mantles. The temperature was controlled by means of a variable power source and monitored in the reactor by a type K thermocouple. A peristaltic pump was used to withdraw, add, or circulate liquid in the system. The system was continuously agitated by a variable-speed stirrer, while a condenser refluxed any vapor and maintained the system at atmospheric pressure. Samples (1 in. in diameter by 2 in high) were placed on a 3/8-in Teflon fluorocarbon polymer platform and positioned vertically so half of the sample was immersed in the acid solution (liquid exposed) and half of the sample was exposed to the atmosphere above the acid solution (vapor exposed). Grooves cut in the upper surface of the platform allowed liquid to circulate under each test specimen. The platform was prevented from moving by embedding the supporting legs in layers of 6-mm glass beads. Bulk density and percent apparent porosity were determined for each test specimen before exposure, using ASTM test C20-80a.
Atomic absorption analysis was used to measure ion concentration in the acid leach solutions. An acid-filled vessel containing no test samples was used to provide a control solution for establishing background ion concentration.
Samples were examined optically before and after exposure, at a magnification of 20, for any structural or mineralogical changes that might be occurring. X-ray crystallography, electron probe, and scanning electron microscopy were used to characterize the leaching effects in the samples.
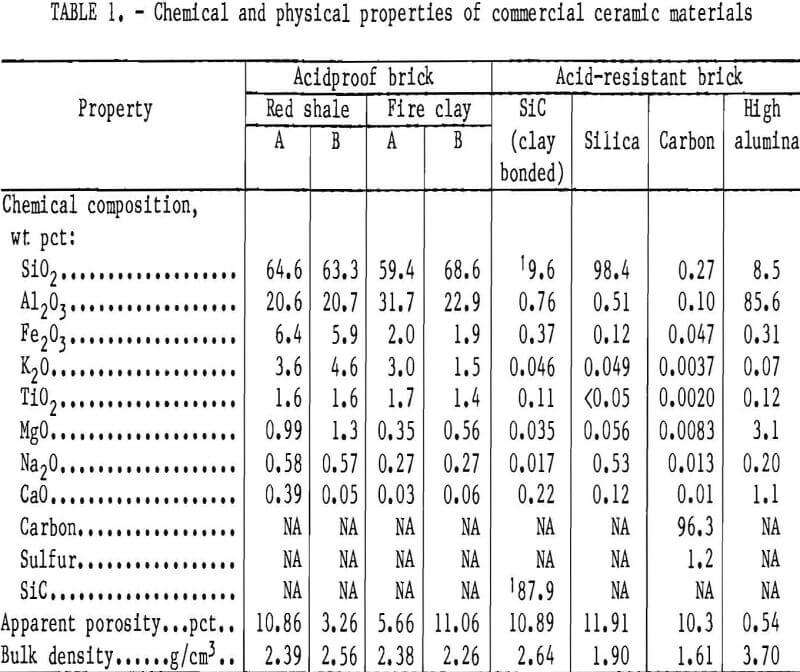
The properties of four types of brick commonly referred to in industry as acid- proof are listed in table 1 as red shale A and B and fire clay A and B. The main chemical differences are in the content of alkali and alkaline earth metals and iron oxide. Red shale A and fireclay B brick have high apparent porosity and low bulk density. The chemical and physical properties of four ceramic brick classified as acid-resistant and labeled as high alumina, carbon, silica, and silicon carbide (SiC) brick are also listed in table 1.
Results and Discussion
Acidproof Brick
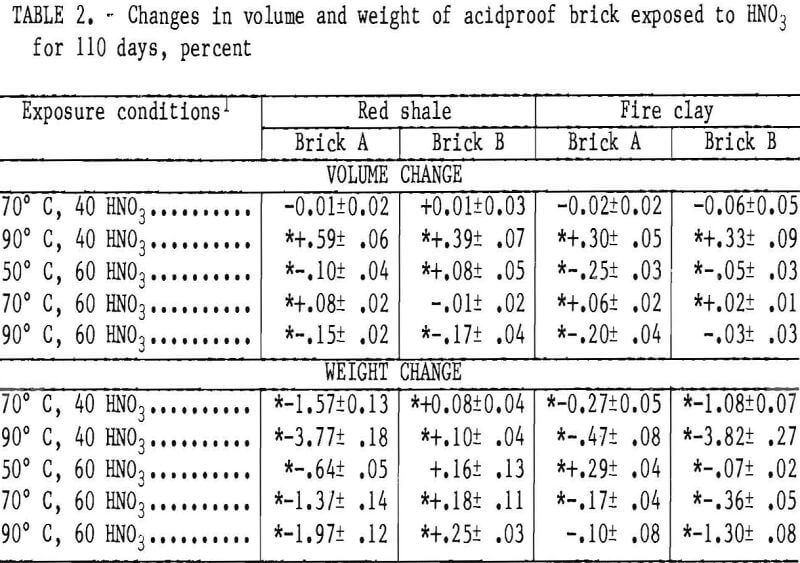
Volume changes occurring in the acid-proof brick are listed in table 2. Statistically significant volume changes are generally small, occurring in an inconsistent manner for all brick. No trends were observed with changes in acid concentration or temperature.
Statistically significant weight changes occurring in the acidproof brick are also listed in table 2. The red shale brick B samples showed gains in sample weight with an increase in either temperature or acid concentration. Analysis of the brick phases by X-ray and optical microscopy did not reveal the cause of these weight gains. All the other acidproof brick samples had statistically significant weight losses that generally increased with increasing temperature or decreasing acid concentration. Red shale A and fireclay B bricks,
Note.—Plus-minus (±) values are at 95-pct confidence intervals.
which have the highest apparent porosity of the acidproof bricks, have the highest weight losses of 3.77 and 3.82 wt pct, respectively, when exposed to 40 wt pct HNO3 at 90°C. Under equivalent conditions, fireclay brick A had the lowest weight losses, reaching a maximum loss of 0.47 wt pct in 40 wt pct HNO3 at 90° C.
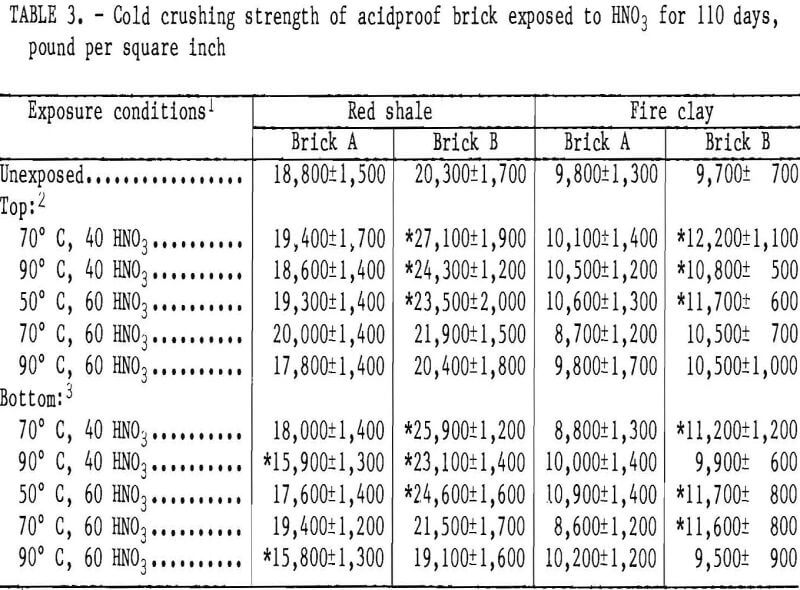
Cold crushing strength data for the, acidproof brick are listed in table 3. There are only a few statistically
Note.—Plus-minus (±) values are at 95-pct confidence intervals.
significant strength changes recorded for red shale A and none for fireclay A brick, with no discernible trends in spite of the weight losses observed for these samples. Red shale brick B and fireclay brick B exhibited statistically significant strength increases in a majority of the exposure conditions. No significant differences exist between cold crushing strength values of the top (vapor exposed) and the bottom (liquid exposed) halves of the test samples.
The weight percent of ions leached from the acidproof bricks are listed in table 4. Although monitored, no silicon ion was detected as leached from the samples. Generally, the amount of ion leached from the samples increased with increasing temperature and decreasing acid concentration, with the lowest rate of leaching occurring at the test condition of 50° C and 60 wt pct HNO3. This same trend of temperature and acid concentration was observed in the sample weight losses for all brick except red shale brick B.
During the 110-day leaching period, the rate at which ions were leached from the samples at any given temperature and acid concentration tended to follow the general second-order parabolic equation:
y = a1 + a2x + a3x²,
where y = ion concentration in solution,
x = days,
and a1, a2, a3 = constants.
Of 138 ion leach determinations, 118 yielded coefficients of correlation above 0.95 for this equation.
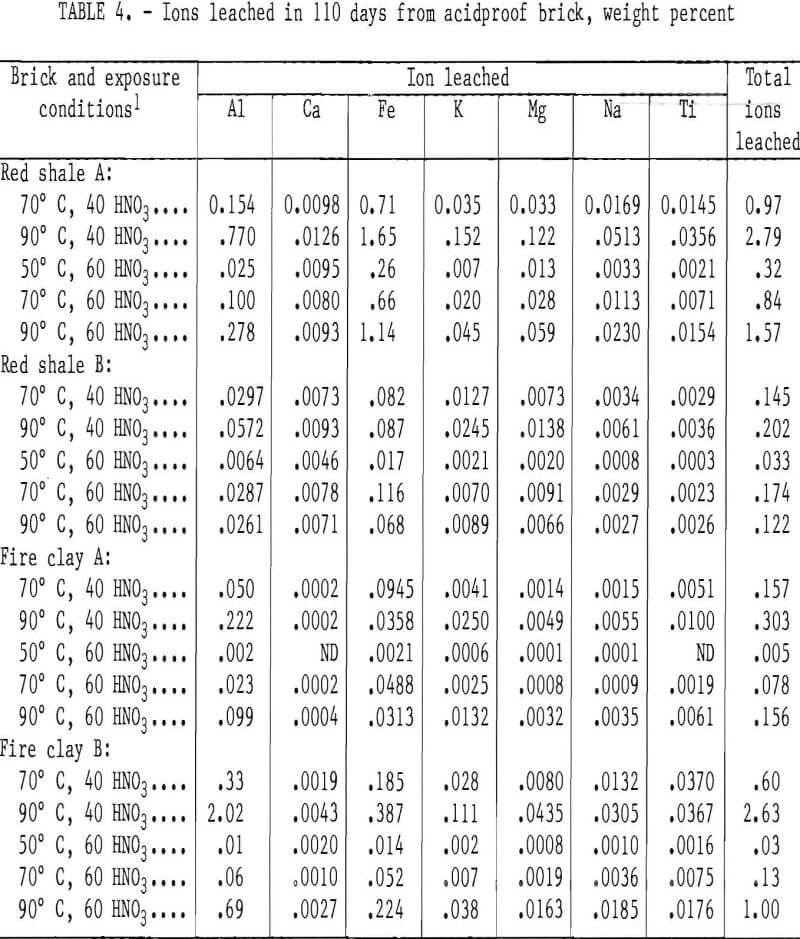
The more porous bricks (red shale A and fire clay B) exhibited several times more total ions leached at all of the five test conditions than did the denser types (red shale B and fire clay A). For the red shale bricks, iron was consistently the most leachable ion followed by aluminum, with other ions being leached to a much lesser extent: In the fireclay bricks, aluminum was normally more easily leached than iron, again with other ions being leached to a much lesser extent.
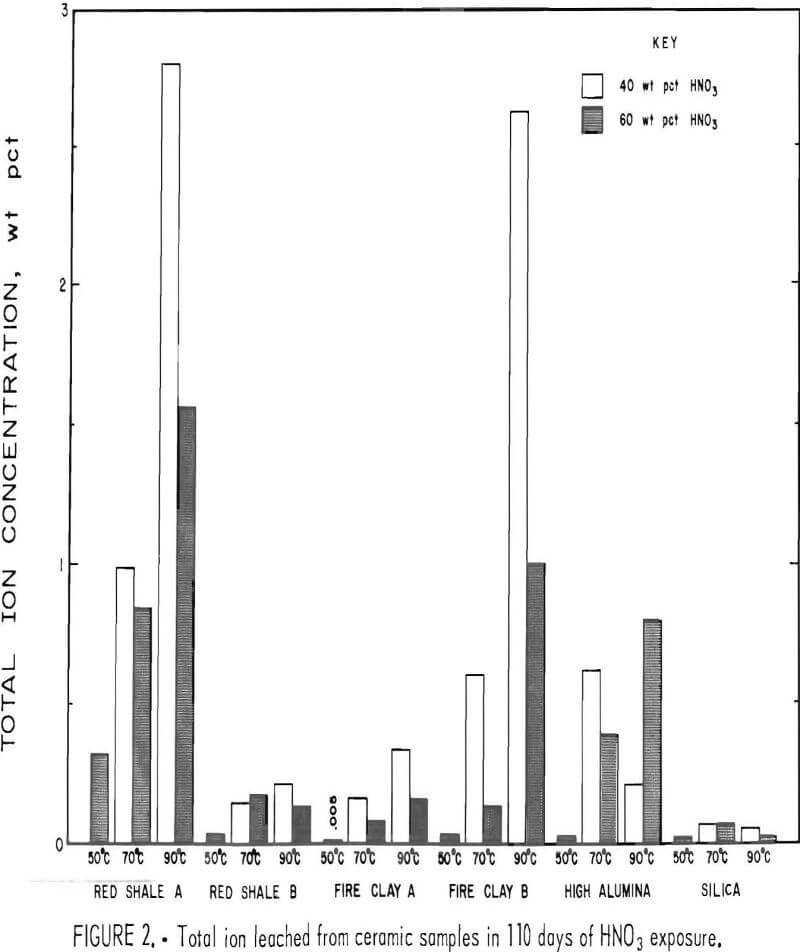
Figure 2 shows the total weight percent of ions removed from red shale A and B and fireclay A and B brick samples after 110 days of exposure to 40 wt pct HNO3 at 70° and 90° C and 110 days of exposure to 60 wt pct HNO3 at 50°, 70°, and 90° C. Except at 70° C for the red shale brick B, the total weight percent ion leached in 40 wt pct HNO3 was higher than the quantity leached in 60 wt pct HNO3. The quantity of ions leached from the red shale and fireclay brick increased with temperature for both 40 and 60 wt pct HNO3 except for red shale brick B. These trends were noted for weight losses of red shale A and fireclay A and B bricks.
As shown in figure 2, red shale brick A had the greatest total ion weight loss (2.8 wt pct) of any sample in a 40- wt-pct-HNO3 leach solution at 90° C, the most severe leach environment tested. Red shale brick B, in contrast, had the least total ion weight loss (0.2 wt pct) of any acidproof brick in this leach solution. As mentioned previously, those samples with the highest porosity had the highest rate of ion removal.
In spite of the amount of ions leached from both the fireclay and red shale brick, no correlation exists between increased leaching and cold crushing strength values. As previously reported after a study of the effects of HCl on
ceramic materials, the lack of a correlation between cold crushing strength and ion leach behavior may be due to the lack of silicon ion removal from any of the specimens, indicating that the silicate-rich bond phase of the red shale and fireclay brick was not weakened and thus the cold crushing strengths would not be expected to change significantly.
It was observed that the colors of the acidproof brick samples were affected by exposure to the various HNO3 environments. The red shale bricks changed in appearance from a red to a pink color and the fireclay brick from a buff to a light cream color when exposed to the most severe corrosion condition of 40 wt pct HNO3 at 90° C. The color changes were caused primarily by the removal of iron from the samples, the major ion leached from these brick. Microscopic investigation indicated that hematite particles were removed from the microstructure of the leached samples. Excluding hematite removal, scanning electron microscopy, electron probe examination, and X-ray crystallographic examination of the acidproof brick indicated no phase changes.
Acid-Resistant Brick
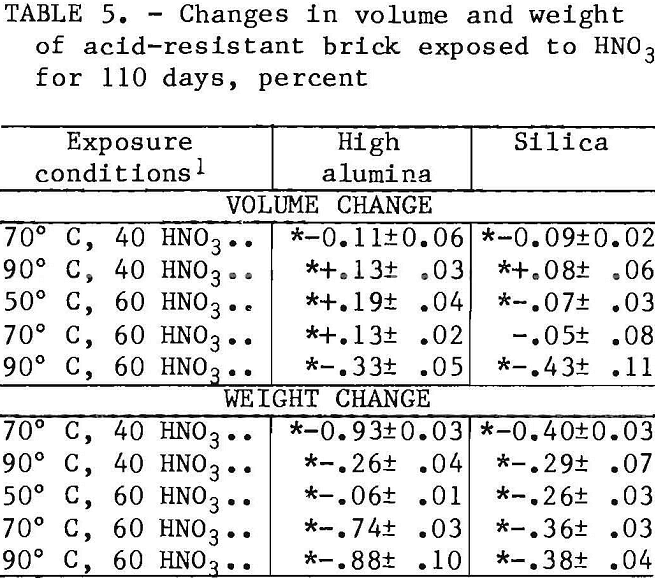
When HNO3 leach testing of the four acid-resistant brick listed in table 1 was initiated, NOx fumes developed in the test vessels with carbon and silicon carbide brick samples, and testing of these brick was discontinued. Test results discussed in this section therefore include only the high-alumina and silica brick. No trend was observed in the volume changes listed in table 5 with changes In temperature or acid concentration, and the reason for the variable results is not yet known.
Statistically significant weight losses occurred in the high-alumina and silica brick at all test conditions as shown in table 5. However, the weight losses in the silica brick are the lowest values observed (0.26 to 0.40 wt pct) for the various ceramic materials tested.
Note.—Plus-minus (±) values are at 95- pct confidence intervals.
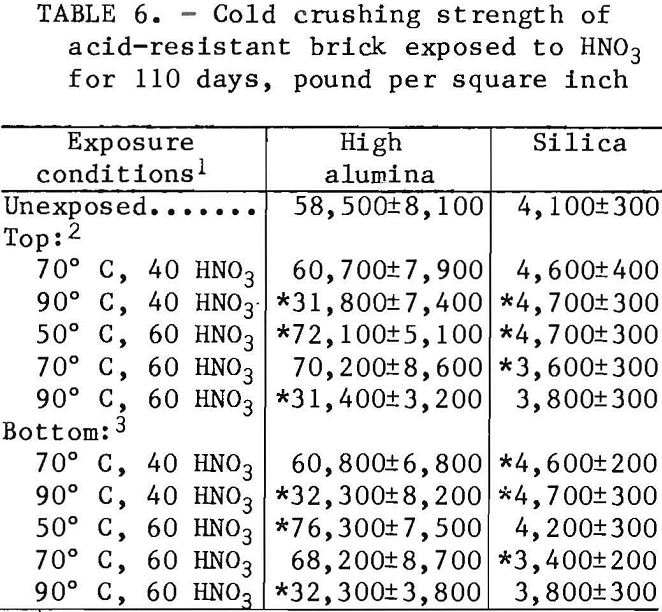
Cold crushing strength values for the acid-resistant brick are listed in table 6. Statistically significant strength decreases of about 27,000 psi for the high-alumina brick occurred when it was exposed to 40 and 60 wt pct HNO3 at 90° C. The reason for the strength increase when exposed to 60 wt pct HNO3 at 50° C is not known. The silica brick, in contrast, had small, inconsistent, statistically significant cold crushing strength changes. No significant differences were noted for strength values of the top and bottom halves of acid-resistant brick test samples.
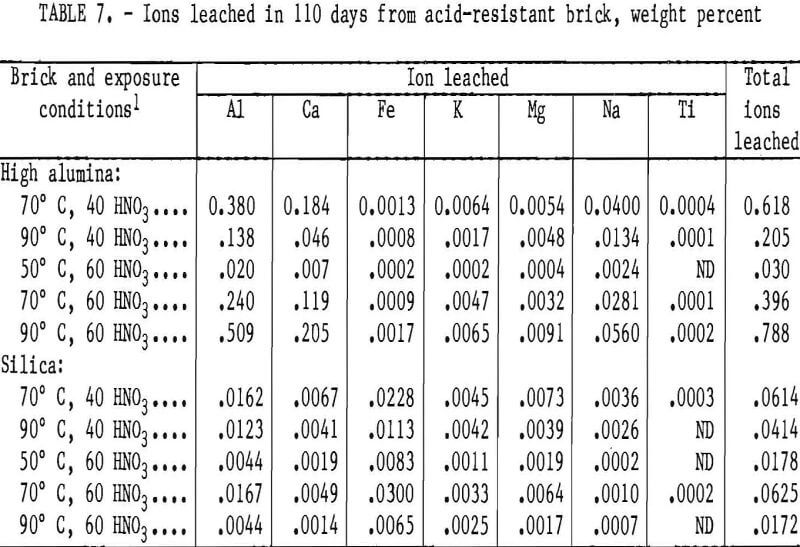
The weight percent of ions removed from the high-alumina and silica brick exposed to HNO3 for 110 days are listed in table 7. During the 110-day leach, the ion removal rate from the two acid-resistant brick tended to fit the second-order parabolic equation described in the “Acid- proof Brick” section, with 41 out of 66 curves yielding coefficients of correlation above 0.95. The largest quantity of a single ion was leached from the
Note.—Plus-minus (±) values are at 95- pct confidence intervals.
high-alumina brick in 60 wt pct HNO3 at 90° C. Ion leach data for the silica brick in table 7 show less than 0.03 wt pct of any single ion removed at any test condition.
The total ion leach data for the high-alumina and silica bricks after 110 days of exposure to 40 and 60 wt pct HNO3 are shown in figure 2. In 60 wt pct HNO3, the high-alumina brick showed an increase in total ions leached with increasing temperature. In 40 wt pct HNO3, however, the high-alumina brick had a decrease in the quantity of ions leached with a temperature increase from 70° to 90° C. The total ion leach data are in good agreement with sample weight losses reported in table 5.
As shown in figure 2, the silica brick had the lowest quantity of total ions leached from the sample of any acidproof or acid-resistant brick tested. Less than 0.07 wt pct of total ions was leached from the silica brick under the conditions studied, as shown in table 7.
Scanning electron micrograph and electron probe examination of the
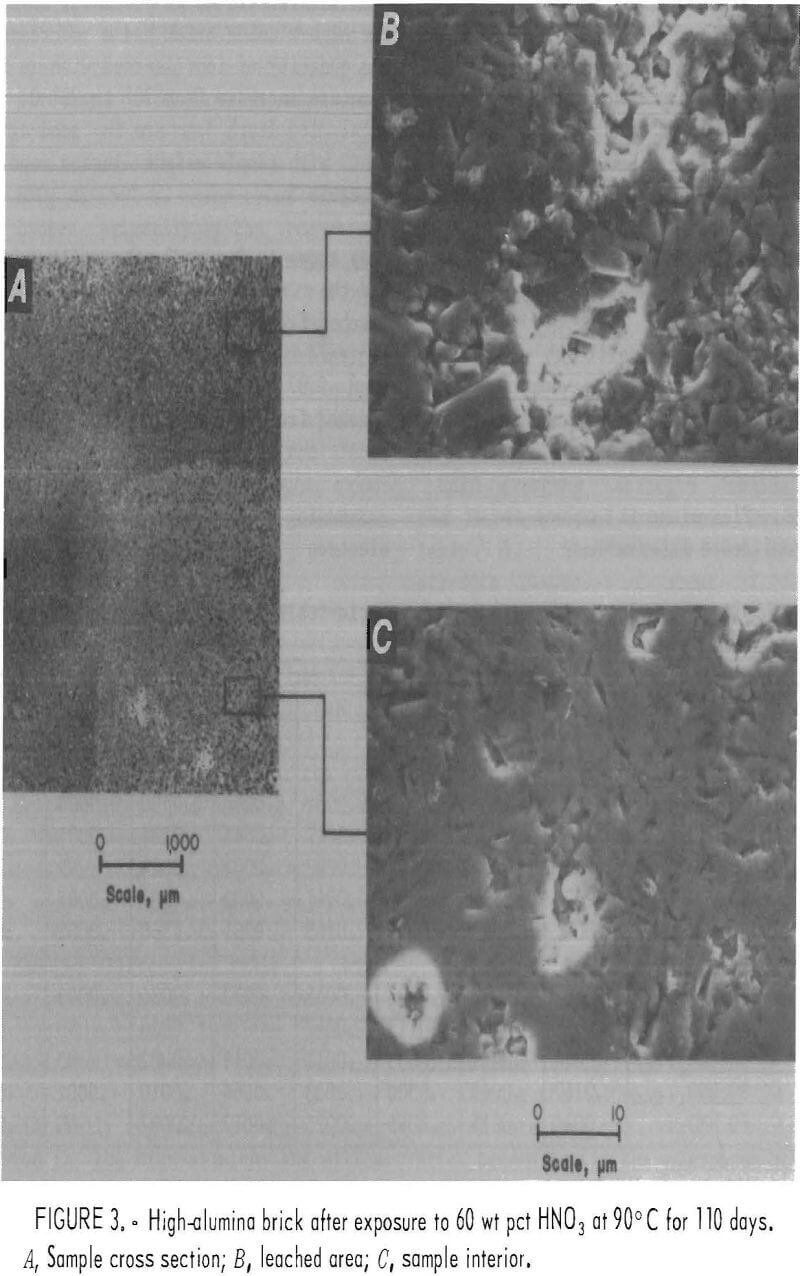
microstructure of the acid-resistant brick revealed no changes except in the high-alumina brick. Figure 3 shows microstructural changes that occurred after exposure to a 60-wt-pct-HNO3 solution for 110 days at 90° C. Micrograph A, a cross section of a corner of the high-alumina brick, shows a leached outer zone, about 3 mm thick. The leached exterior zone, shown in micrograph B, has a noticeable increase in small pores and grains in relief when compared with the sample interior, shown in micrograph C. Total ions leached from this sample amounted to 0.788 wt pct and consisted primarily of the three elements Al, Na, and Ca (table 7). Removal of the Al, Ca, and Na ions from bond phase areas in the microstructure probably accounts for the significant decreases in cold crushing strength noted in table 6.
Conclusions
A study of the effects of 40 wt pct HNO3 at 70° and 90° C and 60 wt pct HNO3 at 50°, 70°, and 90° C on two red shale, two fireclay, a carbon, a silica, a silicon carbide, and a high-alumina brick after 110 days of exposure indicated the following:
- Silica brick had the best acid-resistant properties, with a maximum total ion weight loss of 0.063 wt pct.
- Red shale B and fireclay A bricks had good acid-resistant properties, with a maximum total ion weight loss of 0.202 and 0.303 wt pct, respectively.
- Carbon and silicon carbide brick caused the development of NOx gas and are not recommended for use in conditions similar to those evaluated.
- Statistically significant changes In cold crushing strength were generally small or not detected, except for the high-alumina brick, which had nearly a 50-pct drop in strength after exposure to 40 and 60 wt pct HNO3 at 90° C.
- Silicon was not leached from any samples, indicating that the siliceous bond or silicate mineral phases were not affected. This may explain why cold crushing changes were small or not observed except for the high alumina brick, in which other materials in the bond phase were removed.
- In general, the Fe and Al Ions had the highest Ion removal rates, while Ca, Mg, Na, K, and Ti ion removal was minor.
- Increasing temperature generally increased ion leach rates and sample weight loss values.
- Ion leach rates and sample weight loss values were generally higher for the 40-wt-pct than for the 60-wt-pct-HNO3 solutions.
- The total ion weight loss of the acidproof brick was directly related to the initial apparent porosity.
