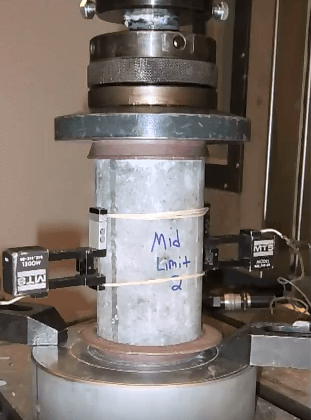
 In this topic, we’ll present you some of the laboratory tests that can be performed to infer rock materials strength. It is important for you to know what type of tests can be done and what types of information we can gather from them.The simplest test to perform is the unconfined compression tests that will yield the unconfined compressive strengths. In these tests, a rock specimen in cylindrical shape is placed between two platens and is compressed at a certain loading rate with the measurement of force and displacement. These forces and displacement are later converted to stress and strain using the relationships you’ve seen in topic one. The unconfined compression test is used to data mine the stress-strain relationship that we plotted in the previous topic to discuss the formability and strengths of material. You also know that for most laboratory testing, the condition of testing is actually governed by standards and recommendations. This is for consistency reasons and to ensure the quality of the results.
When it comes to unconfined compression tests, there are several criteria that have to be fulfilled. The first one pertains to the diameter of the specimen. it has to be at least 10 times the size of the biggest article in the specimen. This is to ensure that the specimen we are testing is representative and then slenderness of the specimen matters and the height should be 2 times the diameter, not shorter, not longer. The third criterion concerns the faces of the specimen because the specimen is compressed between platens, the faces have to be flat and parallel to certain tolerances. Set by the standard and finally, there are some conditions regarding the loading rate. 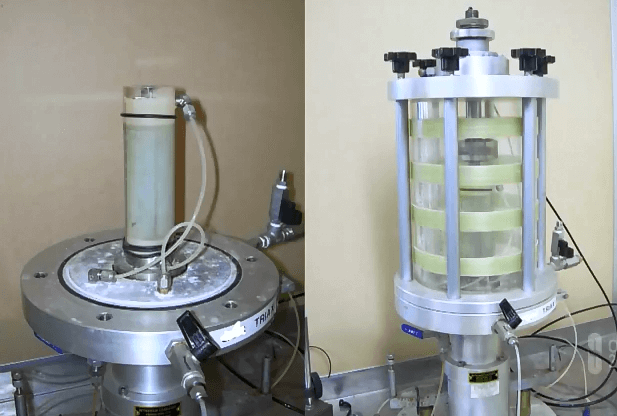 That is the speed at which we load the specimen. if we go too quick, we’re going to have dynamic effects and the results might be flawed. When it comes to the tensile teats, things are a bit more complicated because you can imagine grabbing on the rock specimen, pulling is not exactly easy.
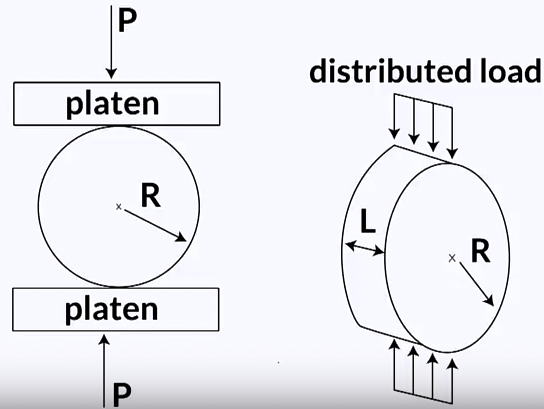 The grabs could slide, slip. And you could also crush a specimen as you try to grab it, but an indirect method has being developed. It’s called the Brazilian test or the indirect tensile test, and what happen – you can see on this picture – the cylindrical specimen lays flat on its curved surface, with the flat surfaces being vertical, and the specimen, again, is placed between two platens and as the load is applied the load is distributed along the line on the curved surface and that splits the specimen in two halves as the load is increased, as you can see on the video. You might wonder why this compressive action on the specimen might give this information about tensile strengths of the material.
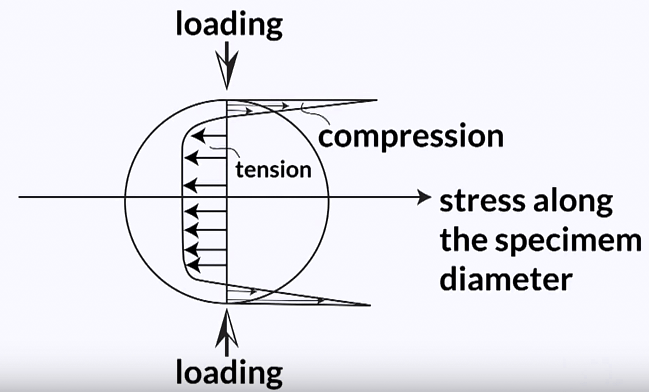
  This is, in fact, illustrated on this picture to come. What we can see is that loading the specimen in this way results in very localised compression across the diameter of the specimen but about 80% of the diameter is actually subjected to tension and the specimen does fail into tension, hence providing information about tensile strength. If you’d like to know how we can compute the tensile strengths from the load actually applied on the specimen, I invite you to consult the documents provided in the additional resources. Again, the testing conditions for the Brazilian test are governed by standards.
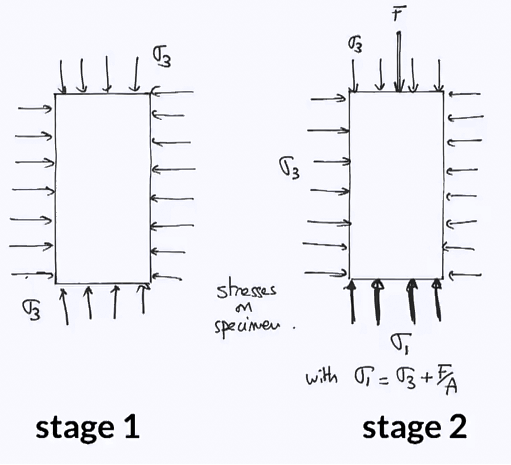
We have a condition on the diameter that has to be more than 10 times the size of the biggest particle in the rock with typical diameters of about 50 meters. The lengths of the specimen has to be half the diameter and there are conditions on the loading rate as well to avoid dynamic effects. Finally, the shear strands of rock specimens can be inferred from triaxle tests also called triaxle axle compression tests. 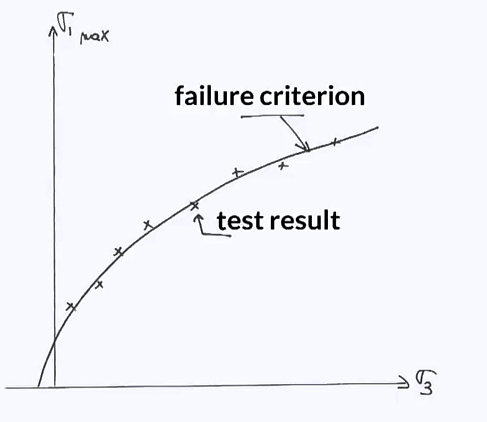 The principle of these tests is you have a cylindrical specimen, subjected to radial confinement and after this confinement has been established, we start loading vertically the specimen until failure. Again, the conditions of these tests are governed by standards or recommendations. On the left of this photo, you can see the bays of your triaxle cell which includes a pedestal on which the specimen sits. The specimen also has a loading cap on top of it. On the right of the photo, you can see that a bell has been placed on top of the bays of the triaxle cell. That is used so that we can fill the bell with water. The water will be pressurised and that pressure of water will provide the confinement to the specimen we were talking about earlier in this topic. You can notice on the left of the photo that the specimen is placed in a rubber membrane. That is to prevent water from getting into the specimen. the black lines are actually o-rings, that is, little rubber bands holding the membrane tight around the loading cap and the pedestal so that water doesn’t get in. through the top of the bell passes a piston. The piston rests on the loading head that is on top of the specimen, and the piston is used to exert a vertical load onto the specimen after the confinement has been applied. In fact, the triaxle test is typically conducted in two stages that I will explain now. So in stage one, the water in the bell is pressurised and the pressure applies a confinement to the specimen on all outer faces of the specimen. You can see on the left side of the figure, confinement is applied gradually but also on top and bottom because the pressure is applied on top of the loading head that transfers to the top of the specimen and the same thing happens at the bottom.
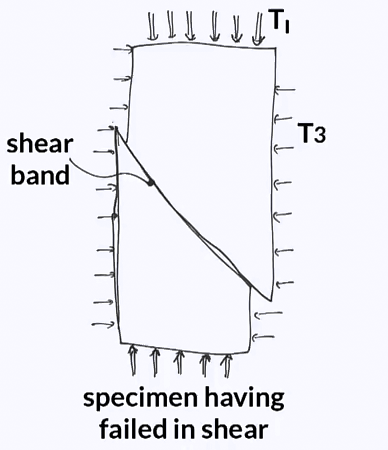
In the later stage, stage 2, the vertical load, F, is applied through the piston, and that creates an extra stress onto the specimen. You can see the resulting stress sigma 1 plotted at the bottom of the specimen on the right hand side of the figure. Sigma 1 equals the initial stress, sigma 3 plus the force divided by the cross sectional area. So during this stage, F is increased gradually until failure is reached. During this time, this confinement sigma 3 is kept constant. The typical failure pattern in triaxle tests is characterised by an inclined bend as you can see on this picture. This is called a shear band and we typically observe the top part of the specimen sliding on the bottom part of the specimen. After on test has been performed, we repeat the experiments at different values of confining pressure. Each time with a new specimen and that will help us to get different values of shear strand. Remember we said in a previous topic, shear strands is not unique, but different tests would be performed at different confining pressures. When all these tests have been performed, we can plot the data as per the figure you’re seeing now and that gives us a failure criterion where we have all the shear strands plotted against all the confining pressures. The general trend is a non-linear of shear strands as we increase the confining pressure. Each time with a new specimen and that will help us to get a different values of shear strands. Remember we said in a previous topic, shear strands is not unique, but different tests would be performed at different confining pressures.
When all these tests have been performed, we can plot the data as per the figure you’re seeing now and that gives us a failure criterion where we have all the shear strands plotted against all the confining pressures. The general trend is a non-linear increased of shear strands as we increase the confining pressure. The standards for testing of rock materials have been produced either by the International Society for Rock Mechanics called ISRM or the American Society for Testing and Material, ASTM.
https://youtu.be/MhcvDfXyGtw
