Table of Contents
For many years the green and dry compressive strengths of pellets have been considered as possible criteria of pellet performance during induration. Although widely quoted throughout the industry, little attention has been given to standardizing the unfired pellet compressive strength test or to determining the characteristics of the test.
Materials and Equipment
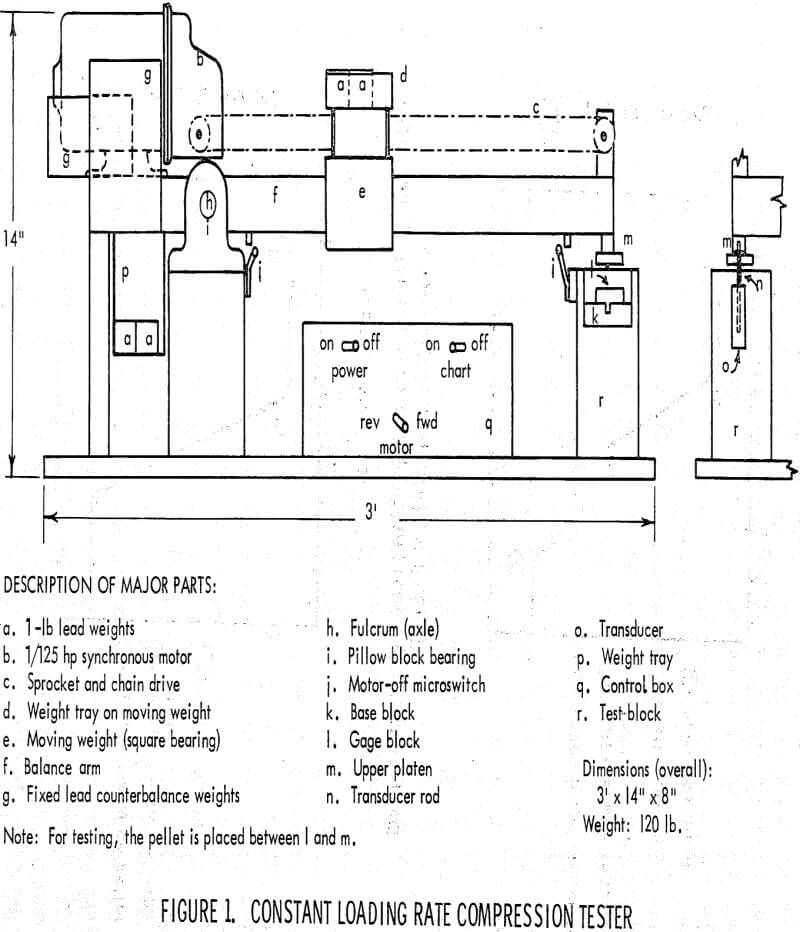
Most testing machines employ a constant deformation rate in the compression test. For pellets with a nonlinear load-deformation relationship, the loading rate during the test is not uniform, a factor that introduces inaccuracies in the strength measurement. To overcome this difficulty and to provide a testing device with accuracy and sensitivity superior to that found in other testers, the constant loading rate tester (CLRT) was developed.
The resulting pellet deformation is measured by a differential transformer (transducer), which is connected to a recorder. By calibrating the recorder chart speed with the tester motor speed and by calibrating the recorder stylus deflection with the transducer deflection, the actual deformation of the pellet may be observed as a function of the load upon it. The point at which the pellet fractures may be clearly observed. Sensitivity of the recording system is high and the load-deformation curve is very smooth, a fact that indicates there is little vibration in the tester.
The constant deformation rate tester (CDRT) was of the, type used by Stevenson and Bergstrom. Here the pellet is placed on a lower platen, which is driven upward by a screw gear against the upper platen that is a anchored through a proving ring. After the pellet breaks, the fracture load may be found from the proving ring dial gage reading and a suitable conversion chart.
Green Pellet Testing
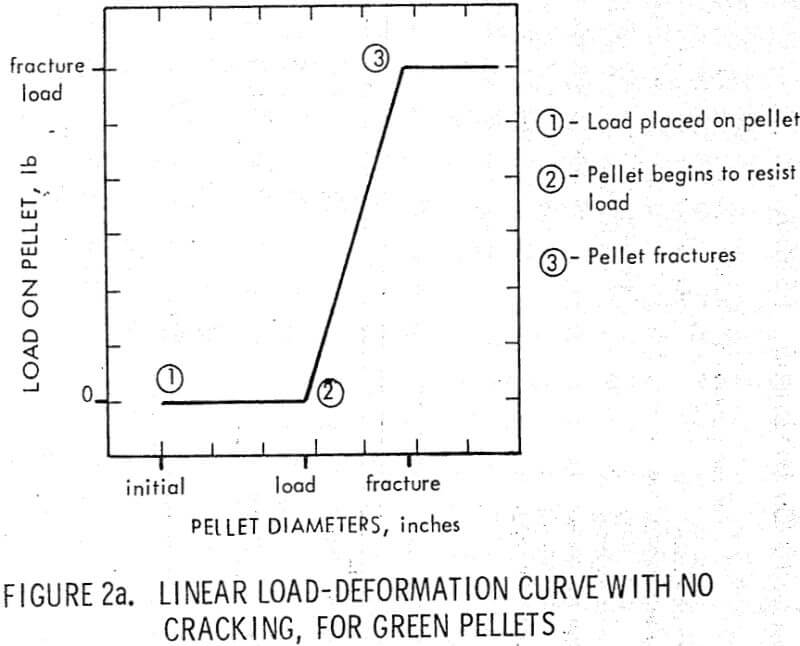
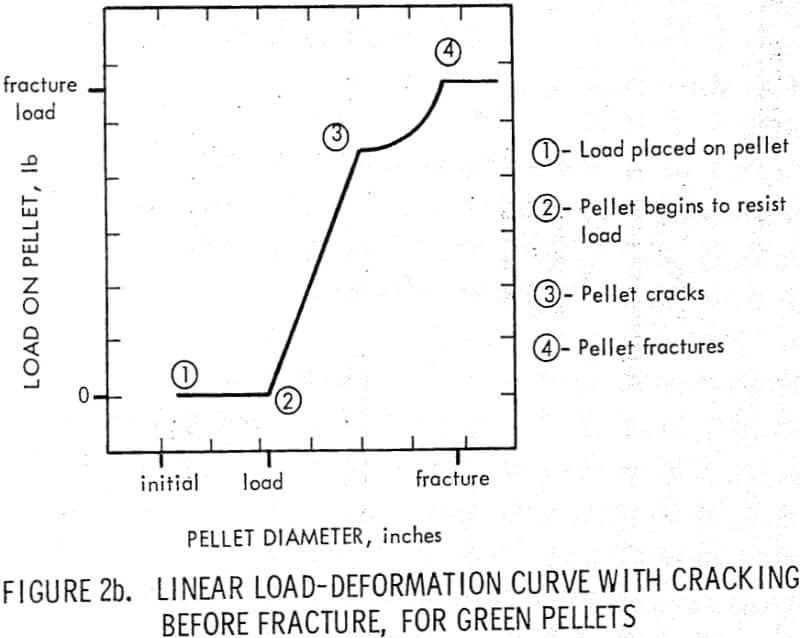
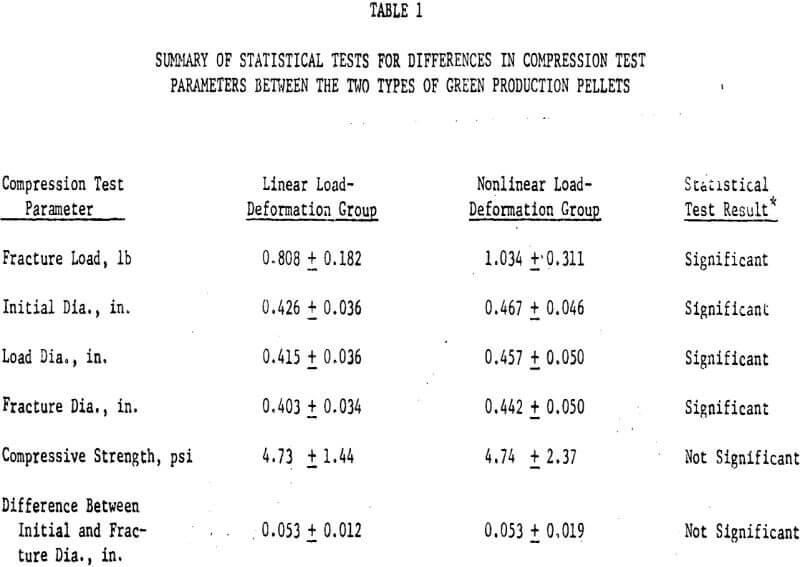
From the load-deformation plots for 50 production pellets tested at 2 lb/min, it became apparent that these pellets were of two types. A linear load-deformation.relationship characterizes one type, and an upward curve in this relationship characterizes the other. Analysis of the data for these groups shows a significant difference at the 95% confidence level for most of the measured test parameters.
There are three pellet diameters of interest:
Initial diameter — the nominal or unloaded pellet diameter,
Load diameter— the diameter of the pellet when it first begins to resist the compressive load placed on it, and
Fracture diameter— the pellet diameter just before fracture.
The fracture loads and all three of the diameters for the two types of production pellets are significantly different, but the compressive strengths (fracture load divided by the load diameter squared) and the total deformations (initial diameters minus fracture diameters) are not. The initial pellet deformation, which occurs under essentially zero load, is caused by the flattening of surface, irregularities. On the average, this initial deformation accounts for about half of the total deformation.
Dry Pellet Testing
Examination of the many load-deformation curves recorded during the constant loading rate tests on dry pellets showed a linear relationship between the force applied to the pellet and its resulting deformation. It was not surprising, then, to observe a similar result for tests on dry pellets performed at a constant rate of deformation: if the pellet is deformed at a constant rate, the force with which the pellet reacts will be directly proportional to the deformation and will therefore increase at a constant rate.
Test results for the larger and smaller pellets selected on the weight and size bases are listed for the two testing machines. There are no significant differences between the average fracture loads of each batch pair, as measured on the two machines, even though the average weights and sizes as well as the ranges are quite similar for each pair. The fracture load variation (twice the standard deviation divided by the mean) is not consistently lower for one tester or the other. At a deformation rate of 2 inches/minute, the testing time on the CDRT was about one-fourth that of the CLRT operated at a loading rate of 3.67 lb/min.
Effect of Test Variables
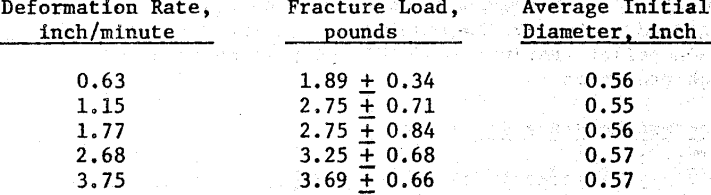
o study the relationship between fracture load and deformation rate, five batches of 10 green laboratory pellets were rounded by hand to reduce surface irregularities and tested at different deformation rates. The increase in fracture load with an increase in deformation rate is shown below.
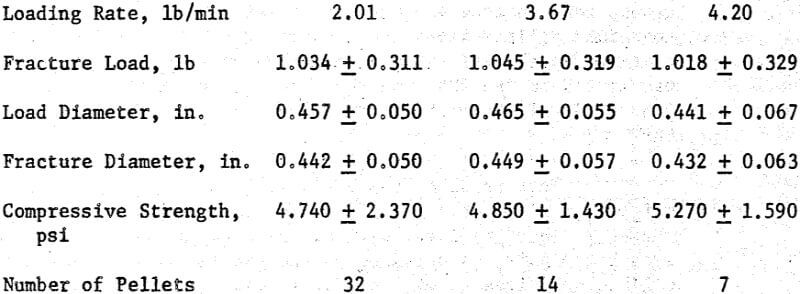
Green production pellets were tested at three constant loading rates. Data for the type with the nonlinear load-deformation relationship are shown below. There are no statistically significant differences between any of the fracture load distributions. The load diameters, fracture diameters, and compressive strengths for the 2.01 lb/min and 3.67 lb/min rates are not significantly different at the 95% level, but these parameters are significantly different for the 3.67 lb/min and 4.20 lb/min rates.
Some of the increase in fracture load is caused by the immediate failure of the weaker pellets. When these pellets are excluded from the calculation of the average load, the average load is of course higher.