Table of Contents
Although past investigations have been conducted to determine crushing relationships, no program which covered a broad range of crushing conditions had been conducted. The previous studies appear to concentrate on small segments of the overall picture and did not fullfill our desired information objectives. Due to the broad range of variables utilized in a production size crusher, is believed to be the most comprehensive study of its kind as of this date.
The principles developed by the Symons brothers in 1925, when they patented the cone crusher as we know it today, are still being used in the machine known as the Symons Cone Crusher. During the development of this novel crushing concept, a technique known as the fall of material (called the Bouncing Ball Theory by some) was used to determine an idea as to the proper head angle, eccentric and speed of eccentric rotation. The final variables used for the Symons Cone Crusher design were, therefore, the logical conditions to start with and use as a reference against which other variables could be compared.
Other tests, conducted in the field and at the MRTC, have confirmed that the eccentric speed should not be reduced below the speed normally used. Similar tests have indicated that the eccentric throw should not be increased significantly above that normally used. It was logical, therefore, that the speed and eccentric should be given significant increases and decreases, respectively during a testing program. The head angles selected were based upon the range of cone crusher head angles being used. It is believed that the majority of the crushing variables used by the various cone crusher manufacturers are covered by the variable ranges selected.
The program utilized a three foot Symons Short Head Crusher operating in open circuit and equipped with a coarse cavity. The following variables were selected at the initiation of the program:
- Head Angles (from horizontal)
a. 40°
b. 50°
c. 60° - Eccentric Throw
a. Normal
b. 25.0% Decrease
c. 50.0% Decrease - Eccentric Speed
a. Normal
b. 12.7% Increase
c. 25.0% Increase - Closed Side Setting
a. ¼ inch (6.35mm)
b. 3/8 inch. (9.53mm)
c. ½ inch (12.7mm)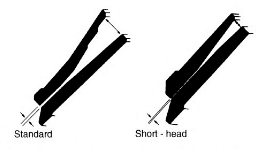
d. ¾ inch (19.05mm)
e. 1 inch (25.4mm)
Five hundred tons of 3″ (76.2mm) x 1 ¼” (31.7mm) limestone was purchased from a limestone quarry near Milwaukee for use as the test material. All the material was obtained on the same day from the same part of the quarry to minimize fluctuations in material characteristics during the test program. Due to the large number of tests (135), no repetitive testing was thought to be necessary.
Circuit and Test Procedures
All tests were conducted in open circuit to eliminate the other operational variables inherent to a closed circuit operation (i.e. screening efficiency).
The crusher operator had two operating limitations which were adhered to during the crushing tests:
- Maximum horsepower draw (100 HP)
- Full crusher cavity
The material was fed to the crusher at a rate which would either utilize the total horsepower available or fill the crusher cavity. Normally, the horsepower was the limiting factor with the ¼ (6.35mm) and 3/8 inch (9.53mm) settings while the cavity capacity was the limiting factor at closed side settings above the 3/8 inch (9.53mm) value.
After either of the two criteria were obtained, the crusher was run until steady operating conditions were achieved. The crushing circuit was then stopped and a belt sample taken. After being weighted, this sample was split to a size convenient for screen size analysis.
A kilowatt meter strip chart was obtained for each test. The maximum and average operating power values were determined from the charts.
Closed side settings were determined by passing a lead slug approximately 2 inches (50.8mm) thick through, the crusher prior to starting the test. This slug was then measured and the value recorded as the crusher setting for that test.
After all the necessary data was obtained, the next variable change was made and the procedure repeated.
Data Evaluation
Combined Variables – Multiple regression analysis techniques were employed to develop equations which were subsequently used to analyze the effects of the variables.
The data from all 135 tests were simultaneously supplied to a “canned” statistical package known as S.P.S.S. for the equation development. The S.P.S.S. package used was supplied by the Control Data Corporation (CDC) program library. Using a stepwise regression procedure resulted in an indication of each variable’s importance in relation to the dependent variable, horsepower. Stepwise regression results in each independent variable being entered according to the respective contribution of each to the explained variance (the variability of the dependent variable explained by the regression line)
The R² value indicates how well the regression equation fits the sample data. The R² value is obtained by dividing the regression sum of squares by the value for the regression sum of squares plus the residual sum of squares. The regression sum of squares being the amount of variation in the independent variables associated with the regression on the dependent variable. The residual sum of squares is the variation of the independent variables not associated with the regression of the dependent variable. This variation is due to the variation in sample data.
The R² values which are an indication of each variable’s contribution to the relationship are as follows:
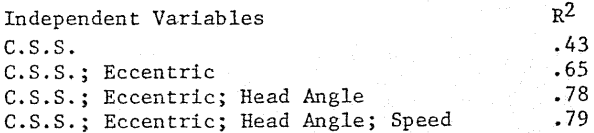
where:
– C.S.S. = Closed side setting (inches)
– Eccentric = Eccentric throw (% of normal)
– Head Angle = Head Angle in degrees from horizontal
– Speed = Linear Speed in ft./min. of the closed side setting at outermost point of liner
– Horsepower = Dependent Variable being predicted
The closed side setting therefore accounts for an explained variance of 43%; the eccentric 22%; the head angle 13%; and speed 1%. The R² value of .79 indicates that an unexplained variance between the equations developed and the data of 21% exists.
A similar approach was attempted to evaluate the crushing efficiency (HP/TON) using the selected variables. The R² values for an equation that predicts horsepower/ton are:
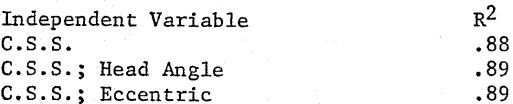
Obviously the variable which most directly effects the horsepower per ton of crusher product is the C.S.S. The other variable contribute a small portion of the overall explained effects.
Improved Correlation by Data Segregation
The regression analysis was redone for each head angle in an attempt to increase the R² value. The second data analysis generated equations for —
- Horsepower
- Capacity
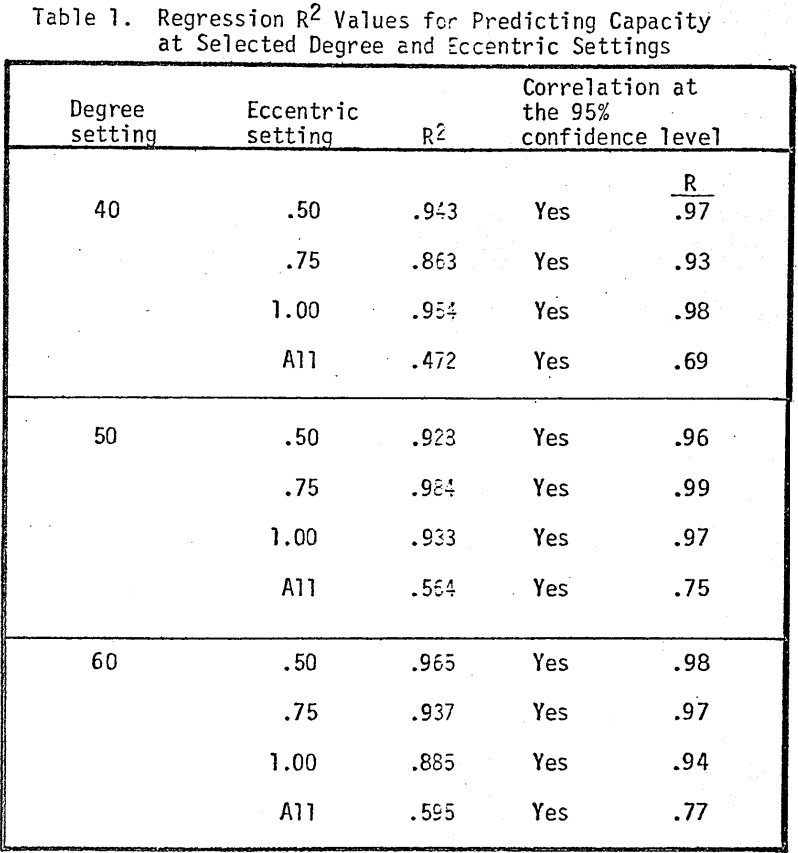
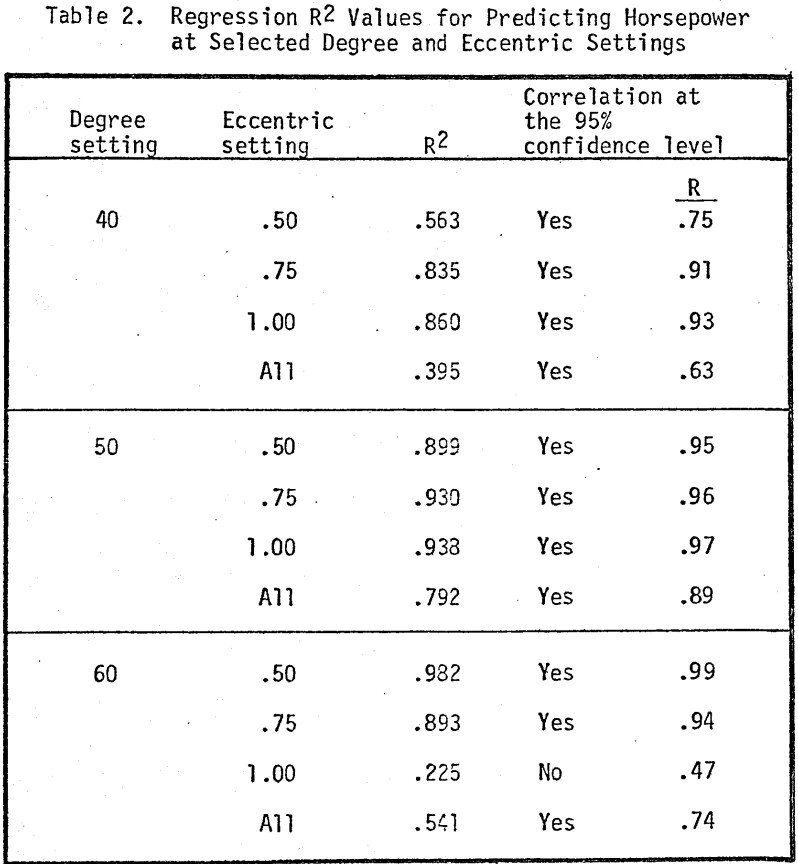
Each of the above were represented by an equation containing the C.S.S. for each eccentric value at the head angle selected. Tables 1-2 show the R² values for capacity and horsepower. In nearly all cases the R² values for each eccentric value are excellent. Obviously the change in eccentric has a large effect for each head angle as evidenced by the excellent R² values developed for the individual eccentrics and the relatively poor R² obtained by combining all data for each head angle and developing an equation. This relationship holds true for both the capacity and horsepower predictions.
In tables 1-2 the column labeled “Correlation at the 95% confidence level” indicates whether a null hypothesis (H0: the values obtained were from a population for which no correlation existed) can be rejected. If a yes is indicated, you can be 95% confident (statistically) that the information used came from a population of data for which a correlation exists. In all but one case, we were able to reject the null hypothesis. Only the correlations obtained from the equations developed using log transformations are presented as the log transformation resulted in the best R² values.
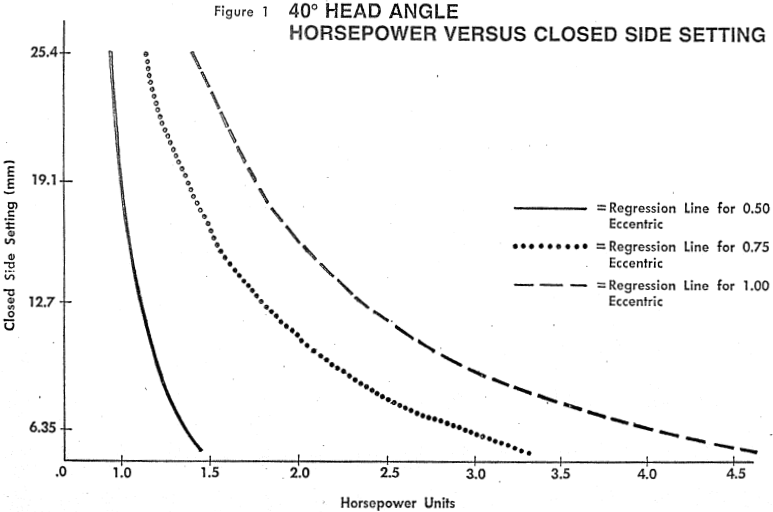
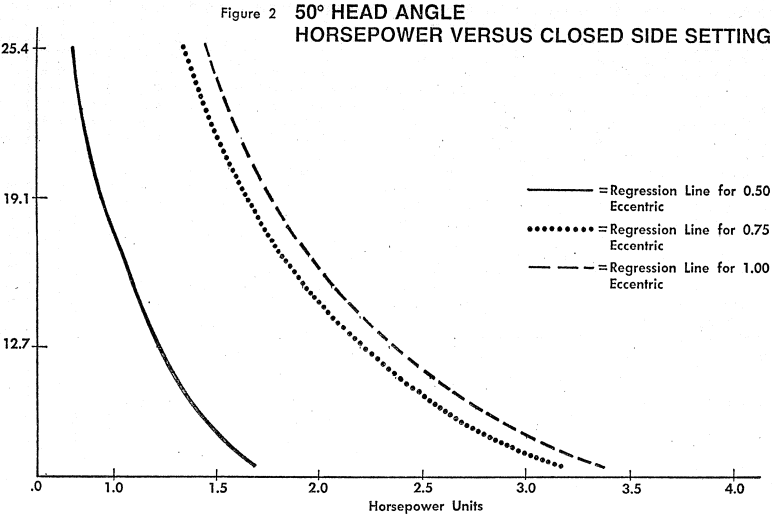
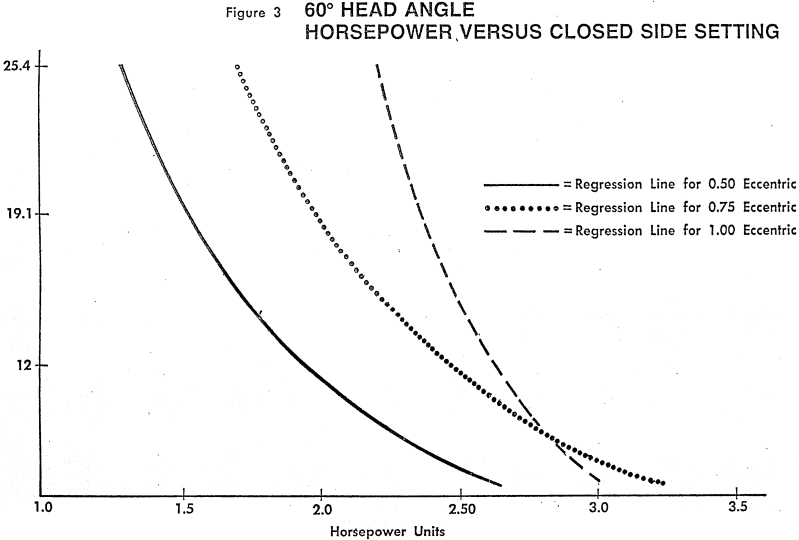
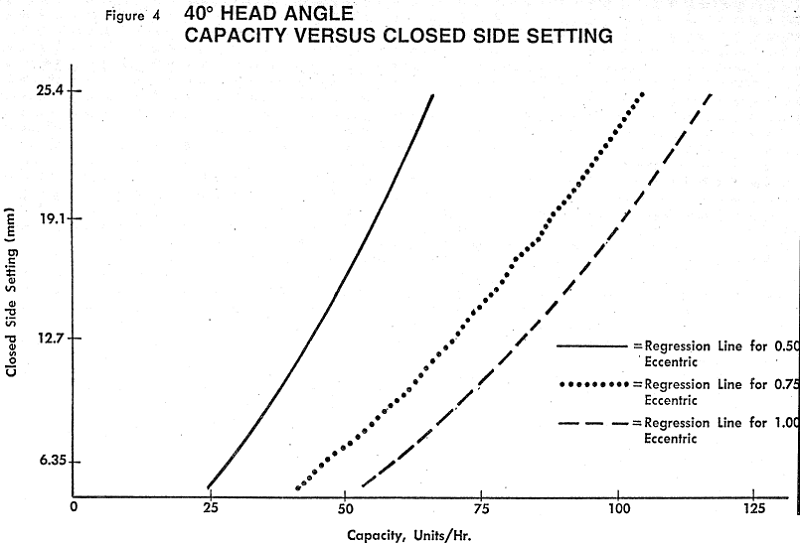
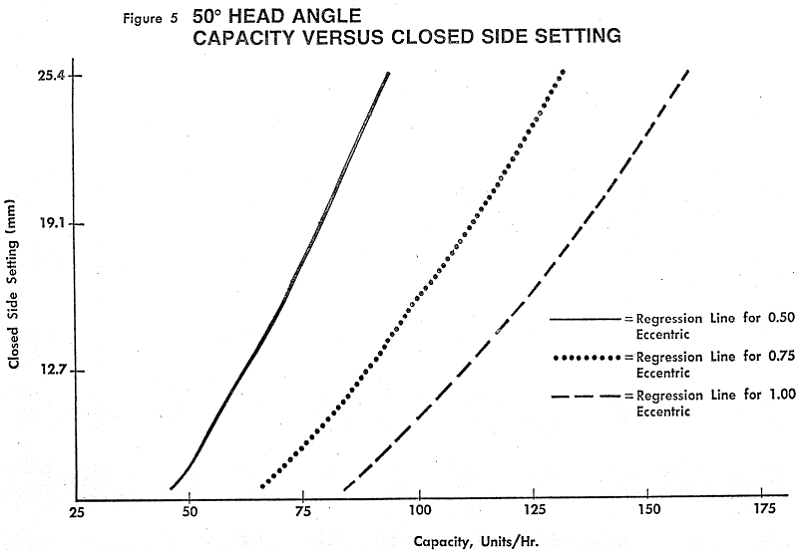
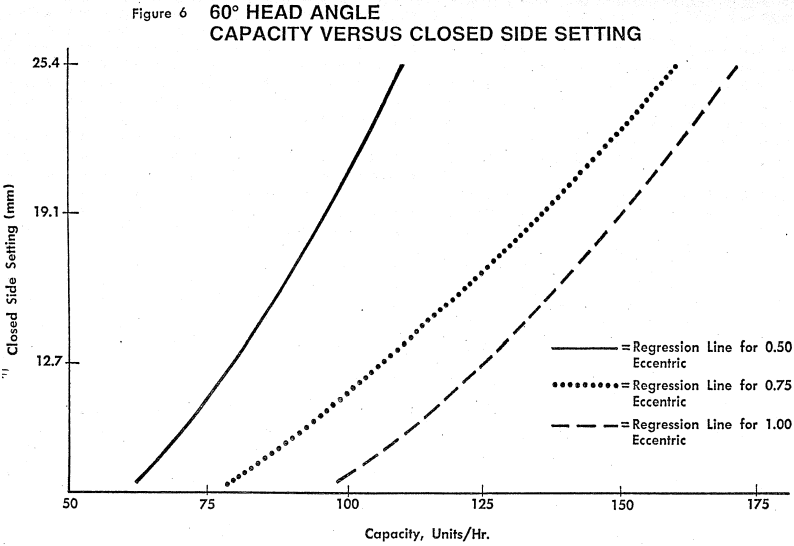
Scattergrams for each head angle and eccentric were generated from the equations developed to indicate the predicted horsepower and capacity versus closed side setting. These scattergrams are presented in Figures 1 through 6. Figures 1 through 3 indicate the effect of head angle and eccentric for horsepower consumption versus closed side setting. Figures 4 through 6 show the effects of the same variables on crusher capacity.
Regardless of head angle, eccentric throw, or speed, the closed side setting had the greatest effect on capacity and horsepower. As the closed side setting decreases the capacity decreases and the horsepower increases both changing based upon separate mathematical relationships. It would be logical to assume, therefore, for any given crusher, that an increase in closed side setting will increase capacity (up to the point where the cavity will not accept additional material) and decrease horsepower. There are practical limitations however. We cannot arbitrarily increase the closed side setting (C.S.S.) if we wish to maintain a maximum product top size. At the other extreme there is a physical limitation on how small the setting can be before the mechanical integrity of the crusher in question is violated.
Obviously, we must therefore look at the next variable which contributes to the process. The eccentricity, once again regardless of head angle or speed, has a very significant impact on a crusher’s capacity. As the eccentricity of the movable crushing member increases, the capacity rapidly increases. (See Figures 4-6) The eccentricity also controls, for any head angle, the horsepower consumption (do not forget the influence of C.S.S.) as shown in Figures 1-3. The horsepower draw will also increase significantly as the eccentricity increases.
It is apparent at this point that for a given closed side setting and head angle that the larger eccentric throws will produce the largest capacities and horsepower consumptions. While it is valid to assume that the amount of work done is related to the horsepower consumption, this assumption is only good up to the point where the added horsepower no longer is doing useful work, but rather is being absorbed in the crushing and supporting structures. Several examples of this “wasted” horsepower are adjustment ring movement or as seen in a different design the head moving away from the fixed crushing member. It is important therefore, to add horsepower only as long as the work is being done on the material and up to the point where the structural integrity of the machine is not being violated.
The next variable of importance (as per the stepwise regression) is the head angle. It is apparant that as the head angle increases, for a given setting and eccentric, that capacity and horsepower also increase. It has been previously established that a large eccentric is important. A large eccentric coupled with the 60° head angle resulted in a horsepower level far above the maximum acceptable limit at the smaller C.S.S.
An inspection of Figure 3 shows the detrimental effect of the 60° head angle – large eccentric on horsepower consumption. In this instance the horsepower draw was high and erratic at the smaller settings. This situation caused a reduction of feed to the cavity to bring the horsepower within acceptable limits. Obviously the head angle must be something less than 60° if we are going to be able to fully utilize the whole crushing cavity at the rated machine horsepower. At the present time there is not enough information available to select the optimum head angle. Another test program concentrating on a broader range of head angles at a large eccentric is needed.
As we have seen, speed increase has been the least contributor to the explained variance. No effect was seen in regard to horsepower consumption. There is some indication that an increase in speed will reduce the crusher capacity (regardless of eccentric or head angle).
While it is beyond the scope of this paper, it is important to note that a speed increase did result in some reduction in the topsize of the crusher product.
General Observations and Trends
- The rotational speed (linear feet of travel of the closed side setting) did not signficantly influence the horsepower consumption. Increased speed caused a slight reduction in capacity.
- The horsepower consumption and crusher capacity are related to the closed side setting by a log/log relationship.
- The closed side setting has the greatest effect on capacity and horsepower.
- The closed side setting and eccentric throw both, have a larger effect on capacity and horsepower than head angle. Regardless of head angle, a large eccentric throw permits greater and more effective horsepower consumption than a reduced eccentric. A large eccentric permits greater crusher capacity than a reduced throw eccentric.
- The steeper the head angle became the more power sensitive the crushing became, i.e. – erratic power draw was more prevalent for a 60° head than a 50° or 40° head.