The Bureau of Mines investigated the flotation responses of two copper nickel ore samples from the Duluth Complex with the objective of recovering bulk sulfide concentrates. One of the ores studied was taken from a test pit; the other was taken from a test shaft. The samples were quite similar except that the pit sample analyzed 0.35 pct Cu and 0.11 pct Ni and the shaft sample analyzed 0.69 pct Cu and 0.14 pct Ni. Flotation responses were studied in both laboratory and pilot plant tests.
Pilot plant flotation responses were similar for both samples resulting in grades of 12.2 pct Cu and 2.5 pct Ni for the pit sample and 12.2 pct Cu and 2.1 pct Ni for the shaft sample. Weight recoveries were 2.5 pct for the pit sample and 5.2 pct for the shaft sample. Copper and nickel recoveries for the pit sample were 87 and 62 pct, respectively, and 92 and 73 pct for the shaft sample. Both concentrates contained small but significant values of cobalt and precious metals. Cobalt recoveries were low—less than 40 pct for both concentrates. Precious metals contents of the concentrates were 1.59 oz/ton for the pit sample and 0.99 oz/ton for the shaft sample. Silver was the predominant precious metal by weight, but platinum and palladium represented the highest values.
The sulfide deposits of northeastern Minnesota, representing one of the major copper and nickel resources in the United States, occur along the northwestern contact of a large mafic igneous intrusive called the Duluth Complex. The Minnesota Geological Survey has estimated these copper- nickel resources at 2.2 billion tons of mineralized rock at a cutoff grade of 0.5 pct Cu plus nickel, representing 13.8 million tons of copper and 4.6 million tons of nickel. The principal sulfide minerals of value are chalcopyrite, cubanite, and pentlandite, which occur along with pyrrhotite and troilite as disseminated deposits in the troctolitic host rock.
The Bureau of Mines first tested samples of Duluth Complex ores from the vicinity of the South Kawishiwi River in 1955 and later investigated selective sulfatization as a method of extracting the metal values from these ores. This work—and the work described in this report—was carried out under the Bureau’s research program, a part of which is to develop methods for recovering metals from domestic resources to help assure the U.S. economy an adequate supply of mineral raw materials.
Commercial interest in the deposits of the Duluth Complex was growing when, in 1974, the Bureau’s Twin Cities Research Center (TCRC) obtained a 150-ton bulk ore sample (the pit sample) from a test pit opened by INCO Ltd. near the South Kawishiwi River just south of Ely, Minn. Although a 10,000- ton sample removed by INCO averaged 0.45 pct Cu and 0.14 pct Ni, the material received at TCRC contained only 0.35 pct Cu and 0.11 pct Ni.
The Bureau obtained an additional ore sample (the shaft sample) in 1977 from a test shaft sunk by Amax into an underground prospect near Babbitt, Minn. This 150-ton sample, which was representative of the ore found near the bottom of the shaft, averaged 0.69 pct Cu and 0.14 pct Ni. This grade was also typical of the ore located above the main deposit.
Several factors were considered in developing a processing flowsheet for these ore samples. Since the copper-nickel mineralization occurs as the sulfides chalcopyrite, cubanite, and pentlandite, along with varying quantities of iron sulfides, concentration of the metal values by flotation appeared to be the best alternative. Although several investigators have attempted to produce differential copper-nickel concentrates from these ores, their success has been rather limited, resulting in fairly good copper concentrates (20 pct Cu) but very low-grade (1 to 2 pct) nickel concentrates. Based on this information and the need for separate processing facilities that would be required for each concentrate if separate nickel and copper concentrates were produced, the authors decided to produce a bulk sulfide concentrate and separate the copper and nickel further along in the process flowsheet.
Flotation was conducted to recover bulk sulfide concentrates that included all the recoverable troilite and pyrrhotite. This was done to minimize the quantity of sulfides that would-in a working operation—eventually be placed in a tailings pond.
Concentrates produced during the pilot plant tests were recovered and stored for subsequent pyrometallurgical and hydrometallurgical research on the extraction and purification of copper, nickel, cobalt, and precious metals.
Although flotation results for the pit sample have been previously reported in detail, flotation responses for both the pit sample and the shaft sample are described in this report. This was done in order to make the data for both samples available in a single publication.
Raw Ore
The two ore samples used in this test work were both disseminated sulfide ores taken from the northwestern contact of the Duluth Complex in Minnesota. The two sample sites were separated by about 12 miles of national forest and mining company land. In both samples, the copper content was present primarily as chalcopyrite and cubanite. The primary nickel mineral in both samples was pentlandite. The copper-to-nicke1 ratio was 3:1 in the pit sample and 4-1/2:1 in the shaft sample.
Of the two samples, the shaft sample contained higher proportions of troilite and pyrrhotite. There were only very minor amounts of other sulfide minerals in either of the samples.
Both samples also contained small but significant amounts of precious metals.
Pit Ore Sample
The first ore sample was obtained from a test pit about 4 miles east of Minnesota State Highway 1 near the South Kawishiwi River. The host rock was an altered troctolite consisting of major amounts of plagioclase, pyroxene, and olivine, plus lesser quantities of serpentine, biotite, talc, amphibole, and chlorite. The principal sulfide minerals were troilite, pyrrhotite, chalcopyrite, cubanite , and pentlandite. The sulfide minerals were uniformly disseminated throughout the host rock, with very few occurrences of coarse-grained sulfides.
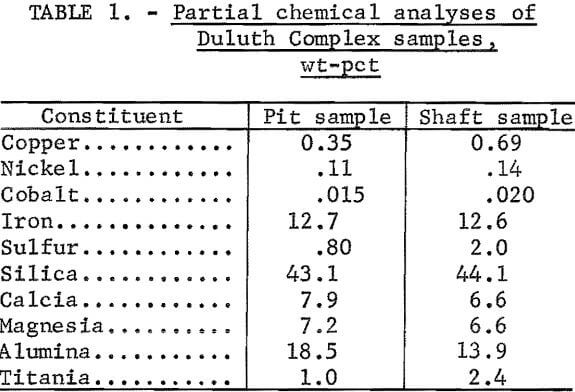
Mineralogical examination of polished sections of the pit sample indicated that 60 pct of the copper occurred as chalcopyrite and 40 pct occurred as cubanite. The nickel occurred predominately as pentlandite; almost none was present in the pyrrhotite and troilite. About 0.06 to 0.08 pct Ni was present in the olivine (a gangue mineral). No distinct cobalt minerals were detected by petrographic analyses, but analyses of the ore minerals by X-ray microprobe indicated that the pentlandite contained 1 pct Co and that the chalcopyrite and troilite contained about 0.05 pct Co. Partial chemical analyses of both the pit sample and the shaft sample are presented in table 1.
Shaft Ore Sample
The shaft sample was obtained from the lower portion of a test shaft near Babbitt, Minn. The site lies within one-half mile of existing taconite mines operated by Erie Mining Co. and Reserve Mining Co. The rock at this site was also a troctolite, but was somewhat richer in olivine and leaner in plagio-clase than the pit sample.
As in the pit sample, the primary sulfide minerals in the shaft sample were chalcopyrite, cubanite, pentlandite, pyrrhotite, and troilite. The relative proportions of the sulfide minerals were quite variable, but on the average, 65 pct of the copper occurred as chalcopyrite and 35 pct occurred as cubanite. Again, the nickel and cobalt were present as pentlandite. This sample contained significantly larger amounts of sulfides than the pit sample did, and its copper and nickel grades were both higher.
Laboratory Copper Nickel Ore Flotation
Pit Sample
Procedure
Testing of the pit sample indicated that a 90-pct minus 200-mesh grind would result in adequate liberation of the sulfide minerals. Grinding was carried out in a laboratory rod mill at 60 pct solids, and flotation was carried out in a standard laboratory flotation cell at about 30 pct solids. Various xanthate collectors were evaluated at addition levels of 0.05 and 0.10 lb/ton. Flotation was carried out for 5 min. at the natural pulp pH of 8.2 to 8.7. No distinct superiority of one xanthate over another was detected.
The collector that was subsequently used in the pit sample batch tests was sodium isobutyl xanthate. Light alcohol frothers were used at the rate of 0.05 lb/ton. The water used for flotation was Minneapolis city water.
Results
Primary separation products of the pit sample were a rougher flotation concentrate and a final tailing. The rougher concentrate was cleaned once, yielding a bulk copper-nickel concentrate and a middling product (table 2). The grade of the concentrates was somewhat variable, possibly because of the small quantity of primary concentrate that was refloated. Copper recovery ranged from 85 to 91 pct, and nickel recovery ranged from 60 to 71 pct; concentrate recoveries ranged from 2 to 4 wt-pct.

Microscopic examination of the products confirmed that most of the sulfide minerals in the sample were liberated. Laboratory copper and nickel extractions of 90.7 pct and 63.2 pct, respectively, were attained at grades of 12.4 pct Cu and 2.3 pct Ni. The gangue minerals in the pit sample concentrates were primarily plagioclase containing fine, unliberated sulfides, plus lesser amounts of naturally floatable talc and mica.
Shaft Sample
Batch Copper Nickel Flotation Tests
Testing of the shaft sample was conducted with sodium isopropyl xanthate collector throughout the laboratory test series. The change from isobutyl zanthate (which was used with the pit sample) to isopropyl zanthate was for convenience only and had little or no effect on the flotation results. Methyl isobutyl carbinol (MIBC) was the frother used in this test series. Again, Minneapolis city water was used.
A head sample taken during ore crushing was collected by cutting and compositing a series of samples throughout the crushing process. This material was blended and split into 1,000-gram samples for flotation test work. The first series of batch tests was carried out at grinds that ranged from 38 to 95 pct minus 325 mesh (table 3). In each test, a 1000-gram ore sample was ground in a laboratory rod mill for a specified time interval. The ground ore pulp was then conditioned for 2 min, using collector at the rate of 0.1 lb/ton, and floated for 10 min to yield a concentrate and tailings. Copper recovery improved as the ore grind became finer. At a 95-pct minus 325-mesh grind, only 2 pct of the copper was lost in the tailings, indicating a copper recovery of 98 pct.

Cyclic Copper Nickel Flotation Tests
To further clarify the flotation response of the shaft sample, several cyclic tests were carried out. A 6-min grind in the laboratory ball mill was selected for these tests, and the result was a 40-pct minus 325-mesh grind. The flotation procedure used was to condition 600 grams of ground ore pulp for 3 min, using collector at the rate of 0.1 lb/ton; add 1 drop of MIBC, condition for 1 min; and then float (5 min) to produce a rougher concentrate and tailings. The rougher concentrate was cleaned once to produce a final concentrate and a middling product. These middlings were weighed (while wet), sampled, reground to pass minus 325 mesh, and recycled to rougher flotation with the next 600-gram ore sample. This procedure was repeated until the middlings weight stabilized, which usually occurred within six or seven cycles.
When the middlings weight was stabilized, the circuit was assumed to be at steady state, and the recoveries were calculated on the basis of the grades and weights of the final concentrates and tailings. The results (table 4) are a fair representation of what can be expected from a continuous flotation circuit. Metal recoveries from the shaft sample, in duplicate cyclic tests, averaged 90 pct for copper and 66 pct for nickel, at a concentrate grade of 11.2 pct Cu, 1.9 pct Ni, and 23.6 pct S. Weight recovery was 5.8 pct. The tailings carried about 0.075 pct Cu and 0.06 pct Ni, which was a little higher than the desired level of 0.05 pct. Based on these results, it was decided to use a finer grind for the pilot plant circuit than was used in the cyclic tests. A grind near 65 pct minus 325 mesh was chosen for the pilot plant tests. Target values assumed for pilot plant flotation were 11 pet Cu and 2 pct Ni, at recovery levels of 90 and 65 pct, respectively.

Copper Nickel Pilot Plant Flotation
Pilot plant flotation tests for both the pit sample and the shaft sample were done in the Bureau’s TCRC flotation process demonstration plant. Both samples were tested using flotation circuits that consisted of a rougher float followed by three cleaner floats, plus a scavenger float on the rougher tails. Fagergren flotation cells were used throughout the flotation circuits for both samples. The procedure that was used for the pit sample flotation tests was subsequently modified for the shaft sample flotation tests. In all pilot plant tests , the flotation circuits were sampled hourly, and the hourly samples were composited into 8-hour shift samples. After sampling, the final bulk concentrates and a portion of the tailings were thickened, filtered, and stored for future metallurgical research. The water used in all tests was Minneapolis city water, resulting in a pulp pH of 8.5.
Pit Sample
Procedure
Prior to pilot plant testing, the pit sample was crushed to a nominal minus 1½-inch size and stored in 55-gal drums to prevent exposure to the elements and minimize sulfide oxidation.
Pilot plant flotation of the pit sample consisted of three 5-day tests. The pilot plant’s grinding circuit is equipped with a 2- by 4-foot rod mill and a 3- by 3-foot ball mill and has a nominal capacity of ½ ton/hr. The ball mill was operated in closed circuit with a cyclone and an inclined, rapped screen to deliver a nominal minus 200-mesh product (table 5).
The flotation circuit used for the pit sample is shown schematically in figure 1. The rougher was a three-cell, 9-cu-ft unit; the first cleaner was a two-cell, 3-cu-ft unit; and the second and third cleaners were both single- cell 1.5-cu-ft units. A four-cell, 7.5-cu-ft unit was used as a scavenger.

The feed to rougher flotation was maintained at about 30 pct solids. There was no solids control in the cleaner cells, but by minimizing water dilution of the froth products, the solids were maintained near the 10-pct level. Float time was 20 min for the rougher and scavenger floats, and 15 to
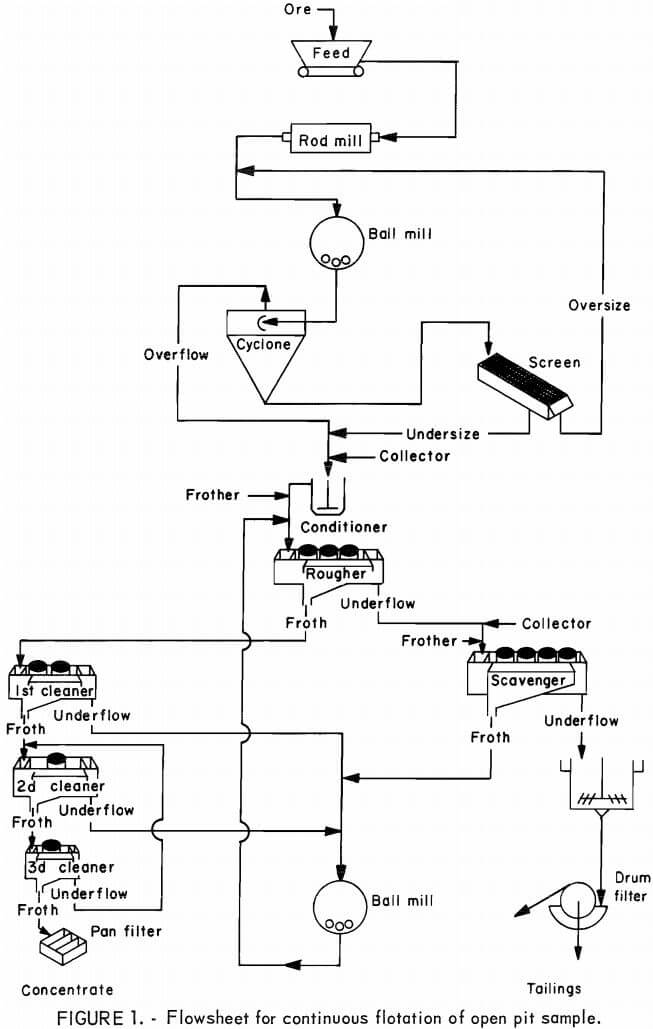
20 min for the cleaner floats. Flotation reagents used were sodium isobutyl xanthate collector (at the rate of 0.1 lb/ton) and Aerofroth 71R frother (0.05 lb/ton).
Half the collector (0.05 lb/ton) was added to the conditioner prior to rougher flotation, and half was added directly to the scavenger flotation feed box to assure maximum sulfide recovery. All the frother was added to the rougher float, except when a low froth level required the addition of more frother to the scavenger float. No additional reagents were added to any of the cleaner floats.
The flotation circuit was initially operated to produce a bulk concentrate containing from 10 to 12 pct Cu while maintaining copper recovery near the 90-pct level. Information obtained from the bench-scale tests had indicated this to be a reasonable goal. Actual operations during the three test periods produced concentrates with daily average copper analyses ranging from 7.5 to 18 pct Cu. Most of the low-grade concentrates (those containing less than 10 pct Cu) were produced in the first test during the startup period as a result of mechanical upsets in the flotation system.
Initial Results
Average shift results for the pit sample concentrates, graphed in figures 2 and 3, show that the continuous flotation responses were almost identical to the results obtained from laboratory batch flotation (table 2). The nickel content of the concentrates increased in direct proportion to the copper content (fig. 2) and ranged from 1.5 to 3.5 pct. The sulfur content ranged from about 15 pct in the low-copper concentrates to more than 25 pct in the high-copper concentrates. The iron content of the concentrates varied only from 24 to 29 pct over the full range of copper concentrations, partly because the gangue minerals contained an appreciable iron content (approximately 12 pct).
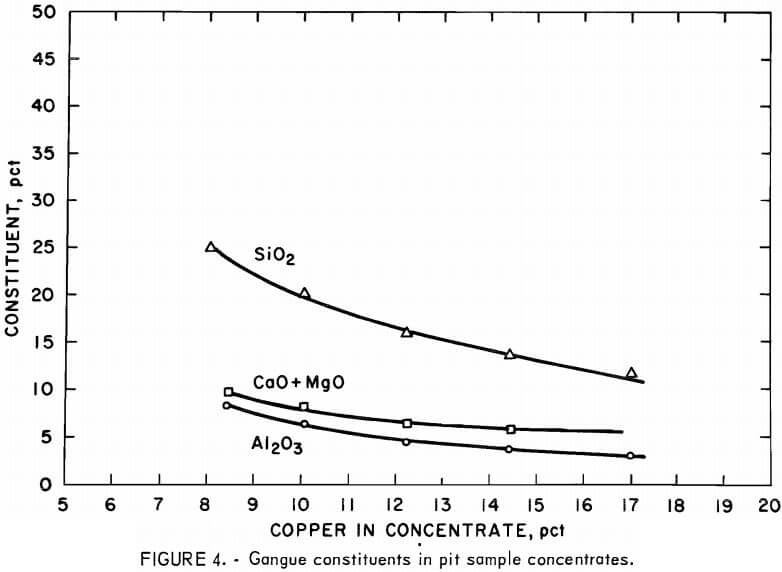
Excluding iron, the predominant gangue constituents in the concentrates were silica, magnesia, alumina, and calcia (fig. 4). Above the range of 12 to 13 pct Cu, the decrease in gangue content began to level off, and further efforts to increase the concentrate grade by adjustment of the flotation circuit resulted in copper recoveries below 80 pct (fig. 3).
At a grade of 14 pct Cu, the average copper concentrate contained 22.5 pct S. A sulfur balance indicated that the concentrate was comprised of about 70 wt-pct sulfide minerals. Chalcopyrite and cubanite (copper-iron sulfides) made up about 44 pct of the concentrate, while troilite and pyrrhotite comprised 19 pct, and pentlandite (nickel-iron sulfide) comprised about 7 pct.
Nickel recovery was consistent at the 60-pct level up to a copper grade of 15 pct. For grades above 15 pct Cu, the recovery data are scattered, but there was probably a downward trend in nickel recovery. The low nickel
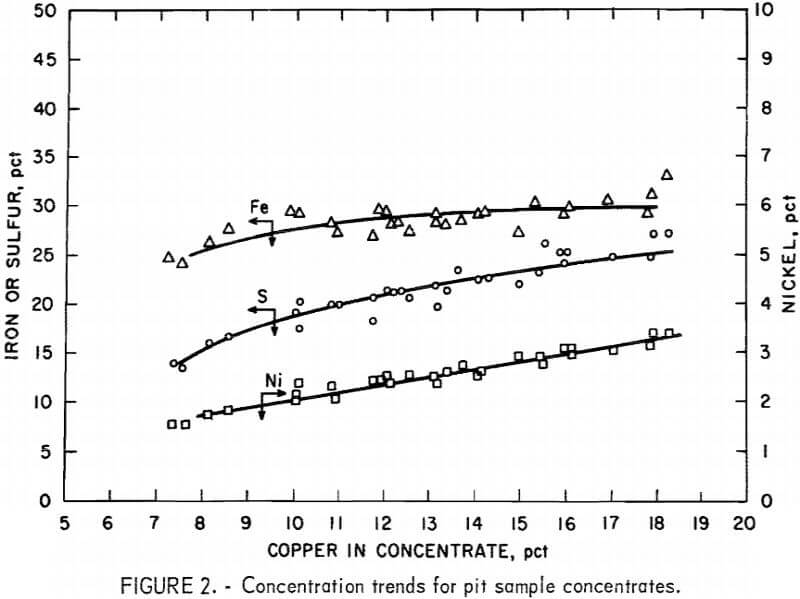
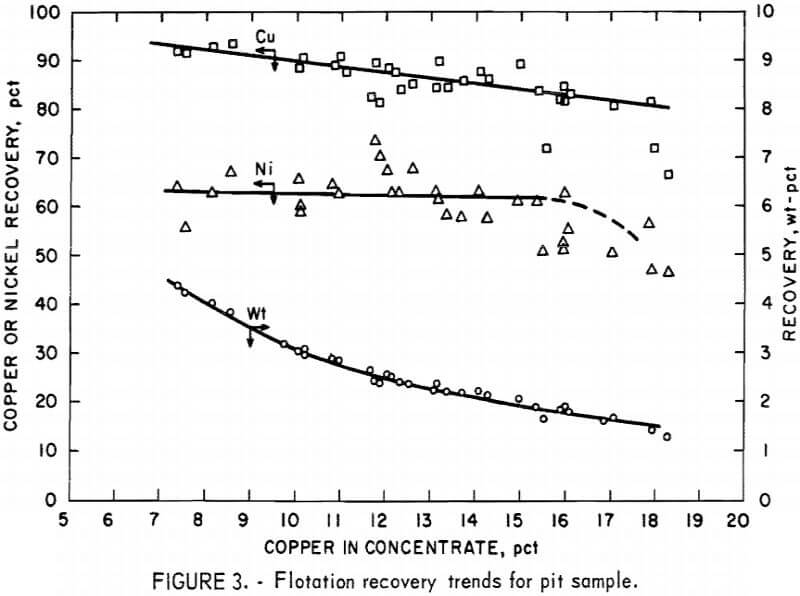
recovery was typical of the results of other research on similar Duluth Complex samples and has been attributed to unrecoverable nickel occurring either as fine pentlandite inclusions or as nickel replacing magnesium in the olivine lattice.
Composite Concentrate Results
Concentrates from each of the test periods were blended and analyzed, and the results are presented in table 6. The three samples shown in the table are numbered consecutively, each according to the 5-day test from which it was produced. Each sample was a composite taken from a blend of all the concentrates produced during the respective 5-day test periods.

Sample 2 had the highest copper and nickel grades. Daily copper grades during the second test period ranged as high as 18 pct, with a corresponding decrease in copper recovery. The copper and nickel recoveries during the second test period were 85 and 62 pct, respectively.
Sample 3 was the product of the most consistent operation of the continuous flotation circuit. This composite contained 12.2 pct Cu and 2.5 pct Ni, with recoveries of 87 and 62 pct, respectively.
Sample 1 included the portion of the concentrates that was reprocessed at the end of the first test period. This composite also contained the lowest grade concentrates—concentrates that were produced during the startup and balancing of the grinding and flotation circuits. Consequently, of the three composites, sample 1 was found to have the lowest copper and nickel grades.
Assays of the three concentrate composites for precious metals content (table 7) showed that platinum-group metals were predominant in value, along with small amounts of gold and silver.

Tailings Analysis
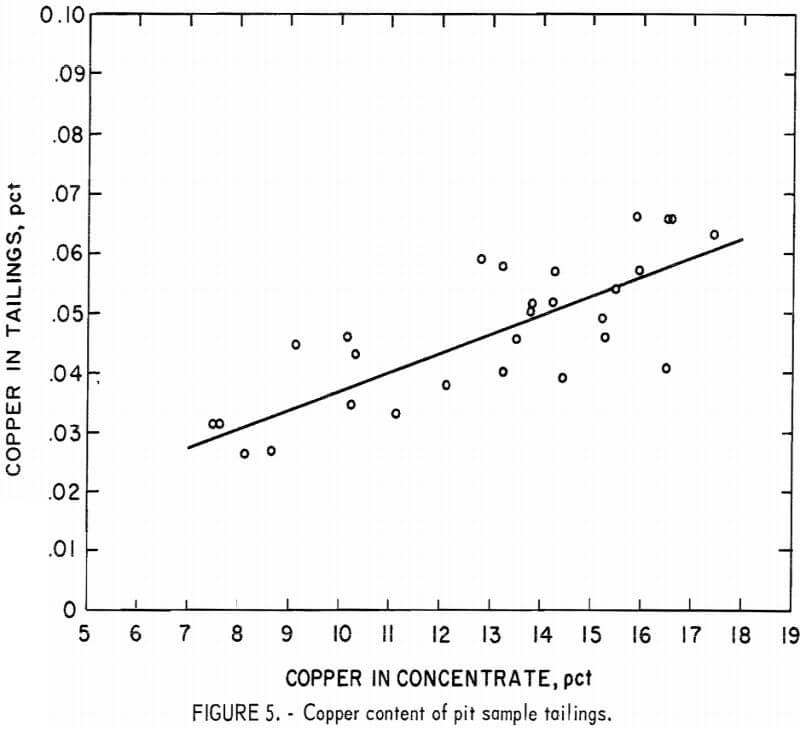
The copper content of the tailings ranged from 0.025 to 0.065 pct, and the highest of these values corresponded to an 18-pct-Cu grade (fig. 5).
The nickel analyses of the tailings, however, did not demonstrate an upward trend as concentrate grade increased. Instead, nickel content remained constant at about 0.045 pct up to the 15-pct-Cu level. Data from nickel analyses of the tailings were scattered when the copper grade was above 15 pct, but probably showed an upward trend. A partial chemical analysis of the pit tailings composite appears in table 8.

Summary of Results
In summary, data obtained from pilot plant flotation of the Duluth gabbro pit sample confirmed the results of previous laboratory work done on similar samples by the Bureau and other investigators. Copper recoveries for the composite bulk concentrates ranged from 85 pct at a 15-pct-Cu grade to 90 pct at a 10.7-pct-Cu grade. Nickel recoveries were constant at 60 pet over the sane range of copper grades, and the corresponding nickel grades were 3.1 and 2.1 pct, respectively. Nickel recovery was limited by a minimum attainable nickel content of 0.03 to 0.042 pct in the tailings.
Shaft Sample
Procedure
The flotation circuit used to float the shaft sample (fig. 6) was based on experience gained from pilot plant flotation of the pit sample (fig. 1). Replacement of the cyclone and rapped-screen size-classification equipment with a rake classifier was the only major change from the previous flowsheet.
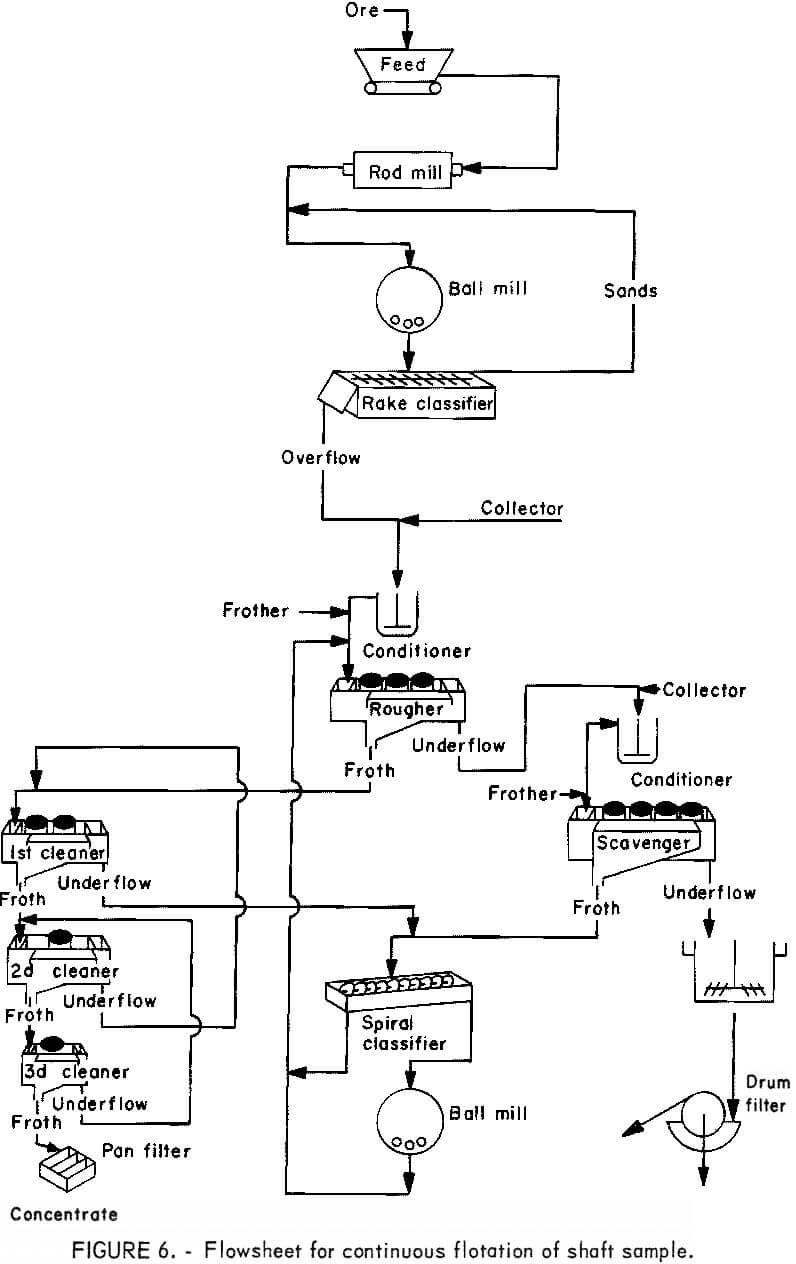
This was done primarily to eliminate surging in the grinding circuit, which had been a problem when the cyclone was used with the rapped screen.
Flotation was carried out in two tests. During the first test, sodium isopropyl xanthate collector was added to the conditioner prior to rougher flotation, and the frother (methyl isobutyl carbinol) was added to the feed pump to the rougher float cell. Xanthate additions to the rougher feed were varied from 0.1 to 0.25 lb/ton, but no increase in recovery resulted when the rate of the xanthate additions was increased.
During the second test, a second conditioner was added ahead of scavenger flotation. The addition of collector at this point in the flowsheet did result in improved copper recovery.
The first test was a 5-day continuous float with a nominal feed rate of 1,000 lb/hr. The classifier was operated to deliver an overflow containing 35 pct solids to give a primary grind of 65 pvt minus 325 mesh (table 9). Pulp from the classifier overflow was pumped to the conditioner and then to rougher flotation.

Initial Copper Nickel Flotation Results
Some of the results of the first pilot test on the shaft sample fell short of the values projected from the laboratory results. Copper recoveries, in particular, were low, averaging 81 pct over the 5-day test. Copper and nickel grades, however, averaged 13 and 2.5 pct, respectively; both were higher than the 11 and 2 pct grades (in round figures) predicted from the laboratory cyclic tests. Nickel recovery averaged 65 pct, which was the anticipated value.
The second test lasted 10 days and processed nearly 100 tons of ore at a nominal feed rate of 900 lb/hr. Sodium isopropyl xanthate (0.1 lb/ton) was added to the conditioner ahead of rougher flotation, and an additional 0.05 lb/ton was added to the conditioner ahead of scavenging.
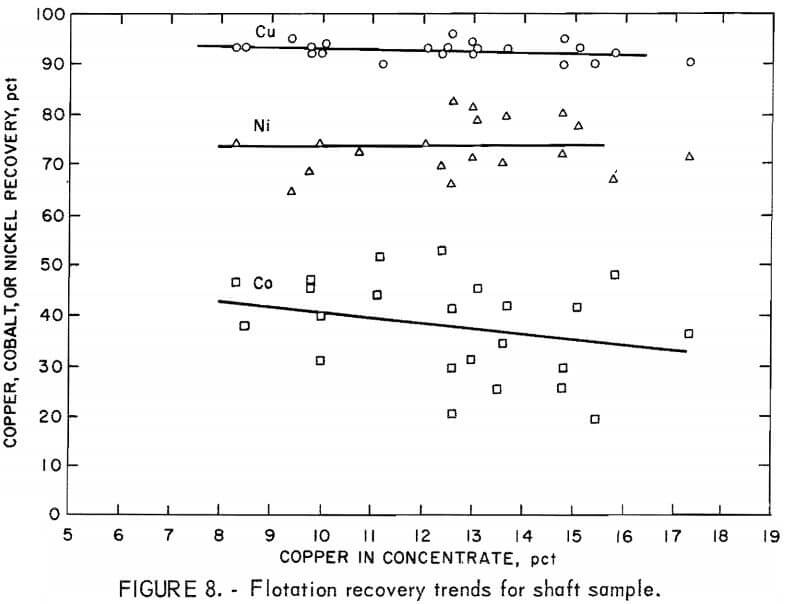
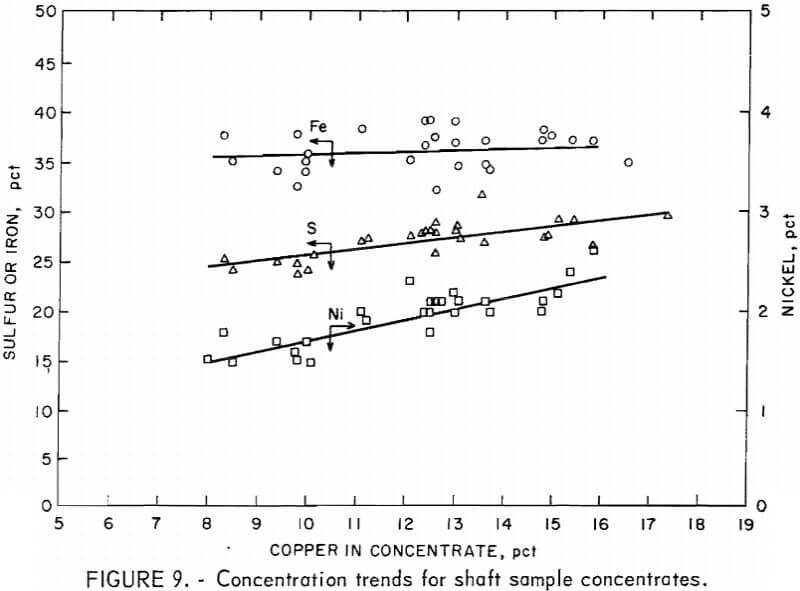
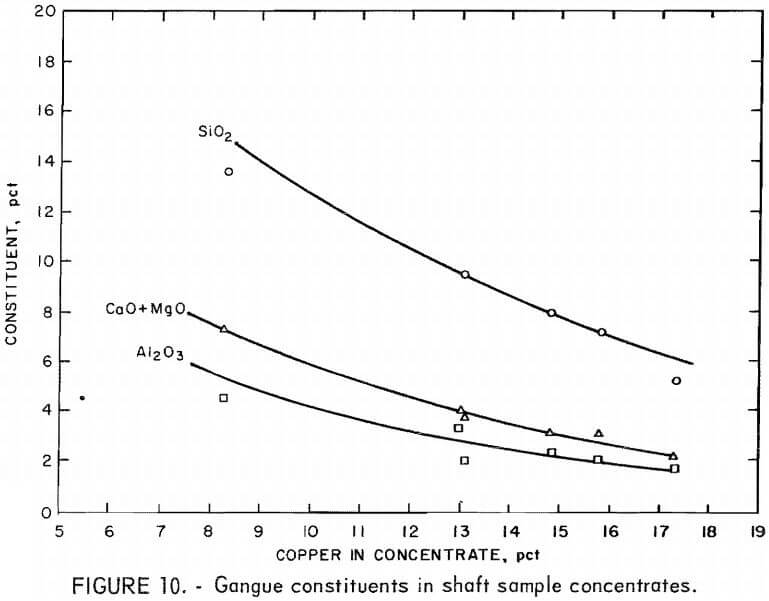
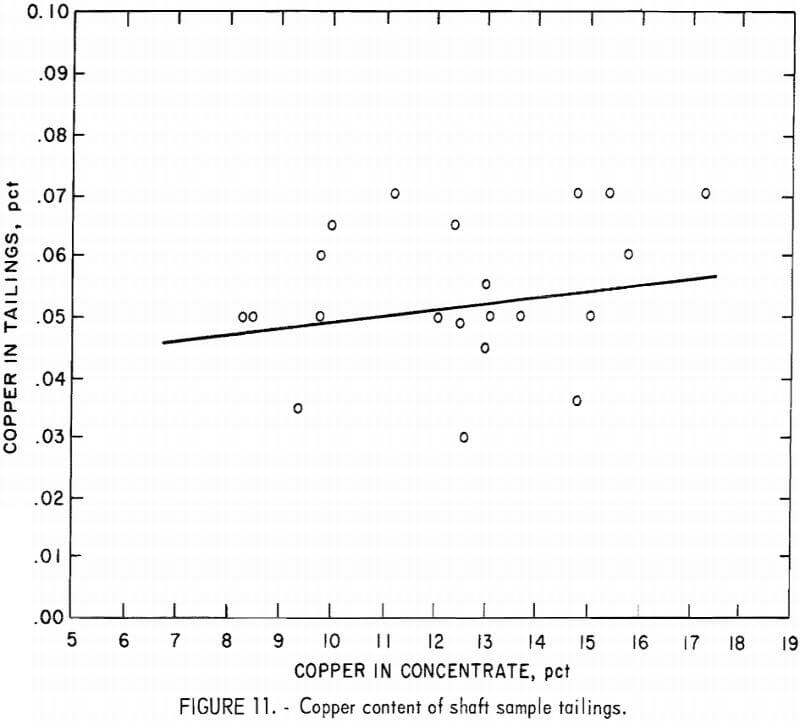
The results from this test were more consistent and more in agreement with the grades and recoveries predicted from laboratory tests. The daily shift data collected from the 10-day test were plotted against the copper grades of the concentrates (figs. 7-11). Approximately 5.2 wt-pct of the ore was recovered at the 12.0-pct-Cu grade (fig. 7). Over the range of
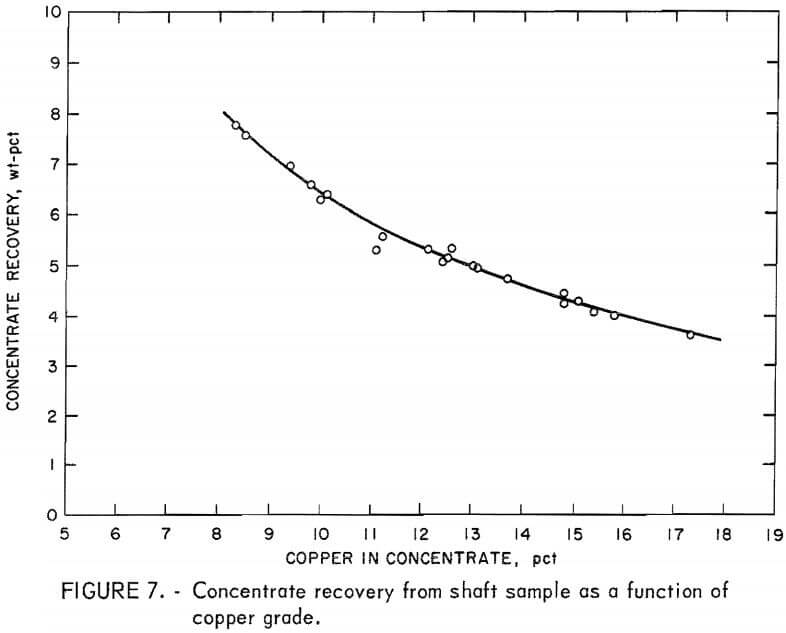
concentrate grades, the concentrate recovery was as high as 7 wt-pct for the low-grade (8 pct Cu) concentrates and 3.5 wt-pct for the concentrates that contained more than 15 pct Cu.
From the recovery curves shown in figure 8, it can be observed that the copper recovery from the shaft sample was greater than 90 pct for the entire range of concentrate grades, with a gradual decrease in copper recovery as concentrate grade Increased. Nickel recovery remained virtually constant at about 73 pct over the entire range of copper grades; in this respect, the results were similar to those obtained from the pit sample.
In this pilot test, sufficient data were collected to determine the recovery of cobalt. Although the data is quite scattered-due to the low concentration of cobalt in the concentrates and tailings—cobalt recovery appears to decrease more rapidly as concentrate grade increases than does either copper or nickel recovery. Since cobalt has been reported to occur only in the pentlandite (nickel-iron sulfide), the cobalt recovery should be about equal to the nickel recovery. No explanation has been determined for the fact that the cobalt recovery was only about half the nickel recovery, but this finding might be explained by low concentrations of cobalt occurring in the silicate gangue minerals. However, no such occurrence of cobalt in the gangue minerals could be detected.
Figure 9 shows the concentration levels of iron, nickel, and sulfur in the shaft sample concentrates as a function of concentrate copper grade. Iron was present at the highest concentrations (36 to 38 pct) in the concentrates. This was due to the occurrence of iron in all the copper and nickel minerals and the relatively high proportion of troilite to the other sulfide minerals. No attempt was made either to depress the iron sulfides during flotation or to remove them from the concentrates after bulk flotation. The iron sulfides were primarily the nonmagnetic varieties of pyrrhotite and troilite, so magnetic separation would not have been effective for upgrading the concentrates.
Sulfur was the next most abundant element in the concentrates, varying from 25 to 30 pct and averaging 27 pct.
The major gangue constituents in the shaft sample concentrates are shown as a function of copper grade in figure 10. Plagioclase feldspar and biotite mica were the major mineral species contaminating the sulfide concentrate. The feldspar occurred primarily as locked grains containing small amounts of sulfides , and the biotite occurred as free, naturally floatable flakes or as mica-sulfide laminates.
Figure 11 shows the copper content of the tailings versus the copper content in the concentrates. Although the tailings data are scattered from 0.03 to 0.07 pct, there is an average increase in the copper content of the tailings from 0.05 to 0.055 pct over the range of copper concentrates produced. The nickel content of the tailings was not included in this series of illustrations because the data show a zero slope, which is in agreement with the flat recovery curve shown in figure 8.
Composite Concentrate Results
At the completion of the second test, the shaft sample concentrates recovered from both tests were air dried for several days until the moisture content was low enough that the concentrates could be blended. After the concentrates were throughly blended, a 50-pound head sample was cut from the bulk sample. Table 10 lists the major constituents of the bulk sulfide sample.

Summary of Copper Nickel Flotation Results
The analyses given in tables 10 and 11 (which shows a partial analysis of the tailings) are in fair agreement with the concentrations predicted for the shaft sample tests by the cyclic laboratory tests. In comparison, the predicted and the actual pilot plant results (table 10) were, respectively, 11 pct versus 12.2 pct Cu, 2 pct versus 2.1 pct Ni, and 24 pct versus 26.6 pct S (with the predicted values given in rounded figures). These comparisons indicate that the pilot results were slightly better than those predicted by laboratory flotation. The copper and nickel recoveries in the second pilot test also exceeded those predicted by the laboratory results. The actual and predicted recoveries for the second pilot test were, respectively, 92 versus 90 pct for copper and 73 versus 65 pct for nickel.

Material Balance for the Shaft Sample Flotation Flowsheet
To obtain an approximation of the material flow throughout the pilot flotation plant, a material balance using the shaft sample results was carried out over each flotation step. The balance was based on the copper content of the froth and sands stream that exited from each flotation cell. The overall plant balance was determined from the average copper contents of the ore, the tailings, and the bulk concentrate. Then, based on the 900-lb/hr feed rate, the weight per hour of the final tailings and concentrates was calculated.
This information was used along with the copper contents of other streams in the flowsheet to determine the solids rates of the other streams. The values used were the averages from eight shifts throughout the test, and all the composite samples were analyzed during these shifts. The calculated solids and copper rates are shown in figure 12.
The results indicated that the first cleaner float carried a heavy circulating load from the second cleaner and that the first cleaner cell accomplished only a moderate amount of upgrading. This may have been because the cell was oversize for the amount of material that was handled. Difficulty with sanding was encountered throughout the test in this cell.
Scavenger flotation was fairly effective; it recovered almost half the copper content of the rougher tailings while returning to rougher flotation a froth that was almost equal to the ore in grade.
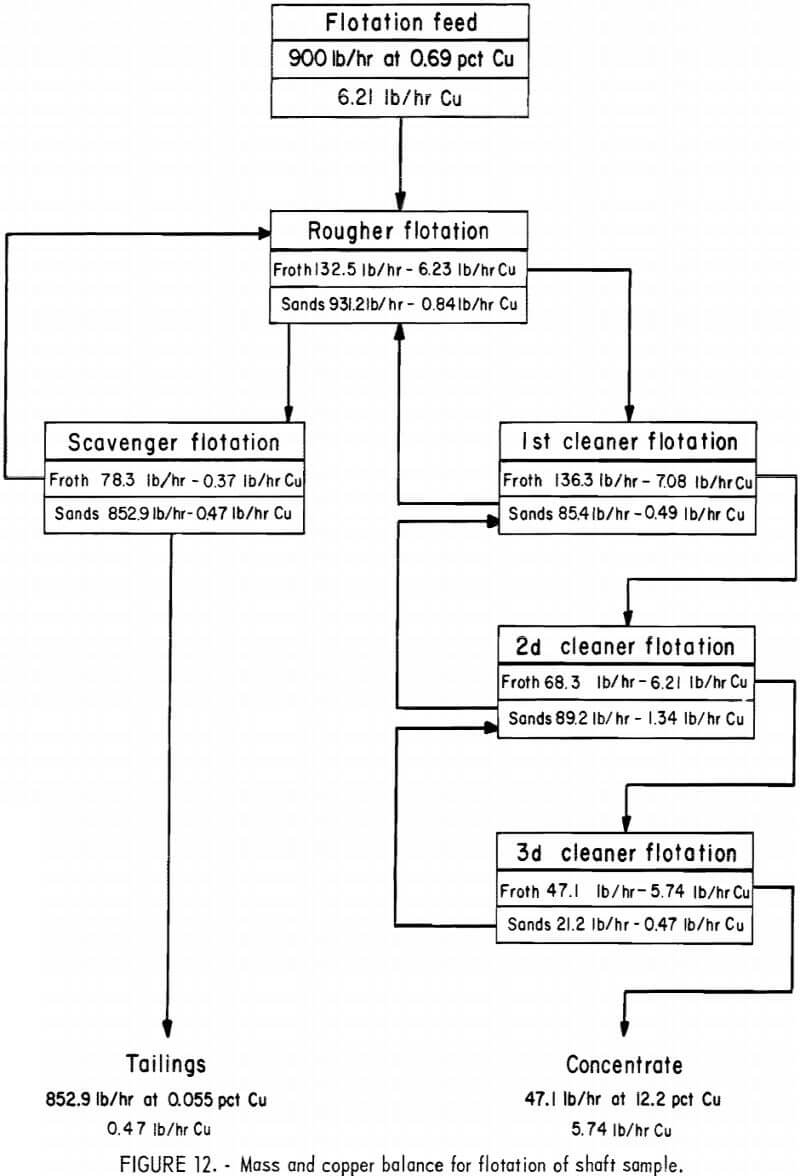
The second and third cleaner cells, which were both single-cell units, were considerably more effective than the first cleaner; they increased the grade of the concentrates from 5.2 pct Cu to 12.2 pct Cu.
Comparison of Flotation Results for Pit and Shaft Samples
The two ore samples were quite similar in their flotation responses. Average weight recoveries from the ores were 2.5 and 5.2 pct for the pit and shaft samples, respectively. This was primarily due to the difference in grade between the samples.
Recoveries of copper and nickel values were slightly higher from the shaft sample than from the pit sample. This was due to the higher grade of the shaft sample and not to the production of cleaner tailings. The copper content of the shaft tailings (0.055 pct) was higher than that of the pit tailings (0.050 pct), but the nickel content of the shaft tailings (0.040 pct) was slightly lower than that of the pit tailings (0.045 pct).
Grades of the concentrates from the two samples were similar, although the shaft sample concentrates were richer in sulfides. This difference was primarily due to the higher troilite and pyrrhotite contents of the shaft sample and can be seen by comparing the pit sample data in table 6, for concentrate 3 (which reflected the most consistent operation of the flotation circuit), with the shaft sample data in table 10.
Precious metals concentration in the shaft sample concentrates was about half that of the pit sample concentrates; however, because the weight recovery from the shaft sample was twice the pit sample weight recovery, the amount of precious metals recovered per ton of ore processed was about equal for both samples. Although the quantity of precious metals was low, the values were sufficient to make precious metals recovery attractive.
The gangue content of the pit sample concentrates was about 30 pct gangue constituents. In both cases, plagioclase feldspar was the predominant gangue mineral.
Summary
This investigation evaluated two samples of Duluth Complex sulfide mineralized rock in both laboratory and pilot plant flotation. Both samples were disseminated sulfide ores containing copper and nickel mineralization, plus iron sulfides as troilite and pyrrhotite.
Both samples responded to flotation in a very similar manner, yielding concentrates of 12 to 13 pct Cu and 2.0 to 2.5 pct Ni. These concentrates were lower in grade than normal copper concentrates and contained more nickel than can be tolerated in a conventional copper smelter. Upgrading of the concentrates could be accomplished by removing the troilite and pyrrhotite content. This could only be accomplished by flotation, since the iron sulfides are nonmagnetic in behavior.
Recoveries of copper and nickel from the pit and shaft samples were, respectively, 87 and 92 pct for copper and 62 and 73 pct for nickel. Tailings from the pit and shaft samples were, respectively, 0.055 and 0.050 pct Cu and 0.040 and 0.045 pct Ni. Cobalt recoveries from the ores were quite low-about 25 pct for the pit sample and 35 pct for the shaft sample. The reason for the low cobalt recoveries has not been resolved. Nickel losses to the tailings were attributed to nickel replacing magnesium in the olivine lattice, but no such occurrence of cobalt in the gangue minerals could be detected.
Conclusions
It appears that bulk sulfide concentrates grading from 12 to 13 pct Cu, 2 to 3 pct Ni, and 24 to 28 pct S can be recovered from disseminated sulfide ores of the type studied in this investigation. The iron content of the concentrate can be expected to vary from 30 to 37 pct, depending on the quantities of troilite and pyrrhotite occurring in the sample. Bulk concentrate grades higher than these are not practical because of increased copper and nickel losses to the tailings.
To confirm the results of the batch testing and provide the cooperating company with a large sample of the cobalt nickel and copper-lead concentrates for further experimentation, pilot-plant flotation tests were made. The pilot-plant was operated 24 hr a day, except for minor interruptions for repairs and disposal of tailing. In the pilot plant, the crushed ore was ground at an average rate of about 3.0 lb a min in a 19 x 36″ ball mill in closed circuit with a 24″ bowl classifier. As in the batch tests, lime and cyanide were added to the ball mill. The classifier overflow as laundered to a 12″ conditioner, to which either Aerofloat 15 or 31 was added as a promoter for the copper and lead minerals. The pulp flowed by gravity to a bank of six Denver No. 5 flotation cells, where the chalcopyrite and galena were removed in bulk. The pulp leaving the copper-lead circuit was pumped to a similar bank of cells, where xanthate 2-8 and a frother were added and the siegenite was roughed off in the first three cells and cleaned once in the others. The final tailing was rejected in the cobalt-nickel circuit. The flotation pilot plant is shown. Results typical of a single shift during the pilot run are summarized.
The recoveries of lead and copper were 87.1% and 81.6% in a concentrate analyzing 20.6% copper, 10.1% lead, 0.99% nickel, and 0.77% cobalt. This represented a material increase in the recovery of lead over that attained in the batch tests, but the recovery of copper was lower. At the time the pilot plant was in operation it was noted that chalcopyrite was not floating as readily as in the small tests. The latter had indicated that 8 min flotation time would be required for the copper-lead flotation. The six rougher cells in that circuit provided 8 min of contact time, and it was adequate for the galena, but rapid flotation of the chalcopyrite equal to that of the batch tests was not achieved. Flotation capacity was limited, and it was not possible to increase the number of cells to correct this situation. Other possible corrective measures, such as changes in the reagent combination, were Investigated, but none were successful. Considering other results of the pilot test, total recovery of nickel plus cobalt was greater than in batch tests, but the grade of concentrate was lower. The latter was due in part to the fact that chalcopyrite, which had not floated in the copper-lead circuit, reported in the cobalt-nickel concentrate.
Why chalcopyrite was more reluctant to float in the pilot plant than in the batch tests is difficult to explain. Differences in grind and soluble salt content may have contributed to the difference in behavior. In retrospect, it is probable the pilot results could have been improved by reducing the feed rate to provide additional contact time in the flotation circuit. While this is not an entirely satisfactory solution, such a move might have improved the copper recovery and both grade and recovery of the cobalt-nickel product. Limitations in the amount of available flotation capacity also prevented inclusion of a copper-lead separation circuit in the pilot plant. However, batch tests made later on a sample of pilot-plant copper-lead concentrates showed that a separation could be effected either by depressing galena with an alkali dichromate and floating the chalcopyrite, or 2-depressing the chalcopyrite with a cyanide and floating galena.
[fusion_builder_container hundred_percent=”yes” overflow=”visible”][fusion_builder_row][fusion_builder_column type=”1_1″ background_position=”left top” background_color=”” border_size=”” border_color=”” border_style=”solid” spacing=”yes” background_image=”” background_repeat=”no-repeat” padding=”” margin_top=”0px” margin_bottom=”0px” class=”” id=”” animation_type=”” animation_speed=”0.3″ animation_direction=”left” hide_on_mobile=”no” center_content=”no” min_height=”none”]
