Table of Contents
In an earlier phase of the investigation, an experimental room was progressively mined to an areal dimension of 50 by 100 feet. As the dimensions of the room were increased, the roof separated into horizontal layers that were loaded only by their own weight. The maximum stress and the elastic behavior of the lowest roof layer were computed from the dimensions of the room and the thickness and deformation of the layer. These values were compared with the strength and elastic constants of the roof rock, as determined from samples tested in the laboratory.
The comparison showed that the roof layer should be stable – that the maximum stress was less than the strength of the rock. However, because the dimensions of the room were not increased to the point of roof failure, the ultimate strength of the roof in-place could not be determined.
The procedure employed in previous investigations to determine the stability of a roof layer by increasing the room dimensions is costly, time-consuming, and requires the use of temporary support to insure safety during widening procedures.
In the investigation described in this report, the stability of the roof was determined by increasing the stress in the lowest roof layer; air under pressure was forced into the separation between the lowest layer and the overlying rock; and the pressure was increased by increments until failure was induced.
The results of such a test are described in this report, with (1) the general considerations – the equations relating the dimensions of the room, the deflection of the roof, and the air pressure, to the maximum stress and elastic constants of the roof rock; (2) the design of the instruments for measuring roof sag, tensile strain, air pressure, and the microseismic noise generated in the roof; (3) the experimental room data; and (4) an analysis and discussion of the results.
Acknowledgments
The authors are indebted to the Columbia Cement Division of the Pittsburgh Plate Glass Co., Zanesville, Ohio,for providing the facilities of the Jonathan limestone mine for this test.
General Considerations
In the first phase of this investigation an experimental room was mined to 50 to 100 feet and the behavior of a 6-inch-thick limestone-rock layer studied. Because the calculated stress in this 6-inch layer approached the laboratory-measured strength of the rock, plus the fact that it was necessary to gain access to the bottom of the next layer to continue the test, the 6-inch layer was removed.
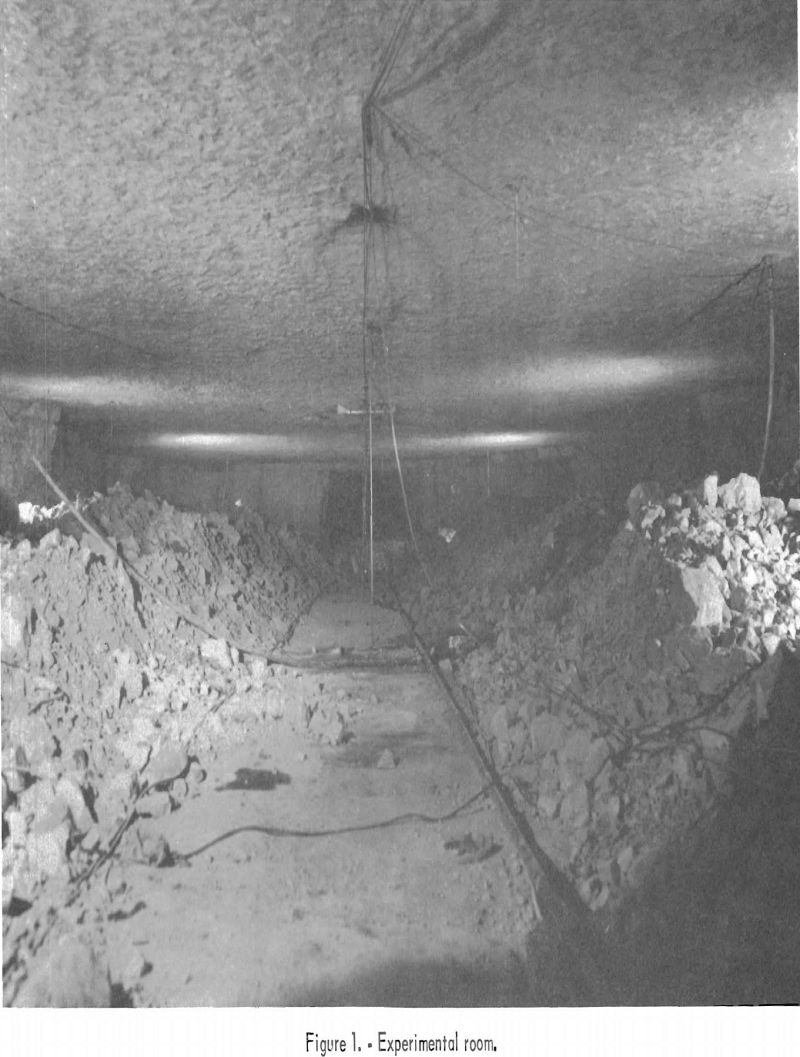
The removal exposed the base of a 20-inch-thick limestone-roof layer, on which the present test was performed. A photograph of the room is shown in figure 1. This layer was detached from the overlying layer by a separation of about 0.30 inch. Stratascope observations established that the thickness of the roof layer was uniform over the extent of the room.
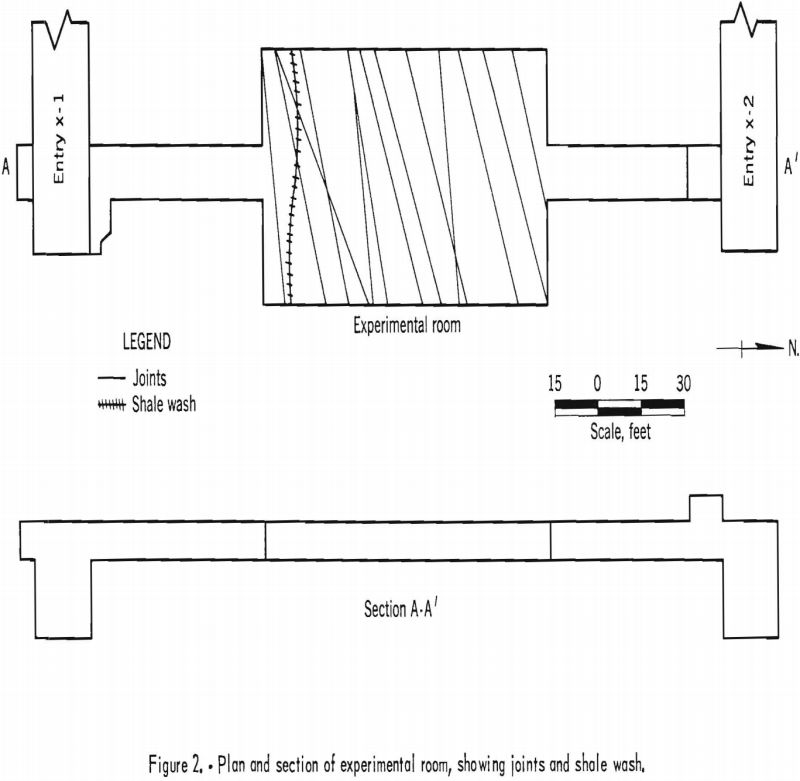
A system of approximately vertical joints and a shale wash were observed in the roof. The direction of the joints and the wash are shown in figure 2. All joints were bonded by a very thin filling of calcite. The wash was filled with shale. The joints and wash were tightly bonded and intersected the room across the short dimension.
The roof layer consisted of a dense, finely crystalline limestone. The physical properties of this limestone were determined in the laboratory by established procedures; part of the results are given in table 1.

The modulus of rupture is a measure of the outer fiber tensile strength of the rock. The modulus of rupture of this limestone (4,650 p.s.i.) is high compared with that for other limestones. The modulus of elasticity measured in compression is about 16 percent higher than the modulus of elasticity measured in tension.
The equations for the maximum tensile stress and maximum deflection of a gravity (body)-loaded beam with clamped ends are
T = ρL²/2t……………………………………………………….(1)
D = ρL4/32Et²……………………………………………….(2)
where
T = maximum tensile stress,
D = maximum deflection,
ρ = weight per unit volume,
L = length of beam,
t = thickness of beam,
E = modulus of elasticity.
The maximum tensile stress occurs at the ends (top side) of the beam. The tensile stress at the center (bottom side) of the beam is one-half the maximum value. The maximum deflection occurs at the center of the beam.
A uniformly distributed load (in this instance, air pressure) applied to a beam is equivalent to an increase in gravity load on the beam, hence, equations (1) and (2) become
T = ρL²/2t + PL² + 2t²……………………………………………..(3)
D = ρL4/32Et² + PL4/32Et³…………………………………….(4)
where
P = air pressure.
The change in maximum tensile stress of the beam for a given change in air pressure is
ΔT = T2 – T1 = L²/2t² (P2 – P1)…………………………………(5)
where
T = change in tensile stress,
T2 = final tensile stress,
T1 = initial tensile stress,
P2 = final pressure,
P1 = initial pressure.
Correspondingly, the change in maximum deflection or the sag of the beam for a given change in air-pressure loading is
S = (D2 – D1) = L4/32Et³ (P2 – P1)……………………………………(6)
or ΔD = L4/32Et³ ΔP……………………………………………………..(7)
where
S = sag,
ΔP = change in pressure,
D2 = final deflection,
D1 = initial deflection,
ΔD = change in deflection.
The tensile stress at the center of the beam (bottom side) can be expressed as
Tc = Ee…………………………………………………………………..(8)
where
e = tensile strain measured at the center (bottom side) of the beam
Tc = tensile stress at the center (bottom side) of the beam.
The tensile strain, resulting from both gravity- and air-pressure load, is
e = ρL²/4Et + PL²/4Et²………………………………………….(9)
and the change in tensile strain corresponding to changes in air pressure is
Δe = e2 – e1 = L²/4Et² (P2 – P1)…………………………………..(10)
or
Δe = L²/4Et² ΔP……………………………………………………….(11)
where
e2 = final strain at the center (bottom side) of the beam,
e1 = initial strain at the center (bottom side) of the beam,
Δe = change in tensile strain at the center (bottom side) of the beam.
The relationship between the change in deflection (equation (7)) and the change in tensile strain (equation (11)) can be expressed as
ΔD = K L²/t Δ e…………………………………………(12)
where
k = 1/8 = 0.125
The tensile stress at the center (bottom side) of the beam, from equations (8) and (9) , is

From the dimensions of the roof layer (roof span = 50 feet, roof thickness = 20 inches) and the physical property of the rock, the maximum stress, maximum deflection, sag, strain, and the air pressure required to produce failure can be computed from the foregoing equations. For example, if the modulus of rupture is substituted for the maximum tensile stress in equation (3), the pressure required to load the roof to the critical stress is 8.3 p.s.i. The roof span required to produce the same stress, computed from equation (1) by substituting the modulus of rupture for the maximum tensile stress, is 114 feet.
Instrumentation
Instrumentation was designed or selected to control and measure the air pressure on the roof layer and to measure the roof sag, differential roof sag (the difference in roof sag between the top and bottom of the layer) tensile strain on the bottom surface of the roof at the center, and the micro-seismic noise rate. The instruments were such that all measurements could be made outside the room. Each instrument is described below.
Air-Pressure Regulation, Distribution, and Measurement
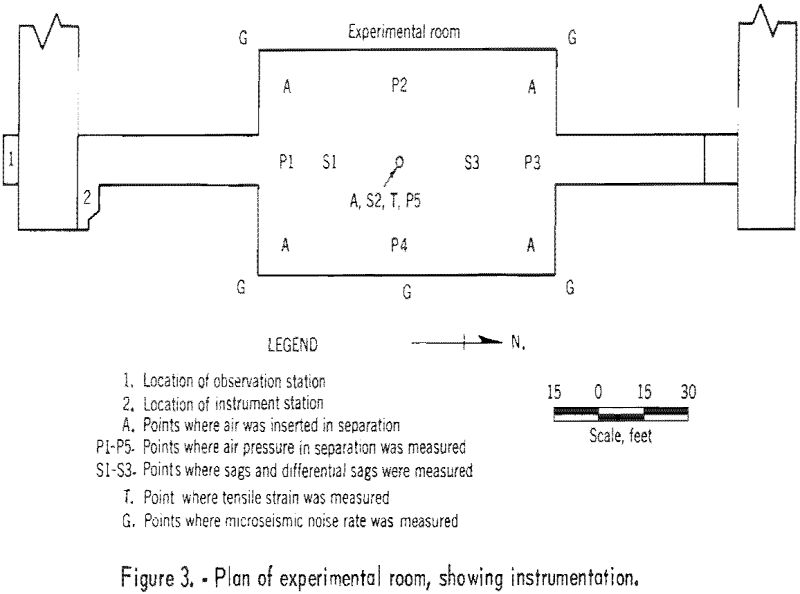
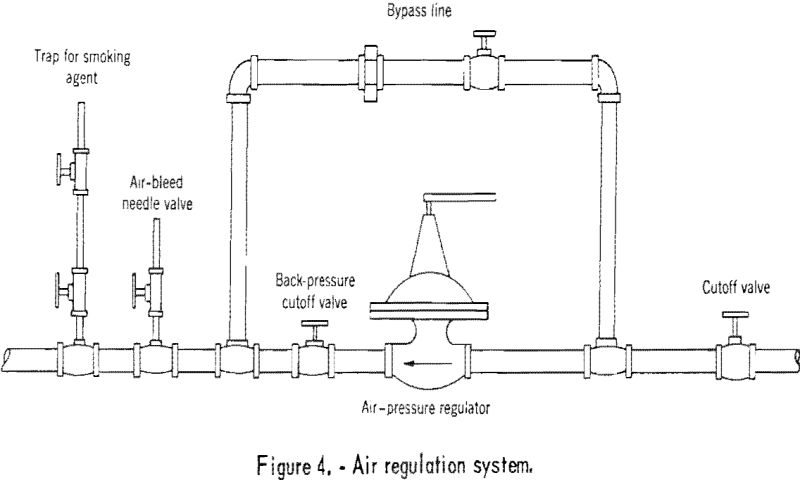
Air was introduced into the roof at five points (see fig. 3). The air pressure was controlled at the instrument station by a 0- to 30-p.s.i. air-pressure regulator and bypass system. A smoking agent, titanium tetrachloride, was inserted into the regulated air supply to indicate possible escape of air from the roof. Visual observations for smoke and roof falls were made with a telescope in the observation station (see fig. 3). A drawing of the air-regulation system is shown in figure 4.
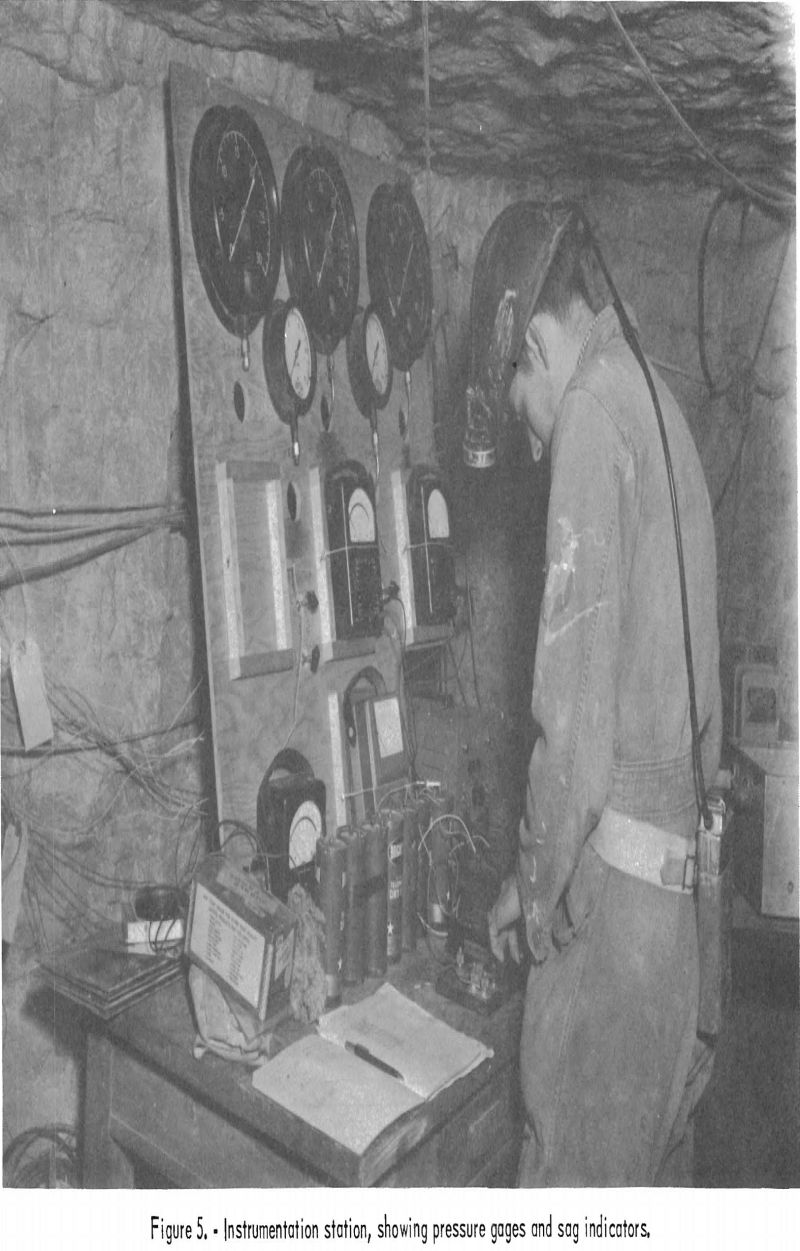
The air pressure in the roof separation was measured at 5 points in the roof (see fig. 3). The pressure was transmitted through ¼-inch tubing to indicators in the instrument station (see fig. 5).
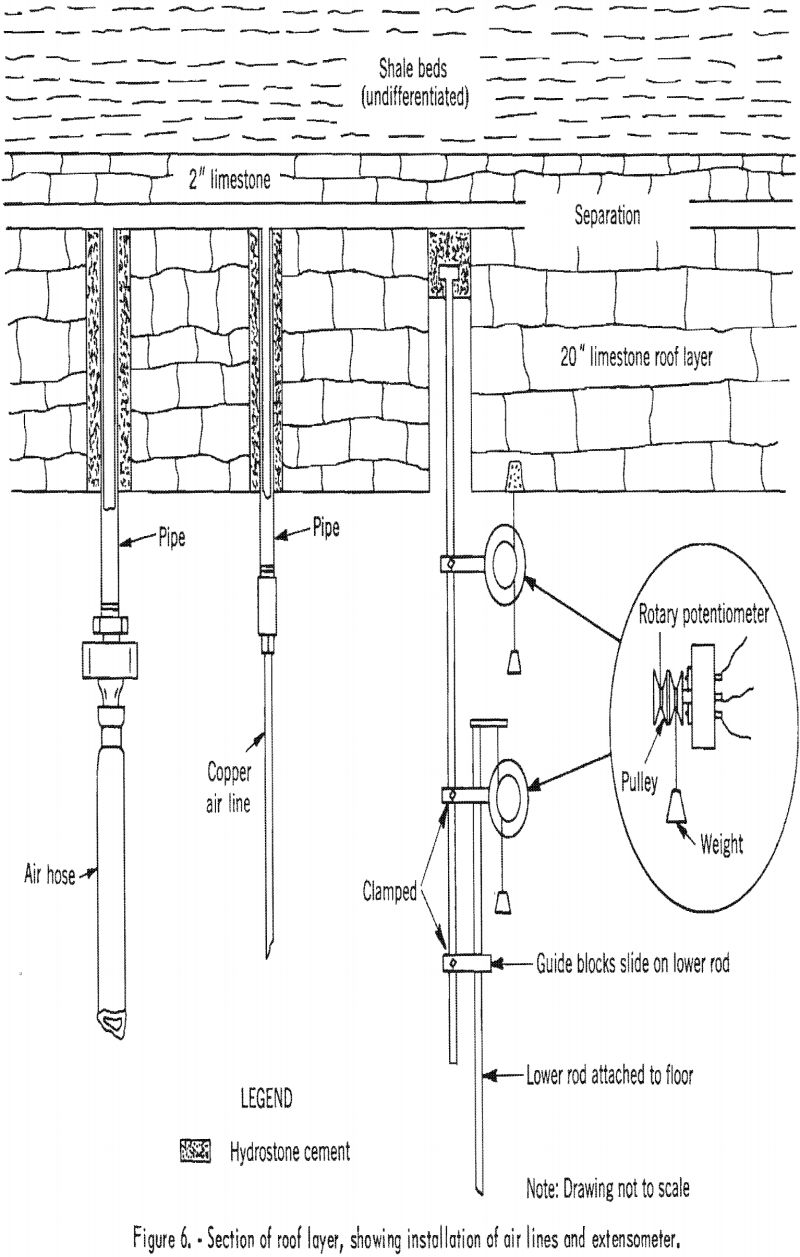
A cross section of an air inlet and a pressure measurement outlet in the roof is shown in figure 6.
Measurement of Sag and Differential Sag
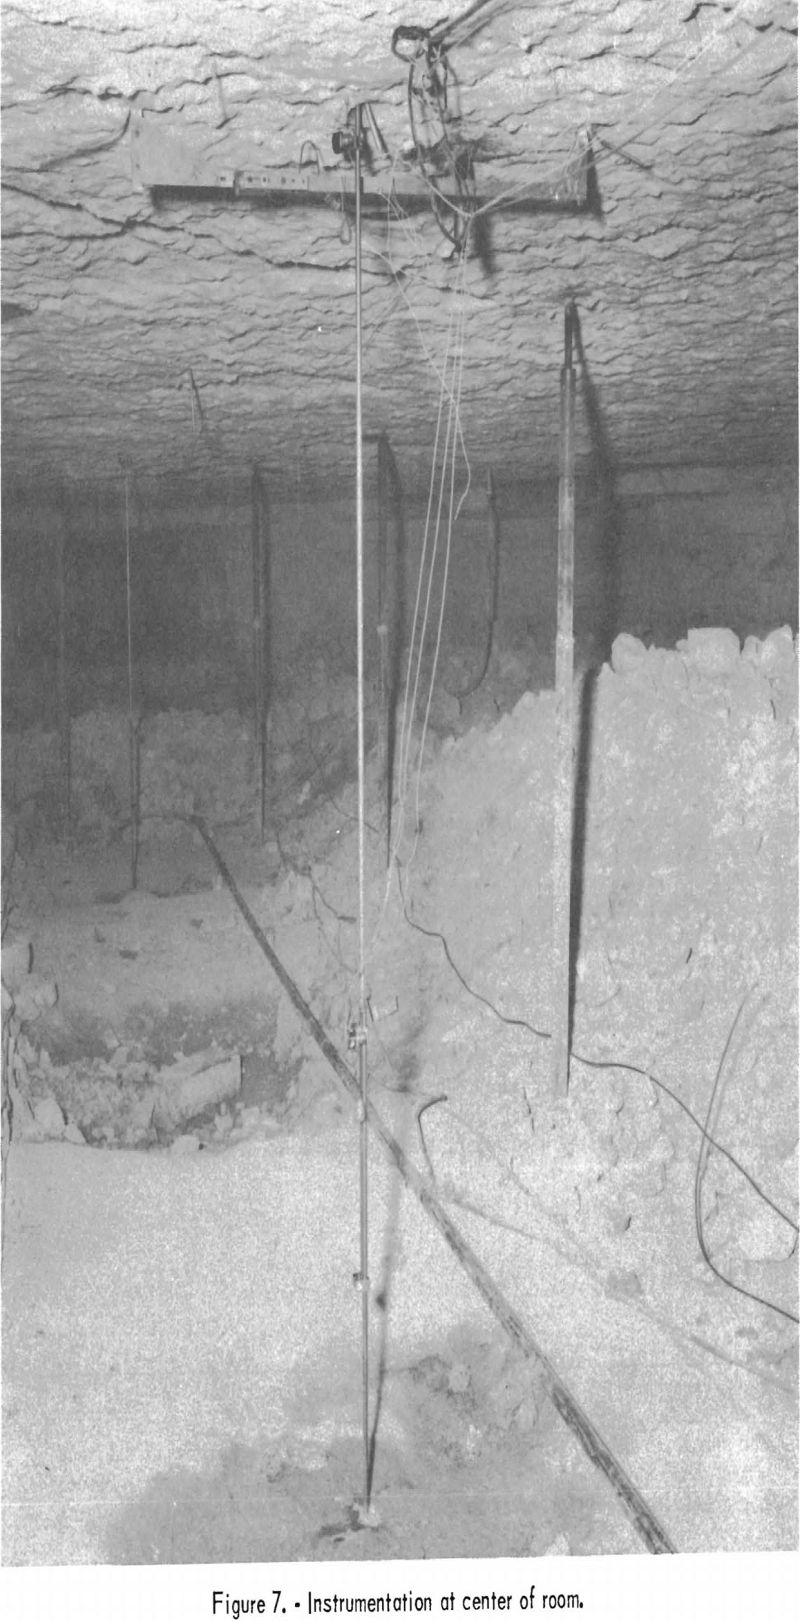
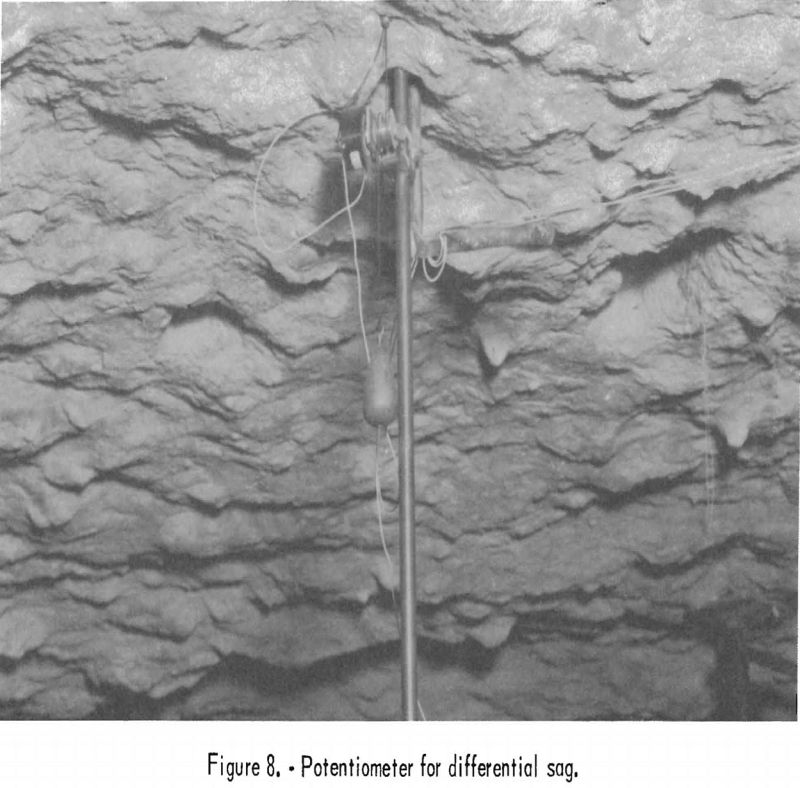
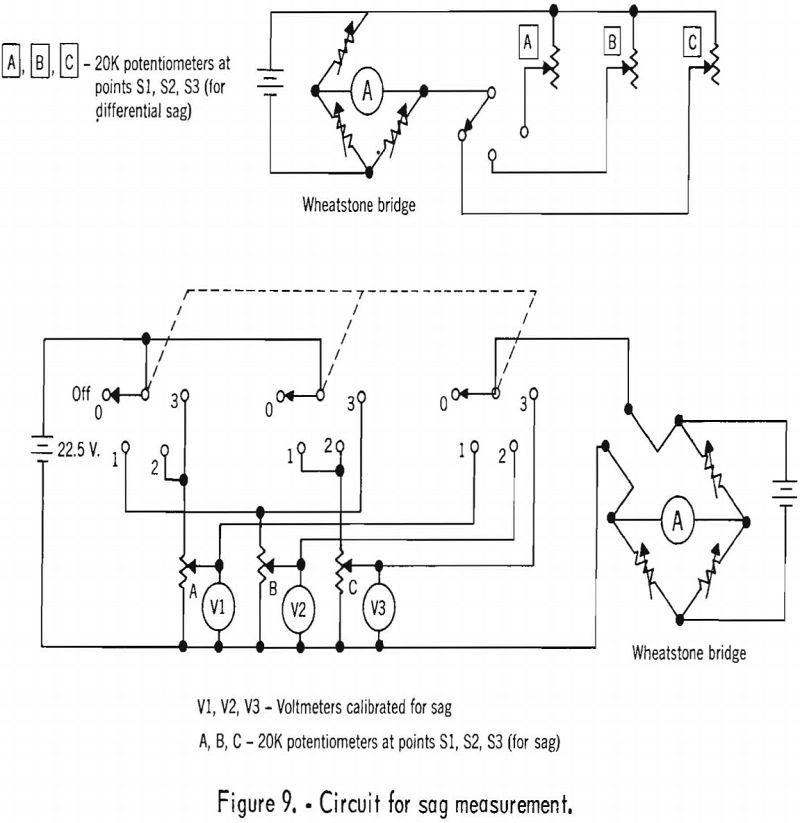
The value of the modulus of elasticity of the layer in-place is, from equation (2), about 2 x 10 6 p.s.i. The calculated sag at failure (8.3 p.s.i.) using the value in-place, of the modulus of elasticity from (equation (6)) is about 2.3 inches. An extensometer was designed to measure this value. The body of the extensometer consisted of 2 stainless steel rods coupled by 2 guide, blocks (see figs. 6 and 7). The ends of the rods were cemented in the top of the roof layer and in the floor. A rotary-type, precision potentiometer was attached to the rods to convert movement of the rods into changes in electrical resistance (see fig. 8). A weight was suspended from the shaft to preclude “backlash” in the rotary motion. The changes in electrical resistance were transmitted by cable to a Wheatstone bridge and voltmeters in the instrument station (see fig. 5). A schematic diagram of the electrical circuit is shown in figure 9. The potentiometer was calibrated in the laboratory and recalibrated in the room. The accuracy of the sag measurement was about 0.010 inch by voltmeter measurement and 0.0015 inch by Wheatstone-bridge measurement.
Differential sag between the top and the bottom of the roof layer was measured in a similar manner. The potentiometer was anchored to the extensometer rod at a point near the surface of the roof. The shaft of the potentiometer was coupled to the bottom of the roof layer (see figs. 6 and 8).
Sag and differential sag were measured at 3-points, S1, S2, and S3, along the major axis of the roof (see fig. 3). These points were 25, 50, and 75 feet from the portal of the room.
Measurement of Tensile Strain
From equation (10), the anticipated maximum change in strain at the center of the roof layer (bottom side) at failure (8.3 p.s.i.) is 935 microinches per inch. The change in distance or the displacement was measured between pins anchored 22.5 inches on either side of the room center. The strain was computed by dividing this displacement by the spacing between the pins (45 inches).
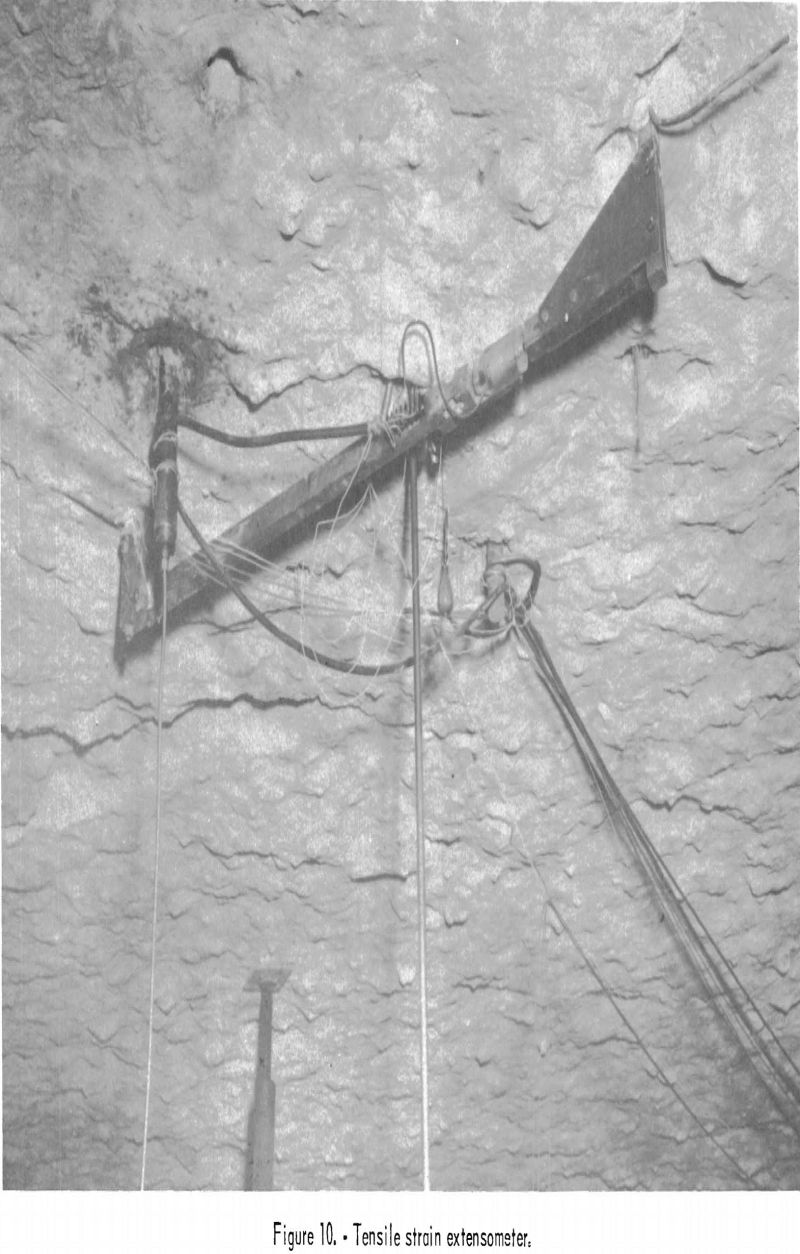
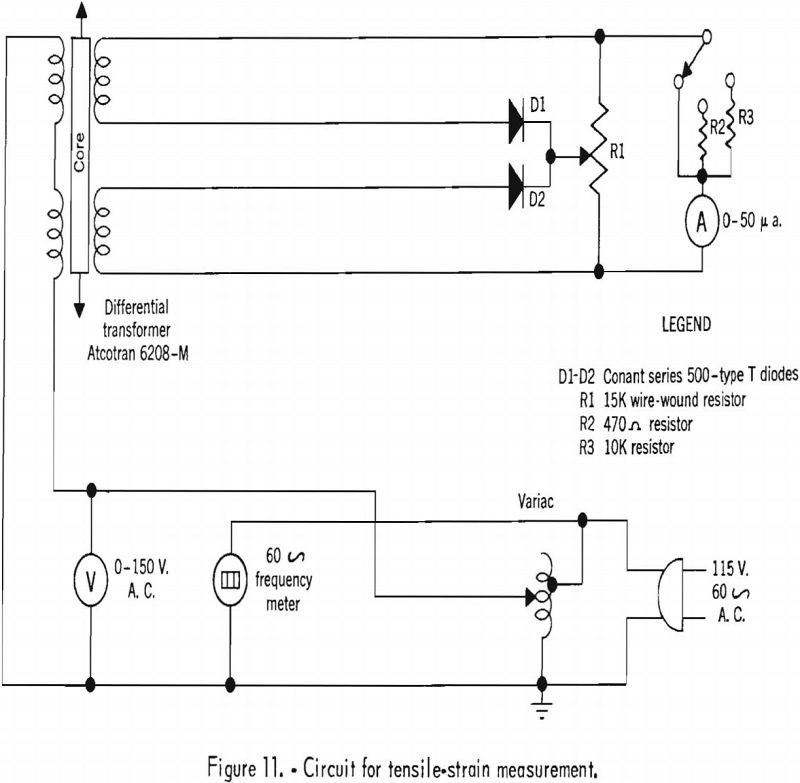
A differential transformer was used to measure the displacement between the two pins. The transformer was mounted on a 1-inch-square, stainless-steel bar suspended from one of the pins; the spring-loaded plunger in the transformer was actuated by a second bar suspended from the other pin (see fig. 10). A schematic diagram of the electrical circuit used with the transformer is shown in figure 11. The estimated accuracy of the measurement of displacement is 0.001 inch.
Measurement of the Micro-Seismic Noise Rate
The micro-seismic method of detecting and recording subaudible noises in a mine roof has been described. Briefly, the method is based on low-amplitude seismic disturbances that rock under stress produces. The number of disturbances per unit of time (noise rate) and the amplitude of the noises increase with the applied stress. Also, ten-fold changes or more in the noise rate have been recorded before failures in roofs or pillars. The micro-seismic equipment consists of a geophone, an amplifier, and a graphic recorder.
It was anticipated that a high noise rate would be measured when the roof layer approached the critical strength of the rock, which, in turn, would be difficult to resolve, owing to the speed of the chart drive in the graphic recorder. Rather than increase the speed of the chart drive, the output of one of the geophones was amplified and recorded with a magnetic tape recorder. The noises were counted by visual examination of the graphic recorder charts and from a playback of the magnetic tapes.
Five geophones were installed near the boundaries of the roof layer (see fig. 3). The geophones near the corner of the room were connected to the micro-seismic equipment; the geophone at the side of the roof layer was connected to the tape recorder.
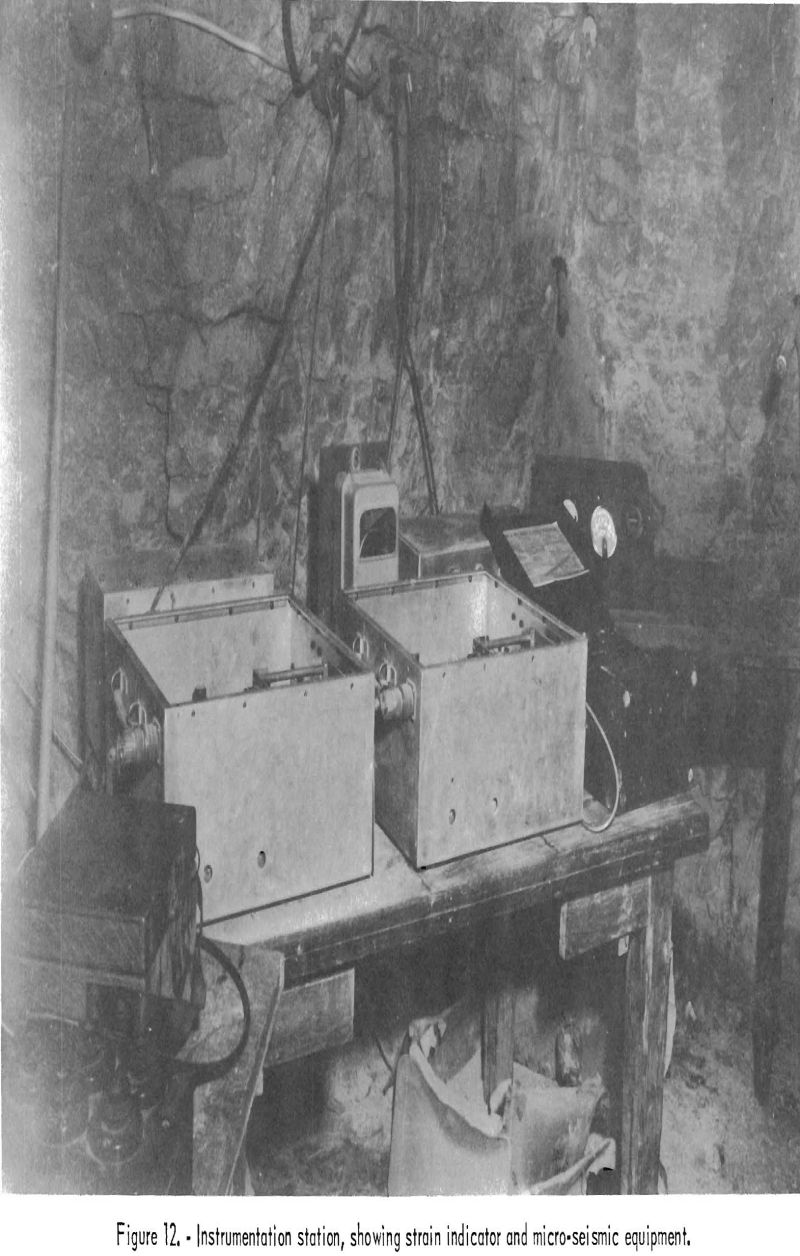
A photograph of the micro-seismic recorders is shown in figure 12.
Procedure and Data
The test procedure was as follows: The air pressure in the separation was gradually increased to and maintained at 3 p.s.i. (at this pressure the air-pressure regulator began to function properly) for about 30 minutes. During this period the sag, differential sag, and tensile strain were measured at regular intervals. About 2 minutes was required to repeat a cycle of readings. Micro-seismic recordings were made continuously (by graphic recorders). The air pressure was not increased until the measurements became stable, that is, until the readings showed no change from one 2-minute interval to the next. The air pressure was then increased to 4 p.s.i., and the readings were repeated. This procedure was repeated until the roof ruptured. The test lasted 212 minutes. Rupture occurred after an air pressure of 9.0 p.s.i. had been maintained on the layer for about 12 minutes. Although the layer did not fall, the number and severity of cracks and fractures in the layer were such that, for all practical purposes, the damage could be considered complete failure.
The following data are presented graphically in figure 13: the average sag at the three sag points, the tensile strain at the center of the roof, the air pressure, and the average micro-seismic noise rate are plotted against time. These data are shown on one graph to illustrate that each change in pressure produced a corresponding change in the sag, strain, and noise rate.
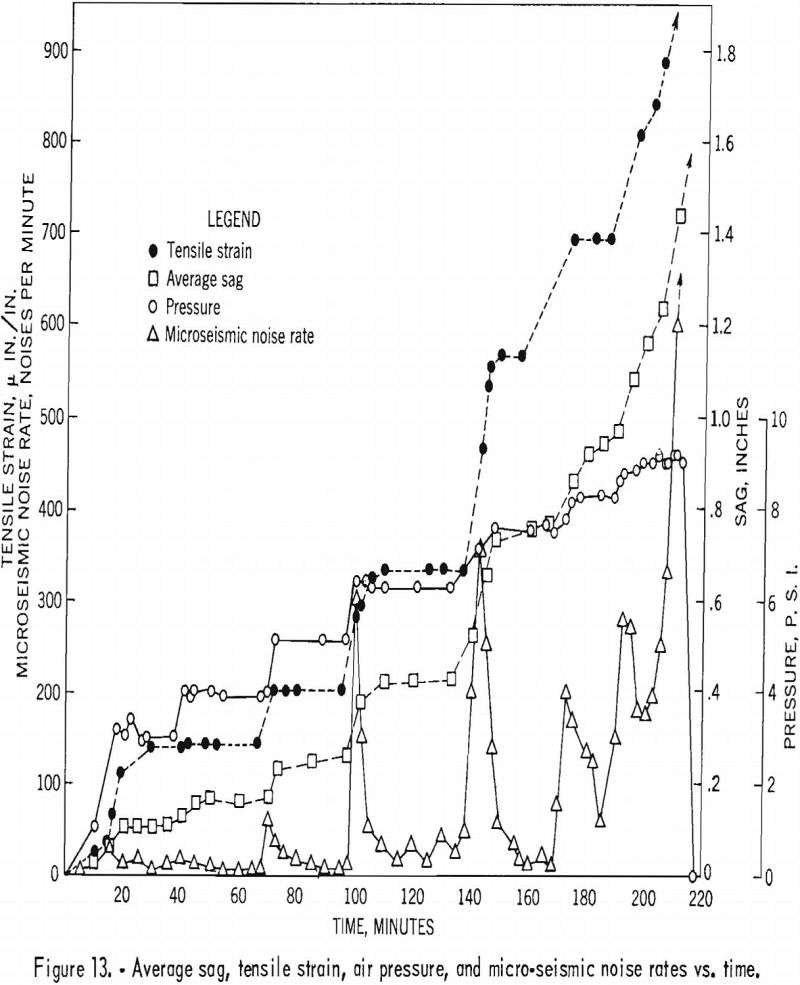
During the first 20 minutes of the test, the air pressure at point P2 was zero (see fig. 3). During the same period identical pressures were indicated at all other points (P1, P3, P4, P5). Thereafter, pressure measurements at all points were the same. It is presumed that the roof layer in the vicinity of point P2 had not separated from the overlying roof until a pressure was indicated at this point.
The sag measured at the 3 sag points agreed within 10 percent of the average. After 200 minutes the sag and strain measurements did not stabilize.
The micro-seismic noise rate after 210 minutes was too high to be resolved on the graphic recorder or the magnetic tape. It is estimated that, at 212 minutes, the noise rate was 1,000 per minute.
As the roof was air-loaded, the differential sags were zero, except at point S2. The differential sag at point S2 was zero up to a pressure of 7.5 p.s.i.; from 7.5 p.s.i. to 9.0 p.s.i. the differential sag was 0.016 inch. After the roof ruptured, the differential sag was 0.094 inch at S2 and 0.048 inch at S1 and S3.
Telescopic observation disclosed no visual indications of failure at pressures below 9.0 p.s.i.; however, occasional audible rock noises were heard after the air pressure in the roof reached 5 p.s.i. The audible noises increased in both number and intensity at higher pressures. Just before the roof ruptured the audible noises could be heard several hundred feet from the room.
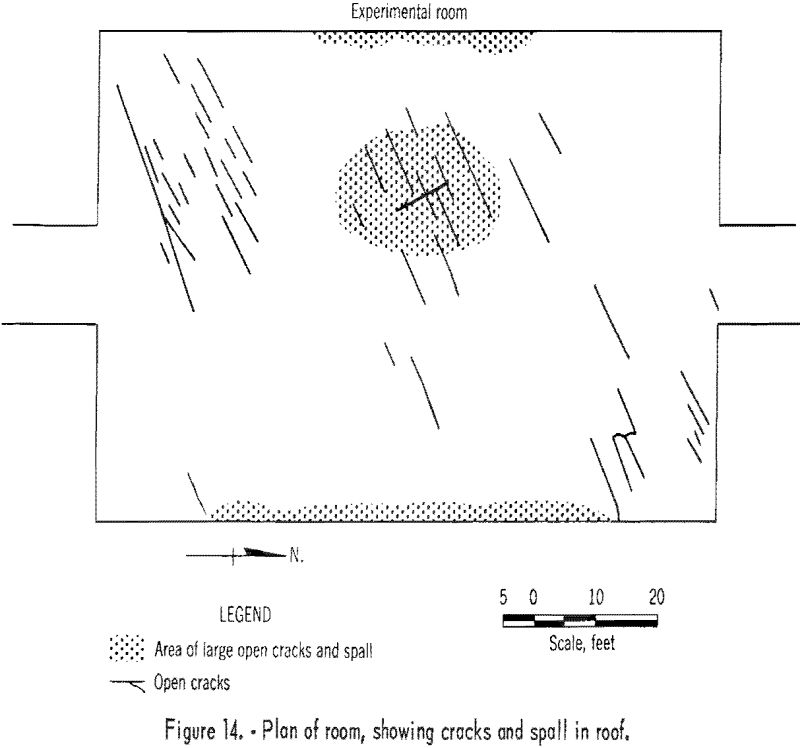
No indications of escaping air were noted (by smoke) until the roof ruptured. At rupture, smoke and/or dust escaped near the center of the roof and along the east and west boundaries of the roof. The surface of the roof was fractured, and some pieces 1 to 6 inches thick and 1 to 5 feet square fell from an area near the center of the room. Rock spall occurred along the boundaries of the room at the junction of the roof and ribs. A plan of the room showing the fractures and areas of spall is shown in figure 14.
Analysis of Data and Conclusions
The relationship between the air pressure and the maximum tensile stresses, calculated from equation (3), are presented in table 2, with the equivalent gravity-loaded roof span required to produce the same stress, as calculated from equation (1). A roof span of 50 feet (600 inches), a roof thickness of 20 inches, and a density of 0.1 pound per cubic inch were used in these calculations. The use of a 50 foot span and a 20-inch thickness is justified later in the report.
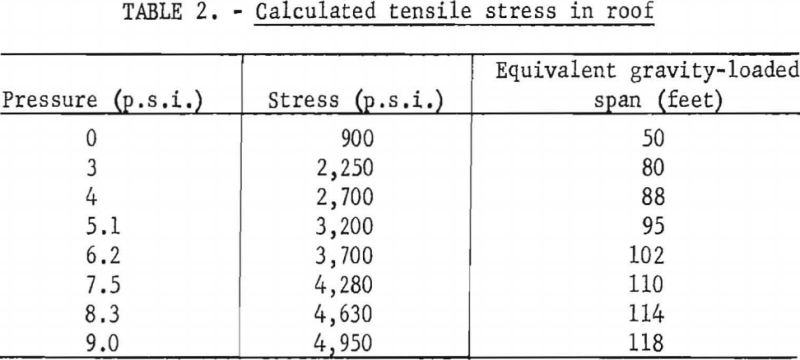
The modulus of rupture (outer fiber tensile strength) and the tensile strength of roof samples measured in the laboratory are 4,650 and 1,190 p.s.i., respectively (see table 1). The computed stress at failure (4,500 p.s.i.) is within 6 percent of the modulus of rupture and about 4 times the tensile strength (see table 2). The agreement between the computed failure stress and the modulus of rupture, and the lack of agreement between computed failure stress and the tensile strength was obtained from the experimental-room studies in the Bureau of Mines Oil-Shale Mine. Virtually the same results were obtained in the preceding study of the 6-inch limestone layer.
The ratio of the calculated stress in-place to the critical stress (at failure) indicates the stability of the roof layer. For a span of 50 feet, this ratio is about 1:5, and it is concluded that the roof was very stable before the test.
Neither the sag nor the change in tensile strain varied in direct proportion to the changes in pressure (see figs. 13 and 15). Thus, from equations (7) and (11), it can be concluded that one or any combination of the quantities – span (L), modulus of elasticity (E) , thickness (t), end conditions – varied during the test. However, the plot of the change in deflection against change in tensile strain is linear (see fig. 16, curve 1). Because the quantity in equation (12) is constant, it can be concluded that the modulus of elasticity of the layer varied.
The stress-strain curves for samples measured in the laboratory are approximately linear. The stress-strain curve for the test in-place (see fig. 15) is not linear. The computed moduli of elasticity of the roof varied from 11 x 10 6 p.s.i. in the pressure range 0 to 5 p.s.i. to 1.8 x 10 6 p.s.i. in the pressure range 6 to 9 p.s.i.
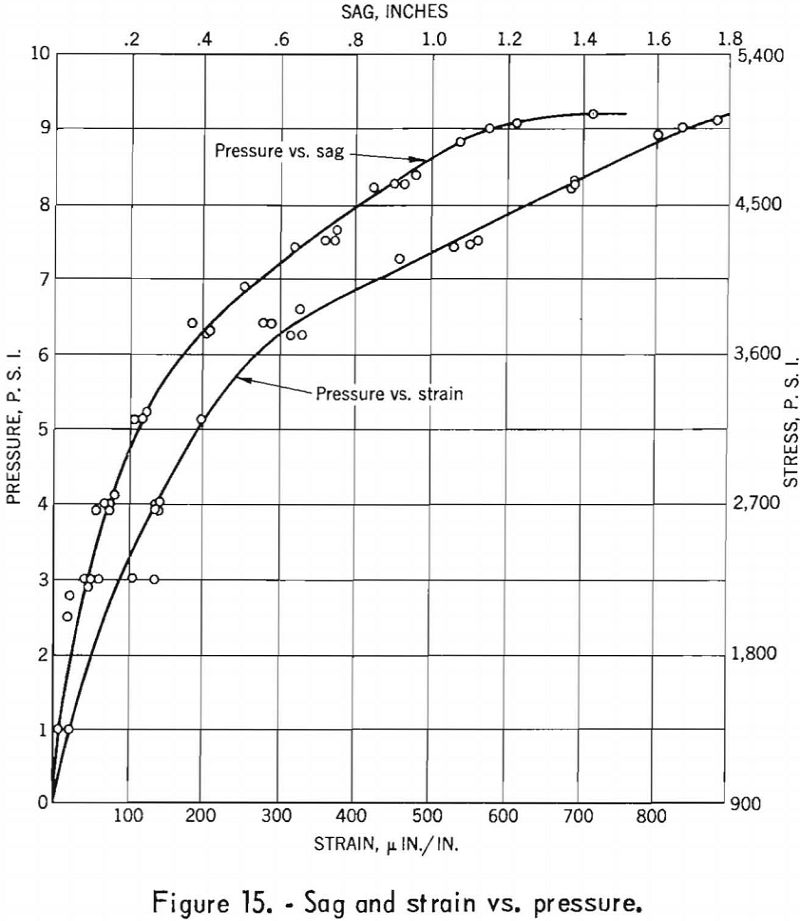
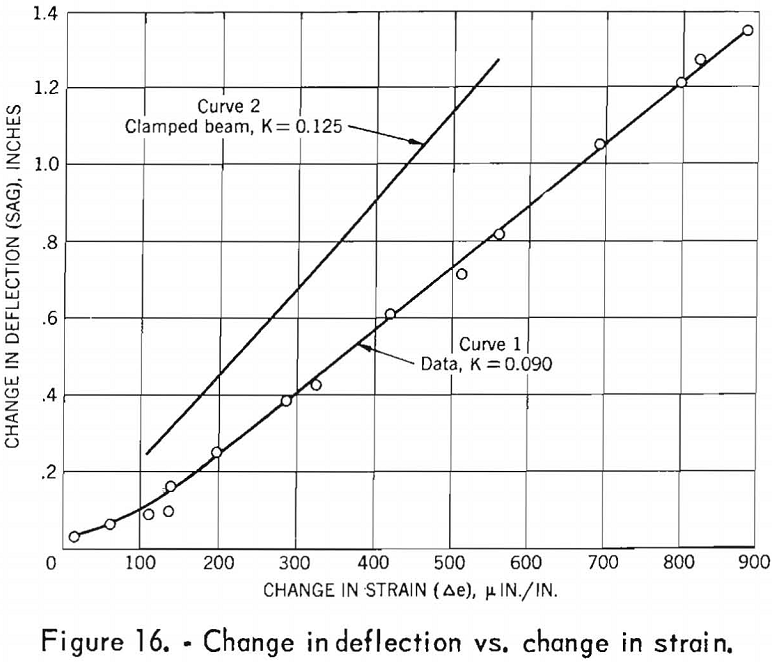
Figure 16 also presents a curve of the calculated ΔD vs. Δe for a clamped beam (curve 2). For a clamped beam the constant K in equation (10) is 0.125; the computed K for the data in place is 0.090. Because K can vary from 0.125 to 0.084 if yielding occurs in the clamps at the ends of the beam, it is concluded that the theory of clamped beams can be used in design equations (3, 4) for roof formations similar to that described herein.
Regarding the values of the roof span (50 feet) used in the foregoing calculations, in the pressure range 0 to 3.0 p.s.i. the span was less than 50 feet because the roof was not detached at point P2. Hence, the calculated stress at 0 p.s.i. (table 2) is presumed to be greater than the value in-place. In the pressure range 3.0 to 9.0 p.s.i. the roof span was constant as indicated by the linear relationship between ΔD and Δe (see fig. 16 and equation (12)). Moreover, the roof span was 50 feet, as indicated by the fractures and escaping air at the ribs when the roof failed. Regarding the value of the roof thickness (20 inches), although differential sag occurred at S2 at 7.5 p.s.i., it can be shown that, because the differential sag did not change in the pressure range 7.5 to 9.0 p.s.i., the sag could only have been caused by a thin slab of small areal extent.
Because the micro-seismic noise rate rose abruptly before the roof ruptured, it is concluded that the micro-seismic method of detecting roof instability should be satisfactory for this limestone.
The method employed in this investigation of increasing the stress by air-pressure loading of the roof layer is not restricted to use in this mine, or to limestone; the method can be applied to underground openings in other rock types when the roof conditions are similar. The method provides for a measure of the maximum roof span without mining the room to the relatively large dimensions required for failure. Because large rooms are not necessary and because no men are required in the room during the test, the method is safer.
