impact-index-equipment-tester zoom

Hover

impact work index test machine zoom

Hover

bond_crushing_work_index_(cwi) zoom

Hover

bond impact crushing work index tester zoom

Hover

impact-index-equipment-tester
impact work index test machine
bond_crushing_work_index_(cwi)
bond impact crushing work index tester
Full Screen

Bond Impact Crushing Work Index Tester

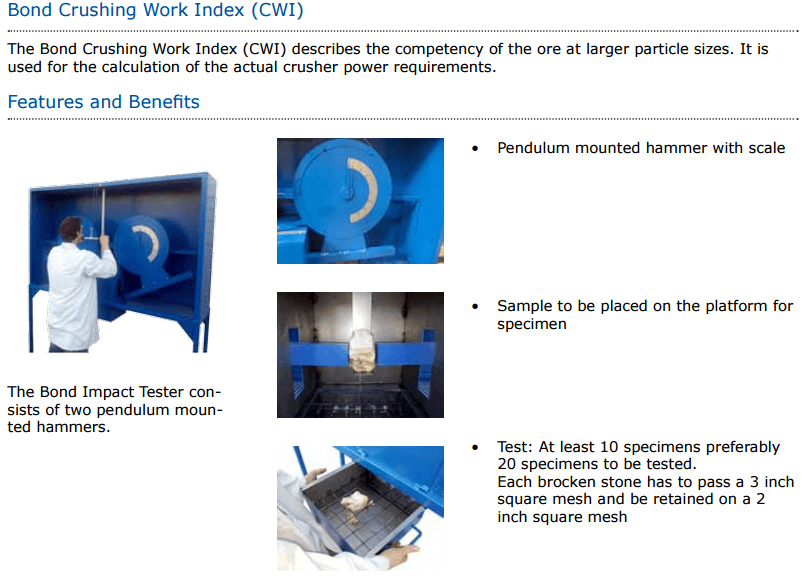
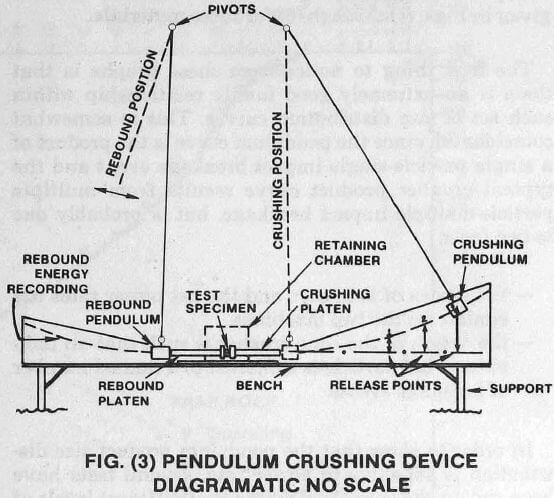
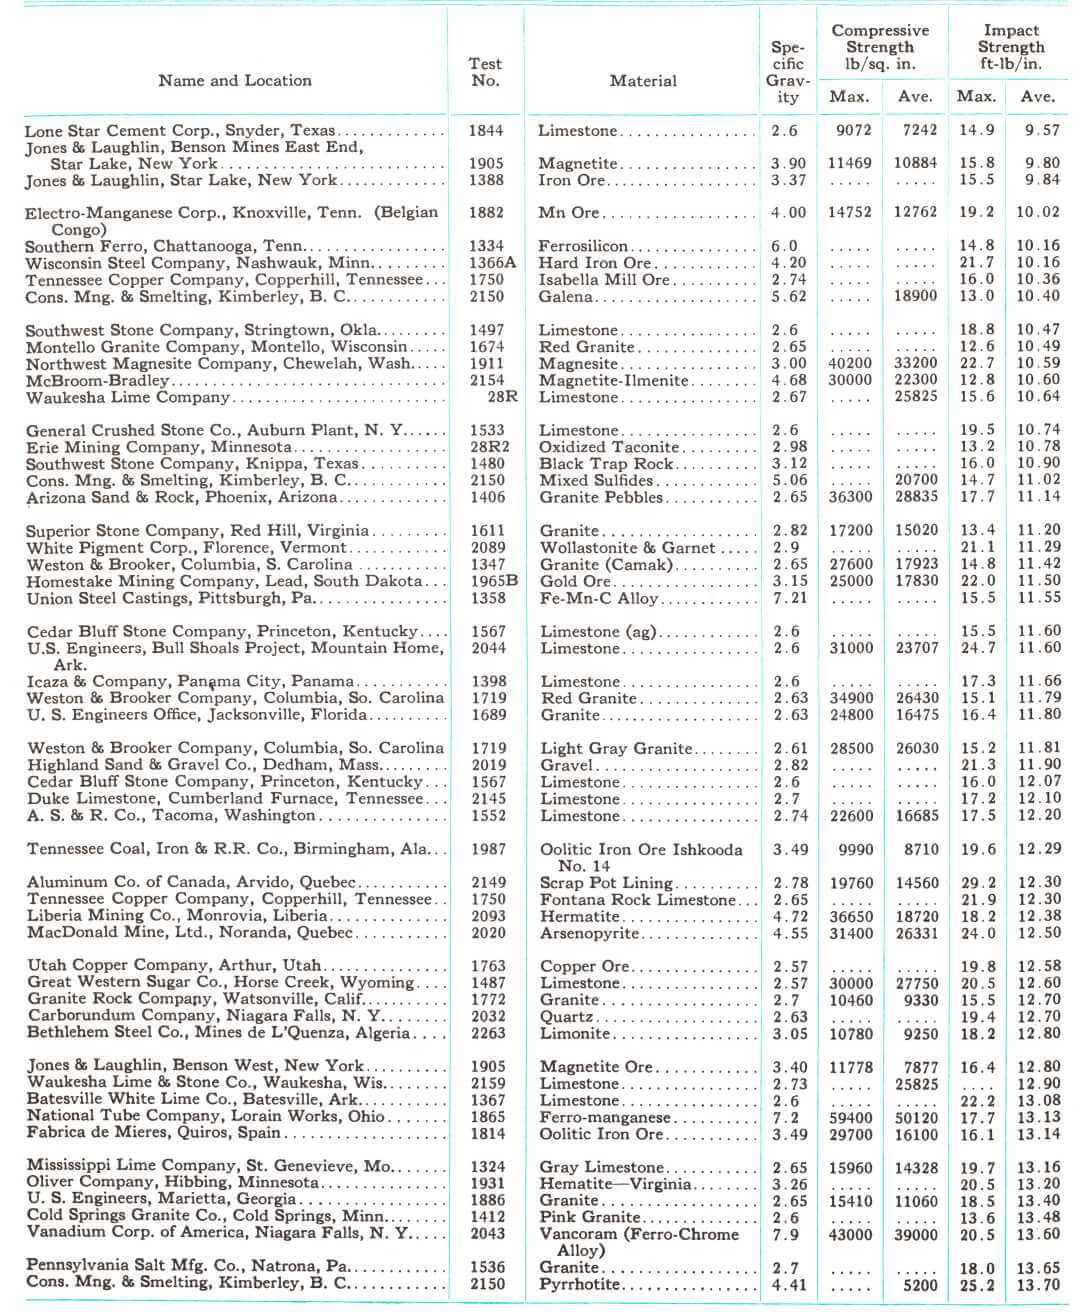
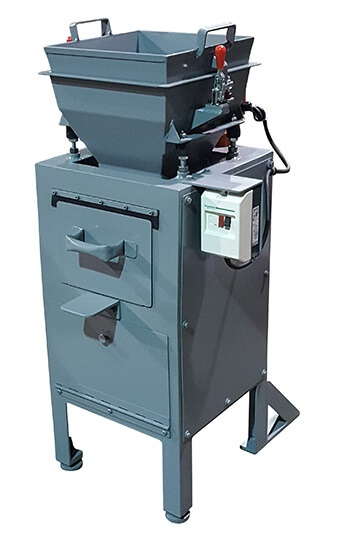
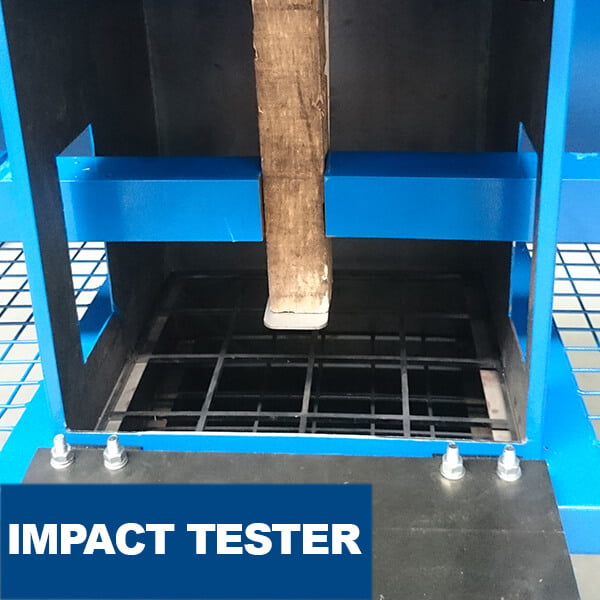
The Pendulum Tester / Bond Impact Crushing Work Index Tester.
Working principle Crushing by impact.
76 mm maximum feed size.
Test repetition: At least 10, preferably 20 test runs.

  • Adjustable crushing angle
  • Repeatable crushing results
  • Safe two-hand operating buttons

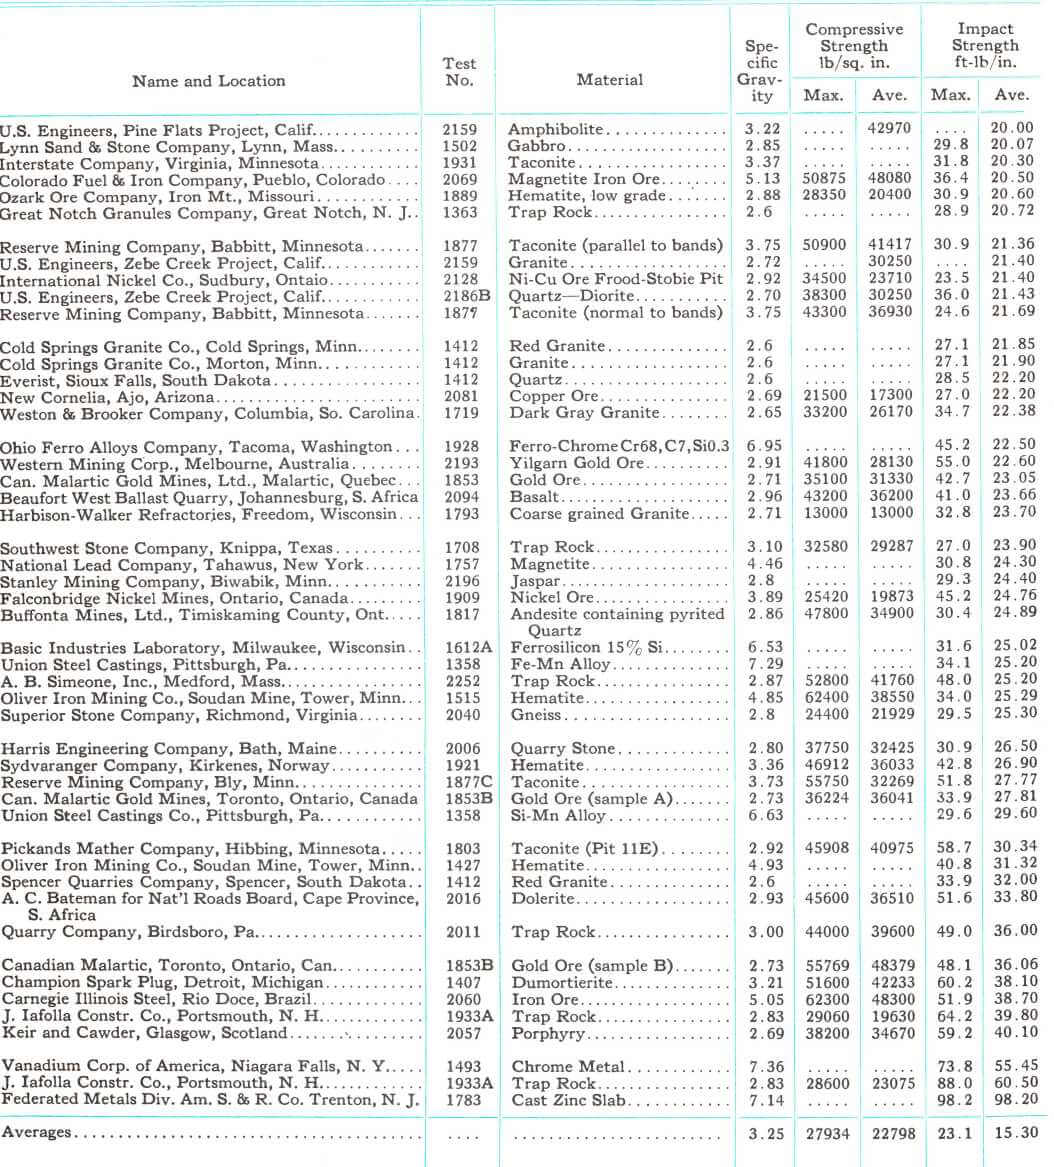
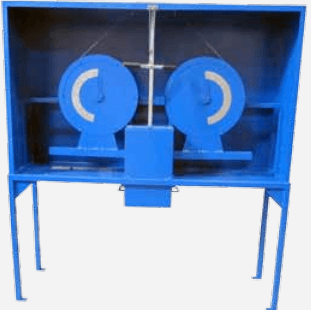
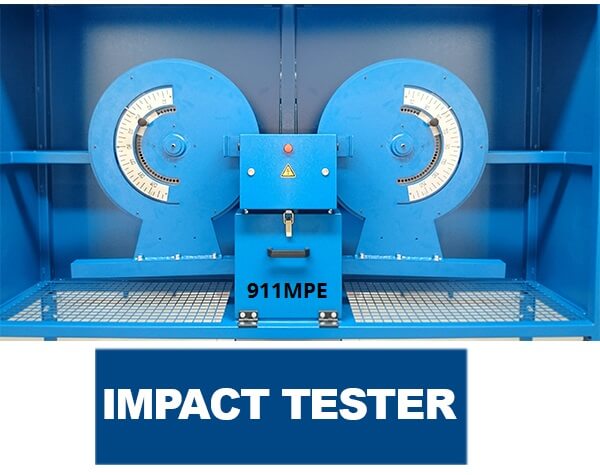
The Bond Crushing Work Index (CWI) describes the competency of the ore at larger particle sizes.europe manufacturer

It is used for the calculation of the actual crusher power requirements.

  • Pendulum mounted hammers with scale.
    -Test: At least 10 specimens preferably 20 specimens to be tested.
  • Each broken stone has to pass a 3-inch square mesh and be retained on a 2-inch square mesh
  • Two hand safety release for the impact hammers
test

Description

bond_impact_crushing_work_index_tester

bond impact crushing work index testerimpact work index test unit


Whilst absolute conclusions cannot be drawn in every instance, the following trends and influences are clearly apparent from the discussion. Further studies in many areas are justified and are still the subject of continuing research programs.

  1. As impact crushing energy is increased, an increasing proportion of finer sizes is produced. In general, the quantity of fines produced is proportional to the applied power rate (KWH/tonne).
  2. A twin pendulum impact crushing device can generate product size distributions similar to those produced in commercial cone crushing operations.
  3. By relating the net energy of pendulum crushing to the total energy in the commercial crusher, a comminution energy efficiency can be obtained for the commercial crusher.
  4. The breakage size distribution obtained in the pendulum, crushing between two flat vertical plattens, is similar to that produced in a cone crusher. The effects of the circular chamber and the claims by some manufacturers that there is a special and most efficient angle to the horizontal for breakage in a cone crushing chamber are not corroborated by this study of fundamentals.
  5. It is a claim for some designs of cone crushers that the eccentric throw has some mystical influence on the capacity and size distribution produced by a particular machine. The pendulum tests supported by field observations prove conclusively that reduction and size distribution of products are simply related to the energy applied to the material. For a fixed application of power, increasing eccentric throw will reduce the force available to crush. This lowers the available power rate and, hence, the reduction ratio. The size distribution appears to be independent of the number of impacts causing this energy application.
  6. The pendulum results prove that the size distribution produced from crushing processes is a natural breakage pattern characteristic of the material and to a lesser extent the mode of breakage.
  7. The size distribution occurring in crushing processes cannot be described by the Gates-Gaudin-Schuhmann log size versus log cumulative percent passing used by Bond or the Rosin-Rammler relationship. There appears to be little correlation in the finer size ranges of products actually occurring and those predicted by such relationships. New mathematical expressions ore needed to define crusher energy size relationships.
  8. This study of fundamentals does not support the statement of some crusher manufacturers that crushers operate inefficiently at higher energy input levels. The production of coarser sizes will be less efficient, should this be the desired product for a process such m crushed stone production, if power rates greater than that required to maximize that coarse size are applied.
  9. Crusher power rate, which is influenced by the geometry and eccentric throw of the crushing chamber as well as the feed size and hardness of the processed material, will determine reduction and size distribution in the crusher product. This product is related to the close side setting only if this is considered to control crushing energy application.
  10. Automatic setting regulation as applied to cone crushers can increase the average power drawn and maximize power rate along with reduction ratio. The phenomena can be studied with the pendulum impact test apparatus.
  11. Crusher productivity in quantities of a fixed size distribution is a function of power drawn as opposed to physical machine size. From the results of the pendulum tests, it is possible to visualize a small machine drawing more power outproducing a larger machine drawing less power.
  12. Energy utilization by crushing and milling machinery is different. As a general conclusion, this is particularly so with rod mills and, to a lesser extent, ball mills. High power rate crushing resulting in increased fines, can bring significant energy conservation to comminution circuits using both forms of breakage. The pendulum test device will allow us to quantify potential gains in the laboratory.
  13. Crushing machines consume less wear metal than grinding mills. This is especially so in the case of rod mills which compete in the fine crushing area. Because wear metal consumption is related to energy consumed to reduce material to a given size, any energy reduction using high power rate crushing will reduce such metal consumption. The pendulum impact test will give a measure of potential gain from this area in the laboratory.
  14. Because the pendulum test can be used to predict the size distribution from cone crushers, finite calculations can now be made for the following parameters, some of which have often been decided by “Rules of Thumb”:
    (a) The number of crusher reduction stages.
    (b) Number of crushing machines and their connected power.
    (c) Circuit loadings.
    (d) Screen requirements.
    (e) Size distribution of plant output.
    This methodology will give more accurate results than designs using standardized capacity tables and product size distribution curves.
  15. The pendulum tester can be used to run tests on drill core sized material so that plant designs can be more accurately formulated from geological exploration data. Pilot plant tests, which are often impractical to run because of the lack of sufficient sample material, are not now a necessity for feasibility and scale-up studies.
  16. The guestimation type comparisons of flow sheets using conventional crushing and grinding processes versus autogenous milling can now be more accurately made. The high power rate crushing process that has been studied here is not normally part of such engineering evaluations. It can now be made so, quickly and relatively inexpensively, by using the pendulum impact device.
  17. As a result of these studies, it is postulated that the current method of running crushing plants at maximum capacity through a given screen size will not minimize energy and wear metal costs in beneficia-tion plants employing downstream grinding mills. Crushing and milling circuit control systems that balance the crushing plant output to the grinding mill capacity will maximize plant capacity at the lowest production cost.
  18. Properly applied, the technology described will reduce the magnitude of the over-design parameters used in most comminution plant design calculations. This should reduce the capital costs of these plants.

Laboratory Crushing Tests on Rocks

Tabulated data presented on the following pages has been compiled from tests made in the Research Laboratory. The impact and compressive strengths of more than 200 different samples from widely different localities are listed. These are a representative cross-section of tests made in the Laboratory for customers in the United States and abroad.

How Impact Crusher Tests are Performed

Ten or more representative pieces of broken stone, each of which passes a square opening three inches on a side and does not pass a two inch square, are selected and broken individually between two 30-lb Pendulum Tester’s hammers. These hammers strike equal blows simultaneously on those opposite sides of the specimen which are separated by the smallest dimension. Hammers hang vertically, with their faces touching the opposite sides of the specimen. Then, the hammers are raised by an equal amount and released simultaneously. This is repeated with successively greater angles of fall until the specimen breaks. Its impact strength is the average foot-pounds of energy represented by the breaking fall divided by the thickness in inches. The average impact strength is the average foot-pounds per inch required to break the ten or more pieces, and the maximum is the foot-pounds per inch required to break the hardest piece, the highest value obtained.

How Rock Unconfined Compressive Strength Is Measured

cone-crusher-testing-machineThe unconfined compressive strengths UCS of many materials have been measured in the Laboratory by cutting samples into one-inch cubes with a diamond disc saw. They are then broken under slow compression in a Southwark compression tester, which indicates the compressive strength in pounds per square inch. Usually four or more cubes are broken and both the average and maximum values are recorded.

The correlation between the compressive strength and the impact crushing strength is inconsistent,
and experience has shown that the impact strength is a better criterion of the actual resistance to crushing. The impact device more nearly approaches actual crusher operation, both in velocity of impact
and in the fact that broken stone is used in testing.

The average impact crushing strength is an indication of the energy required for crushing, while the maximum compression values indicate the danger of crusher breakage and the type of construction necessary. Crusher capacities do not vary greatly with the impact strength; there is a capacity increase
of less than 10 percent from the hardest to the softest stone, where packing is not a factor.

The average impact strength of all materials tested is 15.3 foot-pounds per inch, which is taken to represent average stone. The average of the maximum values of each material is 23.1, which is 151 percent of the average value.

Impact Work Index Tester

cone-crusher-impact-test

LIST COMPRESSIVE STRENGTH OF ROCKS

LIST COMPRESSIVE & IMPACT STRENGTH OF ROCKS - MINERALS - ORE TYPE

LIST IMPACT STRENGTH OF MINERALS

cone-crusher-name

LIST CRUSHING INDEX BY ORE TYPE

cone-crusher-location

LIST CRUSHING INDEX BY Specific Gravity OF ROCK

cone-crusher-averages

Crusher Performance Characterization Test Procedure

The Bond Impact Work Index method has been an industry standard for the determination of crusher power requirements but was originally developed to ensure, that sufficient power was connected to primary gyratory crushers. In this method, pieces of rock are fractured by trial and error in the test device shown in Fig. (2), until sufficient impact energy has been applied to break the rock.

Normally, the rock breaks in halves, and in most tests only two and seldom more than three large pieces are observed after fracture. No size distribution information is used in calculating the Bond Impact Work Index from the formula:

WI = 2.59 Average Impact in ft-lbs/inch/Specific Gravity………………………..(2)

This mode of breakage is similar to that occurring in a primary gyratory crusher where power rates (energy input per tonne of feed) are low (approximately 0.1 KWH/tonne). The procedure works quite well for this type of crusher but tends to understate power requirements in fine crushers where power rates are typically much higher (upwards from 0.25 KWH/tonne).breakage-impact-crushing-test-device

Because of this, a research program was instituted our Comminution Task Force Committee to break rock in a manner more analogous to that observed within commercial fine crushers. A pendulum type test device similar in most respects to that developed by the United States Bureau of Mines and shown diagrammatically in Fig. (3), was built and has been used in an extensive test program to determine whether it would be possible to predict cone crusher performance.

The rock samples selected for crushing in this device are usually minus 38mm (1-½”), plus 19mm (¾”) in size. The sample rock is weighed and then placed between the platens. The end of the rebound platen is placed in contact with the rebound pendulum and the crushing pendulum is raised to a predetermined vertical height which depends on the size of the sample. The crushing pendulum is then released — after striking the crushing platen and breaking the rock, the remaining energy is transferred via the rebound platen to the rebound pendulum. The horizontal distance that the rebound pendulum travels is recorded by displacement of a marker and is subsequently converted to a vertical height.

The energy used in crushing the sample can be approximated from an energy balance of the system:

breakage-impact-crushing-pendulum

Ec = E1 – KE – E2 – EL (Kg—mtrs)……………………………………(3)

where Ec = crushing energy
E1 = crushing pendulum potential energy (before release)
KE = kinetic energy of the two platens
E2 = rebound pendulum maximum potential energy (after crushing)
EL = system energy loss (sound, heat, vibration)

The system energy loss, EL, is determined by plotting EL as a function of the initial height of the crushing pendulum with no rock present. The major portion of this loss is by vibration. It is felt that the difference between system energy losses with and without rock present in the system is minimal as long as enough initial energy is supplied to result in a small elevation of the rebound pendulum.

The fragments from several rock samples broken under identical conditions were combined for each of the size analyses reported in this paper. Bond Work Indices were also back-calculated from the data using the standard formula, i.e.

breakage-impact-crushing-standard-formula

where F80 is defined as the length of the side of the cube of the same weight as the average particle.

Confirmation of the ability of the procedure to provide information suitable for the prediction of crusher performance was obtained by taking feed samples from 31 commercial operations treating a wide range of rocks and ores. At the time of taking a feed sample for laboratory testing in the pendulum device, relevant performance data such as power, feed rate and size distributions for feed and product were taken on the operating crusher. Several thousand rocks have been broken during tests with the device over the past 3 years.

Typical, comparative product size distributions are given in Figs. (4) through (6) for three materials.

The first thing to notice from these graphs is that there is an extremely good family relationship within each set of size distribution curves. This is somewhat coincidental, since the pendulum curve is the product of a single particle-single impact breakage event and the typical crusher product curve results from multiple particle-multiple impact breakage, but is probably due to two facts:

  • the modes of breakage and the net power rates are similar for the two machines
  • the action of the cone crusher is such that an individual feed particle is subjected to a limited number of breakage events

In order to show that the pendulum product size distribution is sensitive to power rate, several tests have been run on the same feed material at different levels of pendulum input energy. Typical results are shown in Fig. (7) as Schuhmann size distribution (log-log) plots. It can be seen that increasing amounts of fine material are produced with increasing energy input. The same effect was previously demonstrated for an operating crusher in Fig. (1). We can, therefore, conclude from this that net power rates will be the same in the pendulum and the crusher when the two distributions coincide (as they do in Figs. (4) thru (6). This permits us to determine the efficiency of power utilization in crushers and to predict the product size distribution which will arise from operating crushers at different power rates.

The Bond Work Index figures obtained by backcalculation from the pendulum data are compared with the Net Work Index values obtained from the plants in Fig. (8). The agreement is surprisingly good especially in view of the fact that the 80% passing values do not completely describe the total feed and product size distributions. This agreement is probably due to the fact that the use of comparable energy levels in both machines gives rise to similar reduction ratios and product size distributions. Because of this, the pendulum test provides a good estimate of the Net Work Index when this is required for current design procedures.

The pendulum product distribution is a breakage function and can be used in models of the process to predict crusher product distributions for different operating conditions. As an example of this approach, Whiten’s model of the cone crusher, Fig. (9), has been used to simulate the situation given in Fig. (4). The result of this simulation is given in Fig. (10) where it can be seen that very good approximations of crusher performance can be obtained.

breakage impact crushing product size distribution granite

breakage impact crushing product size distribution trap rock

breakage impact crushing product size distribution copper ore

breakage impact crushing effect of increasing power rate

breakage impact crushing comparison

breakage impact crushing model of cone crusher

breakage impact crushing cone crusher

The selection (or classification) function used in this simulation was determined by backcalculation. Work is presently underway to quantify this function.

We are firmly of the opinion that results to date prove that the use of this pendulum device can give more energy-size reduction information in a form readily useable for crusher application. The data can be generated in less time and from a much smaller sample than is required for pilot plant testing. Our present pendulum tester is a research tool and is currently being modified for use in commercial testing of minerals and rocks. More details of this device will be given at a later date.

breakage impact crushing

I Need Assistance