Table of Contents
Grinding Circuits
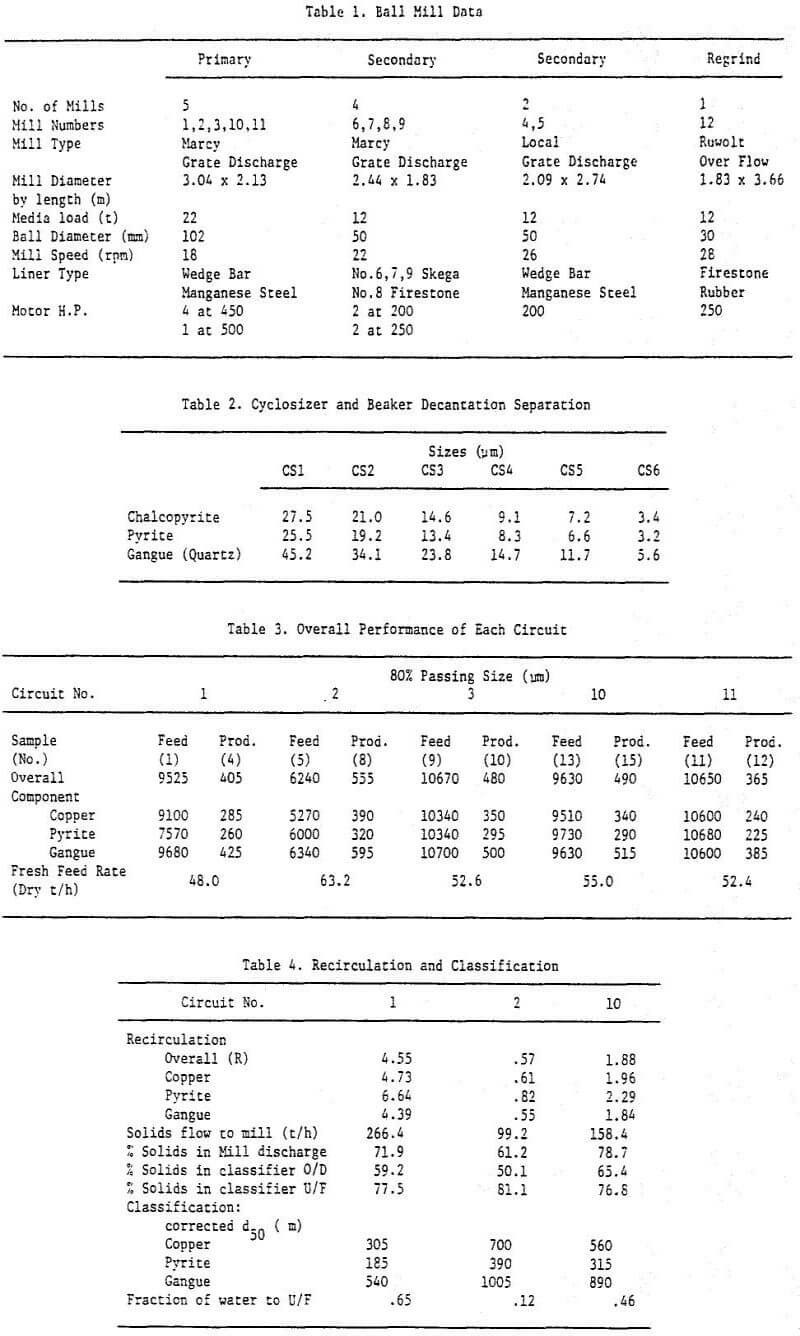
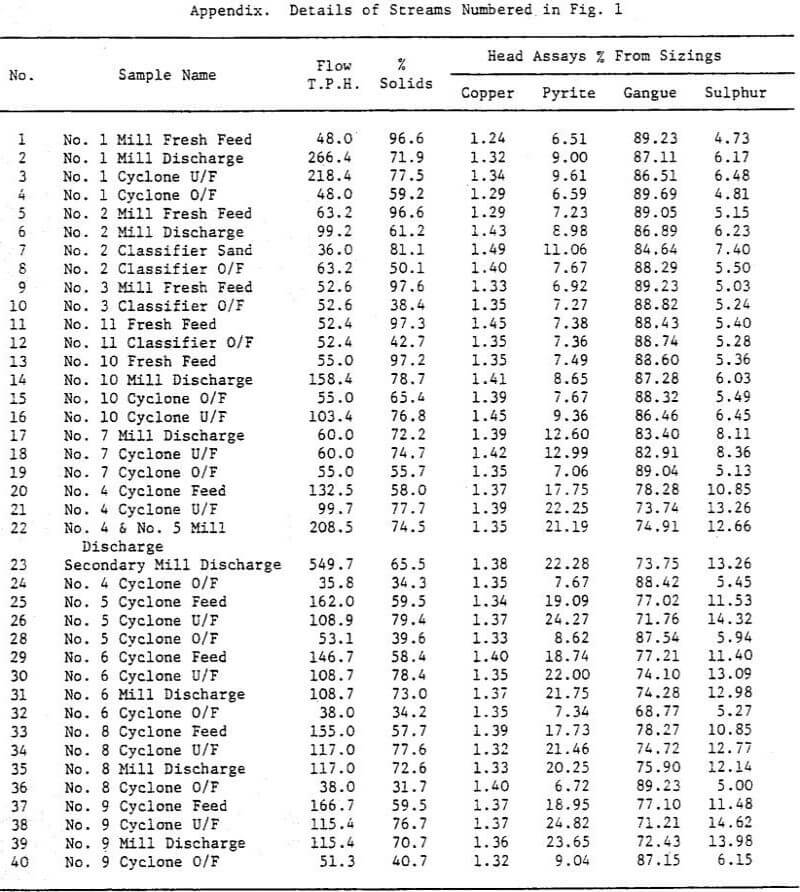
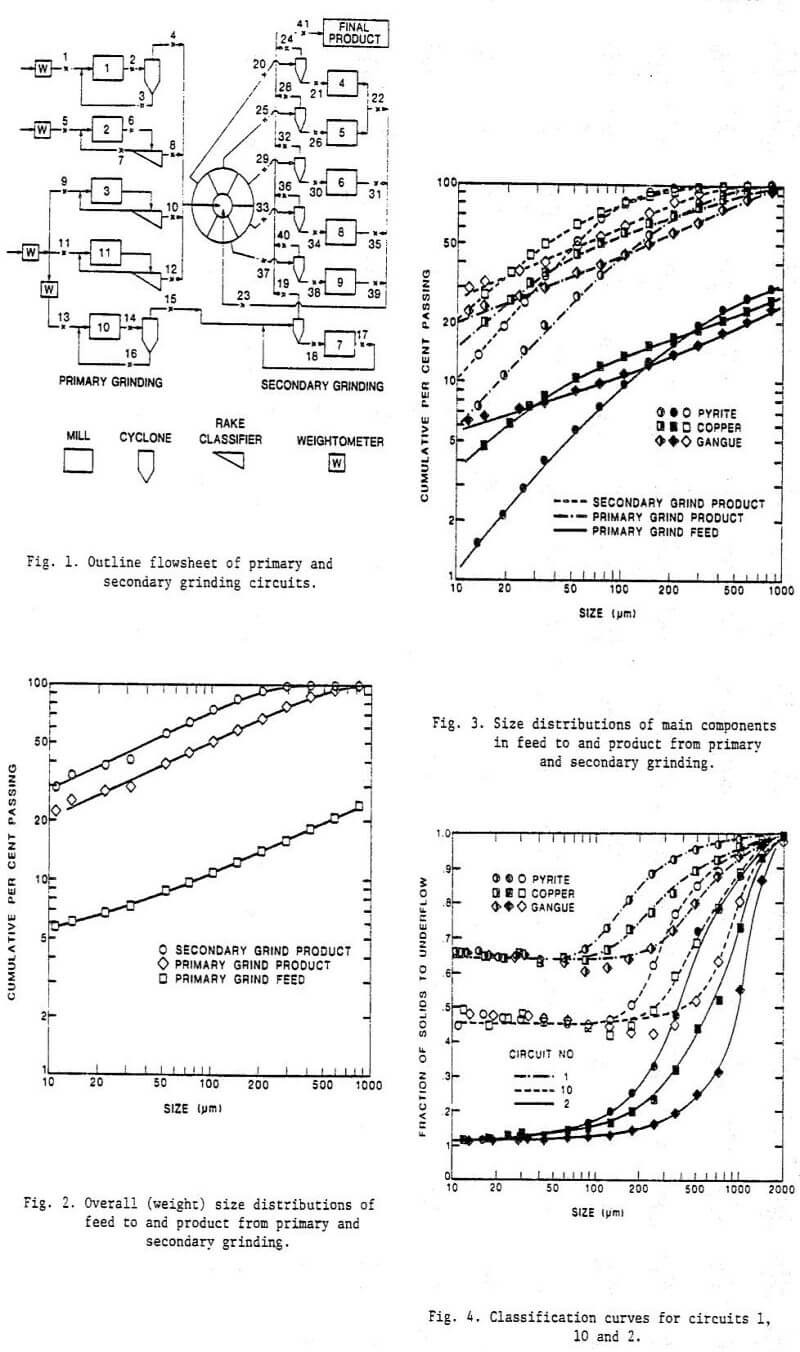
Fine grinding is carried out in five primary circuits, six secondary circuits and one regrind circuit which grinds copper scavenger concentrates and copper cleaner tailings. A diagram of the primary and secondary grinding circuits showing sample points and their identification is given in Fig. 1. Mechanical details of the ball mills are listed in Table 1.
Three of the five primary circuits (Nos. 2, 3 and 11) are closed with quadruplex rake classifiers and the other two with single 508 mm cyclones.
All six secondary circuits are closed with 508 mm cyclones and, under normal circumstances, all are gravity fed from a stationary segmented distributor. A deliberate circuit change was made prior to the survey; No. 7 circuit was removed from the distributor system and fed with the total product from No. 10 primary circuit (see Fig. 1) so that the performance of the distributor system could be compared with a simple primary/secondary arrangement. Fresh feed to the regrind circuit is pumped to three 380 mm cyclones which operate in closed circuit with the regrind mill.
Sampling and sample preparation
For two primary grinding circuits (Nos. 3 and 11) only fresh feed and classifier overflow samples were taken, but for the remainder all streams were sampled.
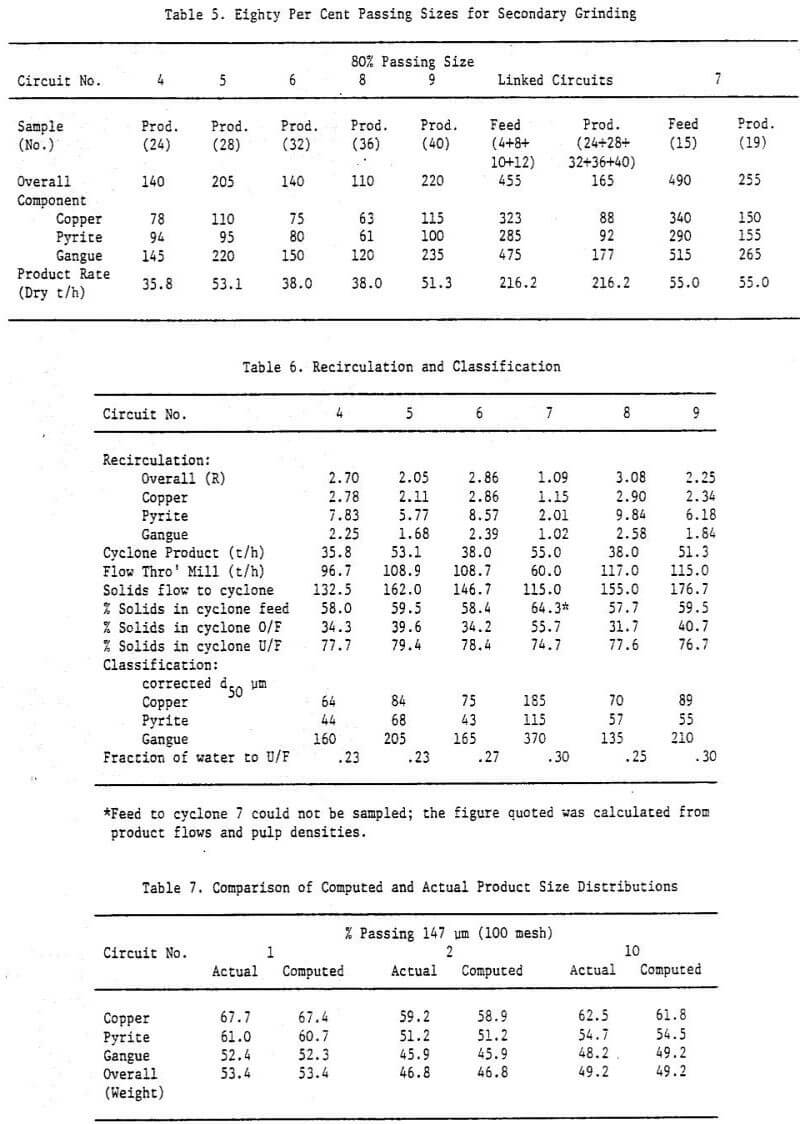
Samples were taken every thirty minutes at each sample point and composited over a five hour sampling period. Sampling methods and sample preparation techniques followed those described earlier. Separation sizes corresponding to chalcopyrite, pyrite and gangue for the sub-sieve sizing procedure are listed in Table 2.
All size fractions from every sample were assayed for copper, sulphur and iron and the pyrite content was estimated by assuming that all the sulphur was present either as chalcopyrite or pyrite, that the sulphur to copper ratio in chalcopyrite was 1.01 and that pyrite contained 53.3% sulphur. Thus
Pyrite % = (S% – 1.01 Cu%)/.533
A “gangue” assay was estimated by assuming that all copper was present as chalcopyrite assaying 34.6% copper:
Gangue % = 100 – Pyrite % – Cu%/.346
The fresh feed rate of wet ore to the concentrator was determined from the weightometers shown in Fig. 1. The ore split between circuits 3 and 11 could not be determined so it was assumed to be an equal split on a wet basis. The split of primary grinding product amongst the five secondary mills in the distributor system was determined by measuring the relative flows of secondary cyclone overflows. The remaining flows (i.e. the circulating loads) were calculated from overall or weight size distributions by a procedure similar to that recommended. Size by size mass balances for weight were excellent in all circuits, but in the primary grinding section some minor discrepancies between calculated head assays for individual feed and product streams were recorded. It was assumed that product streams were likely to have been sampled more accurately than the coarse feed streams, so final product assays were used in all calculations. Component mass balances calculated on this basis were quite satisfactory.
Overall Performance
The overall (weight) size distributions of the total fresh feed (Samples 1+5+9+11+13), primary grinding product (4+8+10+12+15) and secondary grinding product (19+24+28+32+36+40) are plotted in Fig. 2 and the corresponding distributions for copper, pyrite and gangue are shown in Fig. 3.
Primary Grinding
Overall performance
The size reduction achieved by each circuit is summarized in Table 3 where the 80% passing sizes overall and for the main components in the fresh feed and final product streams are listed together with the feed rates of dry ore.
Recirculation and Classification: The circulating load ratios for circuits 1, 2 and 10 are compared in Table 4 together with the recirculation factors for each component. Recirculation factors for pyrite were appreciably higher than the overall circulation (R) indicating a significant build-up of pyrite in the circulating load.
The size by size classification curves for copper, pyrite and gangue in the three circuits are shown in Fig. 4, and a summary of the classification data is given in Table 4.
The classification curves show the expected specific gravity effects with pyrite having the lowest corrected d50, then copper (chalcopyrite) and gangue. The curves also show the usual inefficiencies at both coarse and fine ends; thus even in circuit 1 where the corrected d50 was finest, some particles in the size range -1641+1168 µm were present in the overflow stream. The rake classifier was much more efficient than the cyclones at fine sizes but this was achieved with a very coarse cut and low circulating load ratio.
It is apparent from the data of Table 4 that the classifiers (cyclone or rake classifier) were operated quite differently in each circuit and these differences would have contributed to the spread in product size distributions evident in Table 2.
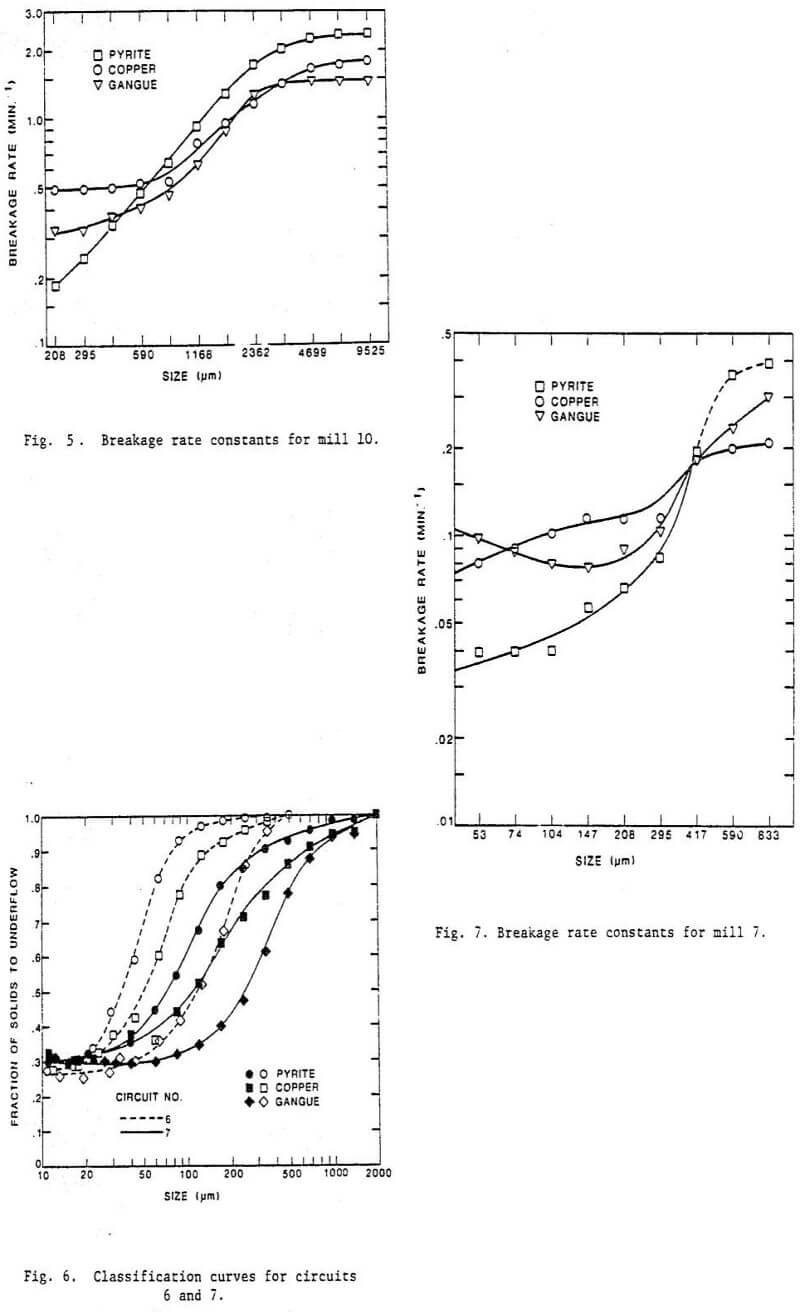
Breakage: Using a dynamic model of breakage a suitable breakage function, a mean residence time referred to a hold-up of 5 tonnes of solids in each mill and by representing the distribution of residence time by one large and two small perfect mixers, breakage rate constants were calculated for each size fraction of each species from the size distributions of copper, pyrite and gangue in the mill feed and discharge, and those for mill 10 are shown in Fig. 5. Breakage rate constants were fairly similar for all three mills, the largest difference being for mill 1 where rates for all components were lower for sizes coarser than 2362 µm.
Breakage rates for all components in all mills started to decrease at about 2362 µm thus between 60 and 70% of the fresh feed was broken at maximum breakage rates (except in circuit 2 where the feed was substantially finer). Above 833 µm breakage rates for pyrite were higher than copper or gangue but below 833 µm breakage rates for pyrite were lower. Breakage rates for copper and gangue were similar for sizes coarser than 1651 µm but at finer sizes those for copper were somewhat higher.
Secondary Grinding
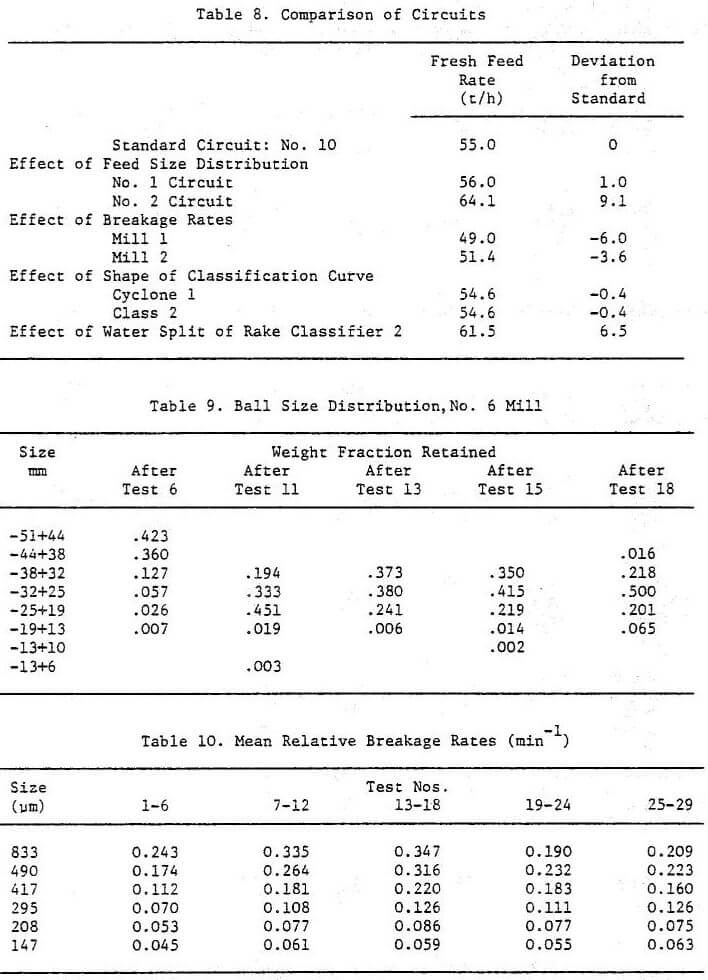
Overall performance: One object of the survey was to compare the performance of one secondary mill (No. 7) receiving all the product from one primary mill with the performance of the five remaining mills receiving feed from four primary mills via the distributor system shown in Fig. 1. In Table 5, the 80% passing sizes of the six secondary circuit products are listed together with the 80% passing sizes of the fresh feed to the distributor system, the total product from the distributor system and the fresh feed to circuit 7. Cyclone overflow solids flow rates are also included.
Recirculation and Classification: Recirculation in all secondary circuits is listed in Table 6. As for the primary circuits, the recirculation factors for pyrite were substantially higher than the circulating load ratio (R) indicating a significant build-up of pyrite in the circulating load.
The distribution of circuit feed from the distributor was poor as shown by line 7 in Table 6, with circuit 4 receiving 132.5 t/h compared with the 167.7 t/h received by circuit 9, and this poor distribution may in part account for the rather different size distributions produced by each circuit.
The range of corrected d50 values for the cyclone fed from the distributor (Nos. 4, 5, 6, 8 and 9) was approximately one √2 screen size and variations within that range are consistent with pulp density variations between cyclone feeds. All five cyclones were operated at much finer corrected d50 values than cyclone No. 7 which was fed directly from primary circuit No. 10. The corrected d50 values for copper and pyrite for cyclone 7 were more than two √2 screen sizes coarser than those for the coarsest distributor- fed cyclone (No. 9) and that for gangue was more than one and a half √2 screen sizes coarser. The comparatively high density of the feed to cyclone 7 would largely account for this difference.
The shape of the component classification curves for secondary cyclones is shown in Fig. 6 where curves for cyclones with the coarsest (No. 7) and finest (No. 8) separation sizes are plotted.
Breakage
Size by size breakage rate constants relative to a hold-up of 5 tonnes of solids were calculated for all components for all secondary mills and typical values for No. 7 mill are shown in Fig. 7. The most important point to be noted is that values for copper and gangue in the size range 104 to 417 µm (where most breakage should occur) were from 150 to 300 percent lower in the secondary mills than in the primary mills.
Simulation
In order to assess the effects of the differences in mill breakage rates, cyclone and rake classifier performances, and fresh feed size distributions on overall circuit performance, simulated grinds were carried out on a digital computer using the flow, classification and breakage rate data obtained from the survey. The ball mills were modelled by the time-continuous, size-discrete form of the grinding equations in which residence time distributions were represented by one large and two small perfect mixers in series. Both types of classifier were represented by the component classifier curves corrected for solids carried unselectively with water to the underflow or sands product. The actual curves were back- calculated by assuming that the ratio of overflow to underflow pulp densities remained constant. This assumption kept the corrected d50 constant but allowed the fraction of water reporting to the underflow to vary with circulating load ratio.
Primary Grinding
Simulation of Experimental Conditions: To check the reliability of model parameters, circuits 1, 2 and 10 were simulated using actual feed rates and feed size distributions. The agreement between actual and computed product size distributions was excellent (see Table 7).
Comparison of Circuits: To compare circuit performances, No. 10 circuit was selected as the standard and the separate effects of feed size distribution, breakage rates, and classifier performance were investigated by replacing any one set on these parameters in the circuit 10, simulation by the corresponding set from circuit 1 or 2. For each simulation the total flow through mill 10 was held constant at 158.4 tonne/h and the classification curves were adjusted coarser of finer (i.e. corrected d50 altered) until 75.3% of the total overflow solids passed 417 µm. Thus with the circuits yielding similar product size distributions, the effects of changes in each variable were reflected in fresh feed rate alone. The results are listed in Table 8.
Breakage rates are to some extent a function of the mechanical and operational state of the mill hence the differences noted above may be due in part to differences in ball load, liner wear, pulp density of the mill hold-up, etc., and they could also reflect genuine differences in the hardness of the ore as each circuit received ore from different bins.
The shapes of the corrected classification curves for the two cyclones and the rake classifier were virtually identical despite large differences in operation at the time of the test.
The better performance of the rake classifier was due entirely to its ability to make a drier sand product, thus had it been used in circuit 10 with the same water split as it achieved in circuit 2 but with a high enough circulating load ratio to produce the same product as circuit 10, 6.5 tonne/h extra fresh feed could have been ground.
Feed size distribution is shown to have a marked effect on circuit capacity; thus, had the substantially finer feed to circuit 2 been ground in circuit 10, the throughput of that circuit could have been 9.1 tonne/h higher for the same product size distribution.
Maximum tonnage
The flow achieved in circuit 1 suggests that the mills are capable of handling flows of 250 t/h of solids and comparison with mills of comparable size at other concentrators supports this inference. Assuming all mills could be operated with this flow, it was estimated by simulation that the primary mills could grind 293 t/h to 80% passing 417 µm i. e. the primary circuits were operating about 8% below maximum capacity at the time of the test.
In secondary grinding a desirable objective is to provide an environment in which the coarsest particles will break at rates at least as high or higher than those obtained in primary grinding. Kelsall, Reid and Restarick (1970) have shown that, as the particle size is reduced, smaller balls must be used to obtain maximum breakage rates. The use of two-stage grinding provides the opportunity to optimise ball size in the secondary mills to maintain high breakage rates at smaller sizes.
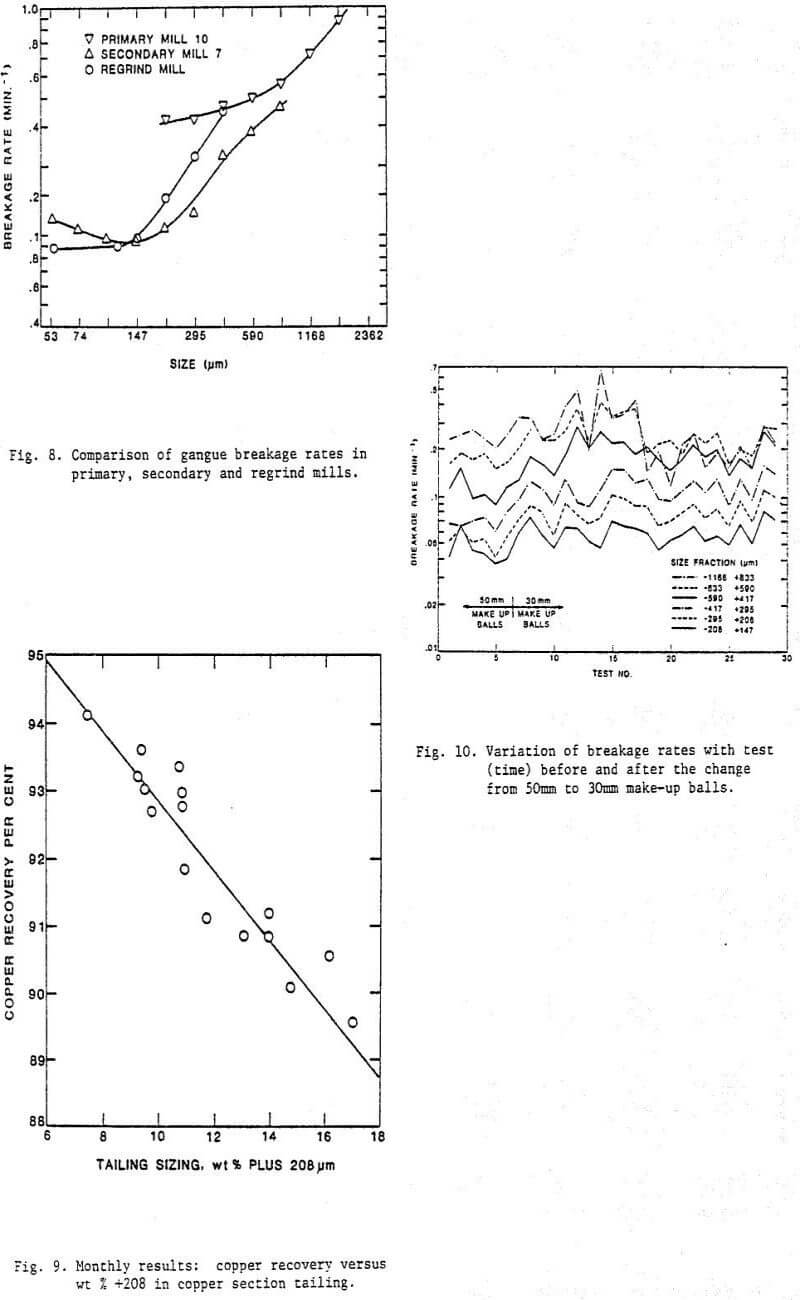
Relative breakage rates for gangue in primary (No. 10), secondary (No. 7) and regrind (No. 12) circuits are compared in Fig. 8. Values for the secondary mill have been increased by 20% to allow for the fact that there were six secondary mills but only five primary mills. The outstanding feature of these data is that the gangue particles in the coarsest range seen by the secondary circuit (-1168+147 µm) are broken at the lowest rates in the secondary circuit. Part of the difference between circuits can be attributed to different mill volumes, but the regrind mill has a smaller volume than 1.20 secondary mills, therefore other reasons must be sought for the higher breakage rates. As all ore reporting to regrind had been floated the gangue (42% of regrind mill feed) may be somewhat softer than total gangue, but a more plausible explanation is that the 30 mm balls in the regrind mill were more effective than 50 mm balls for reducing particles in this size range.
Effect of Grind on Flotation Performance
From February onwards the average monthly flotation feed size distribution was monitored at varying feed rates to see if a sustained effect on flotation could be detected. Data for 17 monthly periods are presented in Fig. 9 where copper recovery is shown to be strongly negatively correlated with the weight % plus 208 µm material in copper flotation tailing. Composition of the ore over this period was unchanged, and grade was maintained constant. These data provide quantitative evidence of the improvement likely to be obtained by finer grinding.
Primary Grinding
An attempt was made to add more water to the classifier feed streams to increase circulating loads, but the secondary circuit distributor could not handle the increased pulp flow thereby effectively limiting capacity to little more than that achieved during the plant survey.
Secondary Grinding
The ball load in No. 6 mill was sampled and found to be very deficient in balls smaller than 32 mm.
Experimental
Steady state sampling tests on the No. 6 secondary circuit were carried out over a period of several weeks to establish a base performance with 50 mm balls. After six tests, 30 mm balls were added as the daily make-up over a period of five months, and steady state tests lasting several hours were carried out weekly; in all a further 23 tests were performed. Samples were sized down to 38 µm but not assayed. Final product flow rates were measured by filling a calibrated tonnage box. The-ball load was sampled and sized several times during the test period.
Ball Size Distribution
The results are listed in Table 9 and show that a substantial change in size distribution had been achieved by test 11 and the new distribution was maintained until test 18. Measurements were discontinued beyond test 18 partly because a fairly stable load had been achieved, and partly because some 50 mm balls were inadvertently added from time to time over the remainder of the period.
Circuit Performances
Flow, classification and breakage parameters were evaluated for all tests, but for the present purposes, relative breakage rates are the only relevant parameters. In Fig. 10, breakage rates for the coarsest six sizes are plotted for all tests. Despite some scatter it is clear that breakage rates rose significantly after 30 mm balls began to be added (i.e. after test 6). This observation is confirmed in Table 10 where the mean values for tests 1-6, 7-12, 13-18, 19-24 and 25-29 are listed for the six sizes. The tendency for values to fall after test 18 may be due to the presence of some larger balls again. Under the best conditions (tests 13-18) the overall average breakage rates increased by about 70%.
Simulation
An estimate of the change in flotation feed size distribution likely to be achieved if all secondary mills were loaded with 30 mm balls was made as follows. Mean breakage rates (k) for tests 1-6 (50 mm balls) and tests 13-18 (maximum effect of 30 mm balls) were calculated and the ratios k30/k50 for each size fraction were applied to the breakage rates determined for all mills in the original survey and the whole secondary circuit was simulated with a general purpose flowsheet simulator. A recent sample of fresh secondary circuit feed had been sized and the size fractions assayed for copper and sulphur so that current component size distributions could be used in the simulation.
The simulations predicted that the weight of solids in the plus 208 µm fraction would be reduced by about 4% and the weight % of copper in the plus 104 µm fraction would also be reduced by 4% from about 14 to 10%. From the recovery versus tailing size data of Fig. 9 it was estimated that a change to 30 mm balls was likely to improve copper recovery by 2% which, after allowing for additional costs, would represent a net 1% gain in revenue.