The present investigation of the low-temperature heat capacities and high-temperature enthalpies of synthetic cuprous sulfide and cupric sulfide is one in a series of thermodynamic studies by the Bureau of Mines on metallurgically important copper compounds. Despite the importance of cuprous and cupric sulfides in the processing of copper, thermodynamic data for these substances are either incomplete or inadequate. Such thermodynamic properties are essential for more efficient extraction of copper from sulfide ores by roasting, and for the control of sulfur oxide pollutants that are formed during the roasting process. Thus, the thermodynamic data would foster maximum productivity and minimum energy requirements in the processing of copper and related substances.
In this investigation, low-temperature heat capacities were measured with an adiabatic calorimeter, and high-temperature enthalpies with a drop calorimeter incorporating a copper block. Results from these calorimeters were combined with heats of formation at 298.15 K from the literature to provide tabulated values of the principal thermodynamic properties for cuprous sulfide (Cu2S) and cupric sulfide (CuS).
This study of CuS (covellite) was undertaken: (1) To extend the low-temperature heat capacities of Anderson below 56 to near 0 K, and (2) to measure high-temperature enthalpies.
Thermodynamic studies on Cu2S (chalcocite) were undertaken: (1) To extend Anderson’s low-temperature data below 56 to near 0 K; (2) to extend the heat capacity values reported by Kubaschewski and by Jost and Kubaschewski above 823 K; (3) to measure high-temperature enthalpies, because values calculated by Kelley from 350 to 1,400 K were based on the incomplete and scattered data reported by Bellati and Lussana in 1888-89 for temperature between 273 and 463 K, by Bornemann and Hengstenberg in 1920 for the range 273 to 1,373 K, and by White in 1933 for 303 to 1,173 K; and to measure enthalpies of the liquid state.
The present investigation established a transition temperature of 720 K for Cu2S, which markedly differs from 623 K calculated by Kelley from the scattered data of investigators given previously. The transition temperatures of 376, 720, and 1,400 K of Cu2S from the present investigation are in agreement with phase equilibria and thermodynamic studies reported in references listed later. Because such studies on copper sulfides have received considerable attention in recent years from scientists of different disciplines, publications related to phase transitions are widely dispersed in the literature of various fields. While it is beyond the scope of this paper to list all authors who have done work on Cu2S and CuS, a listing of some publications provides a guide to the literature for locating original investigators. These references are King, Mah, and Pankratz, Craig and Scott, Roseboom, Yund and Kullerud, Hansen and Anderko, and supplements to the last by Elliott, and Shunk.
In recent investigations of thermodynamic properties of copper compounds by the Bureau of Mines, Stuve, Richardson, and King measured low-temperature heat capacities and the standard enthalpy of formation of copper oxysulfate; Ko and Richardson reported standard enthalpies of formation for cupric and cuprous bromides; Richardson and Brown provided the enthalpy of formation for malachite; Ferrante measured the high-temperature enthalpies of copper sulfate and oxysulfate; Taylor, Brown, and Taylor obtained the heat of formation and low-temperature heat capacities of cuprous cyanide; Pankratz and King investigated enthalpies above 298.15 K for chalcopyrite and bornite; Mah, Pankratz, Weller, and King provided heat capacities, enthalpies, enthalpies of formation, and Gibbs energies of formation for cuprous and cupric oxides; Adami and King reported the heat of formation for anhydrous copper sulfate; Weller measured the low-temperature heat capacities of anhydrous copper sulfate; and Barany, Pankratz, and Weller investigated the low-temperature heat capacities, high-temperature enthalpies, and standard enthalpies of formation of cuprous and cupric ferrites. In addition, a monograph on the thermodynamic properties of copper and its inorganic compounds was compiled by King, Mah, and Pankratz.
Materials
Synthetic Cu2S was prepared by reacting copper with appropriate amounts of sublimed sulfur. The copper was freshly prepared in the form of powder by converting a plate of 99.999 pct purity to cupric oxide powder, followed by hydrogen reduction at 800° C. The copper and sulfur were sealed in an evacuated Vycor bulb and heated at 285° C for 1 day, and 685° C for 5 days. This product was ground, screened, analyzed, and adjusted for composition. The same heating cycle was then repeated. Chemical analyses of the sample showed 79.79 pct copper and 20.20 pct sulfur, compared with the theoretical 79.85 pct copper and 20.15 pct sulfur. Optical emission spectroscopy revealed that the sample contained less than 0.01 pct metallic impurities. An X-ray diffraction pattern of the product matched that given in the ASTM Catalog of X-ray Powder Data for orthohombic Cu2S, which Evans recently showed actually has a complicated monoclinic structure.
Synthetic CuS was prepared in the same manner as described for Cu2S except for heating cycles. Reactants were heated at 285° C for 1 day, 500° C for 2 days, and 400° C for 6 days. After analyses, the composition of the product was adjusted and the same heating cycle repeated. Final chemical analyses showed 66.43 pct copper and 33.50 pct sulfur compared with the theoretical 66.46 pct copper and 33.54 pct sulfur. No metallic impurities were detected by optical emission spectroscopy. The X-ray diffraction pattern agreed with that given in the ASTM catalog for hexagonal CuS.
Experimental Work and Results
Results of measurements from calorimetric investigations are expressed in terms of the thermochemical calorie (1 calorie = 4.1840 joules). Temperatures refer to the International Practical Temperature Scale of 1968. Weighings were corrected to vacuum. The 1973 Table of Atomic Weights gave molecular weights of 159.152 for Cu2S and 95.606 for CuS.
Low-Temperature Heat Capacities
Heat capacity measurements of the samples were made from 5 to 310 K with an adiabatic calorimeter described by Stuve, Richardson, and King. Sample temperatures in the range of 16 to 310 K were measured with a platinum
thermometer calibrated by the National Bureau of Standards. Temperatures below 16 K were measured with a calibrated germanium thermometer. Temperature changes in the calorimeter as small as ±0.0001 K were determined potentiometrically.
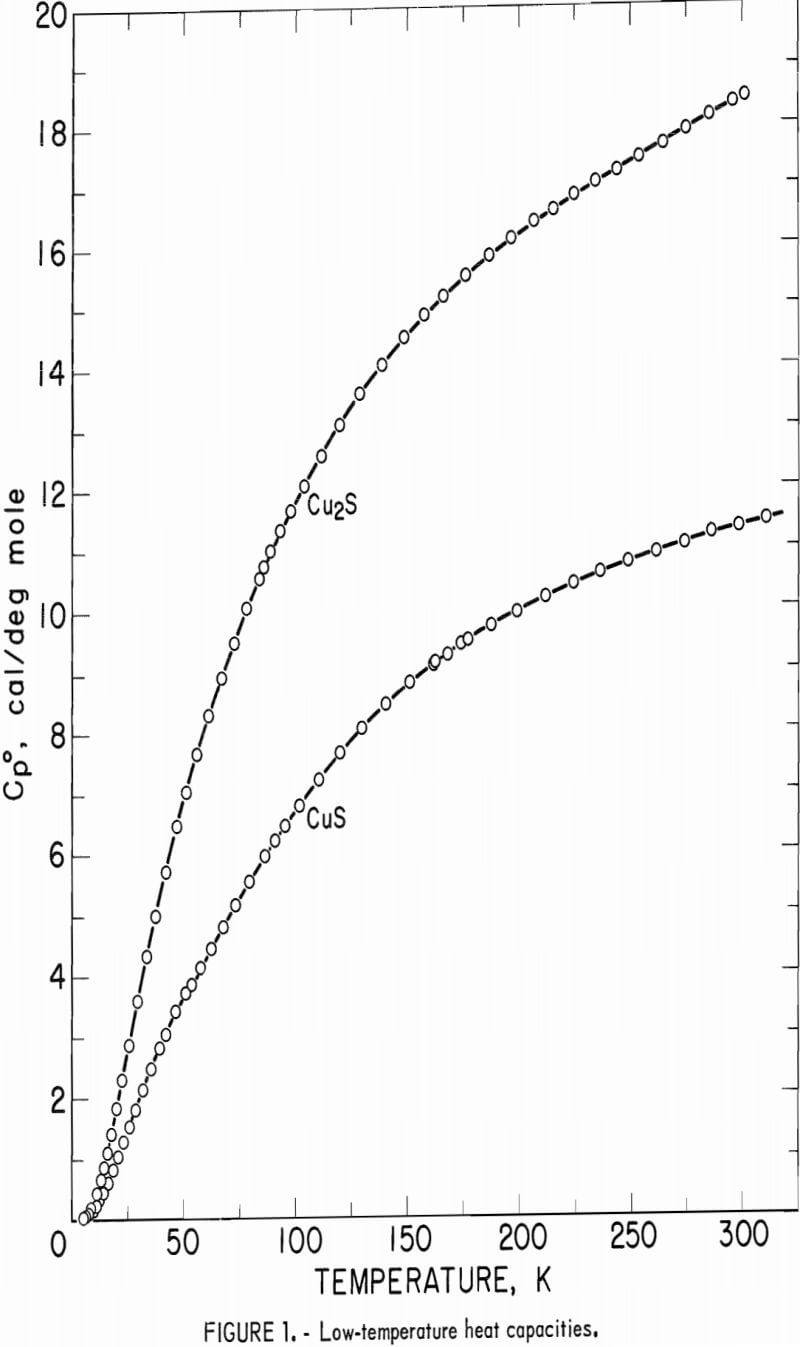
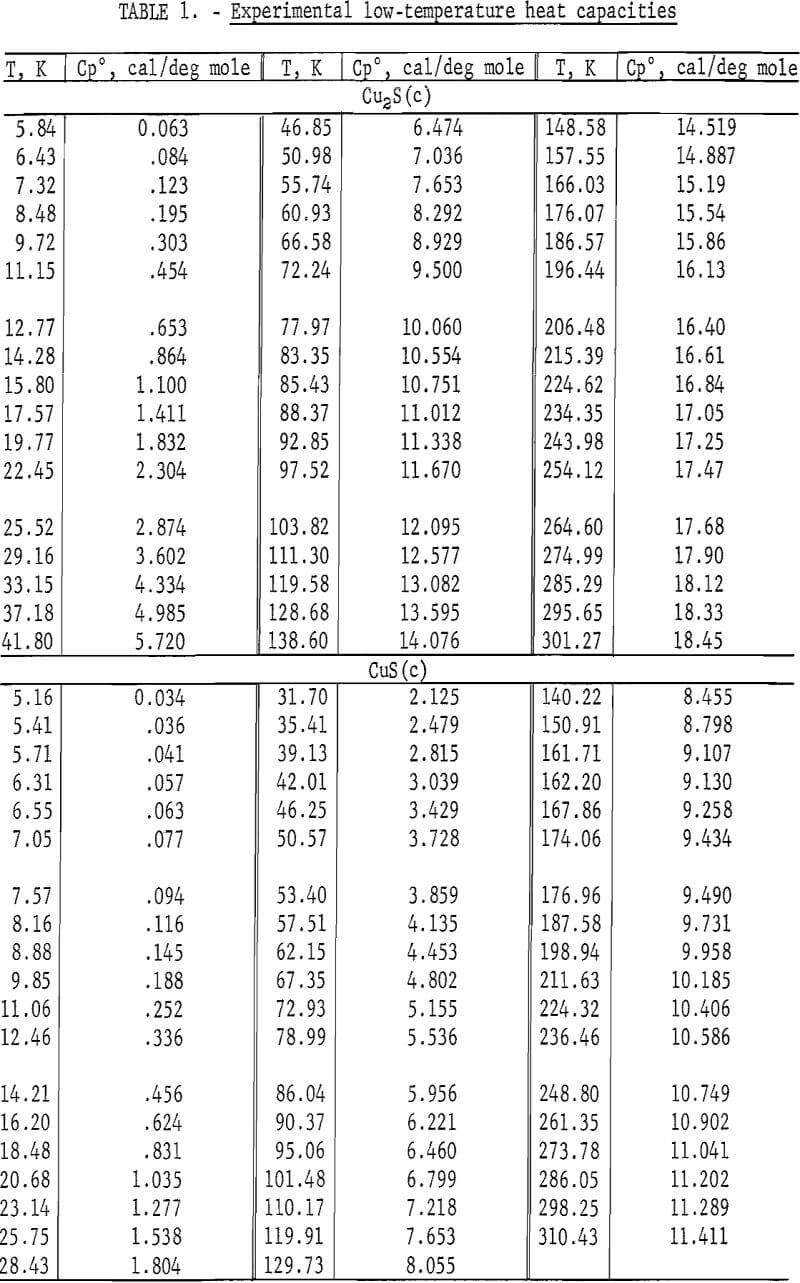
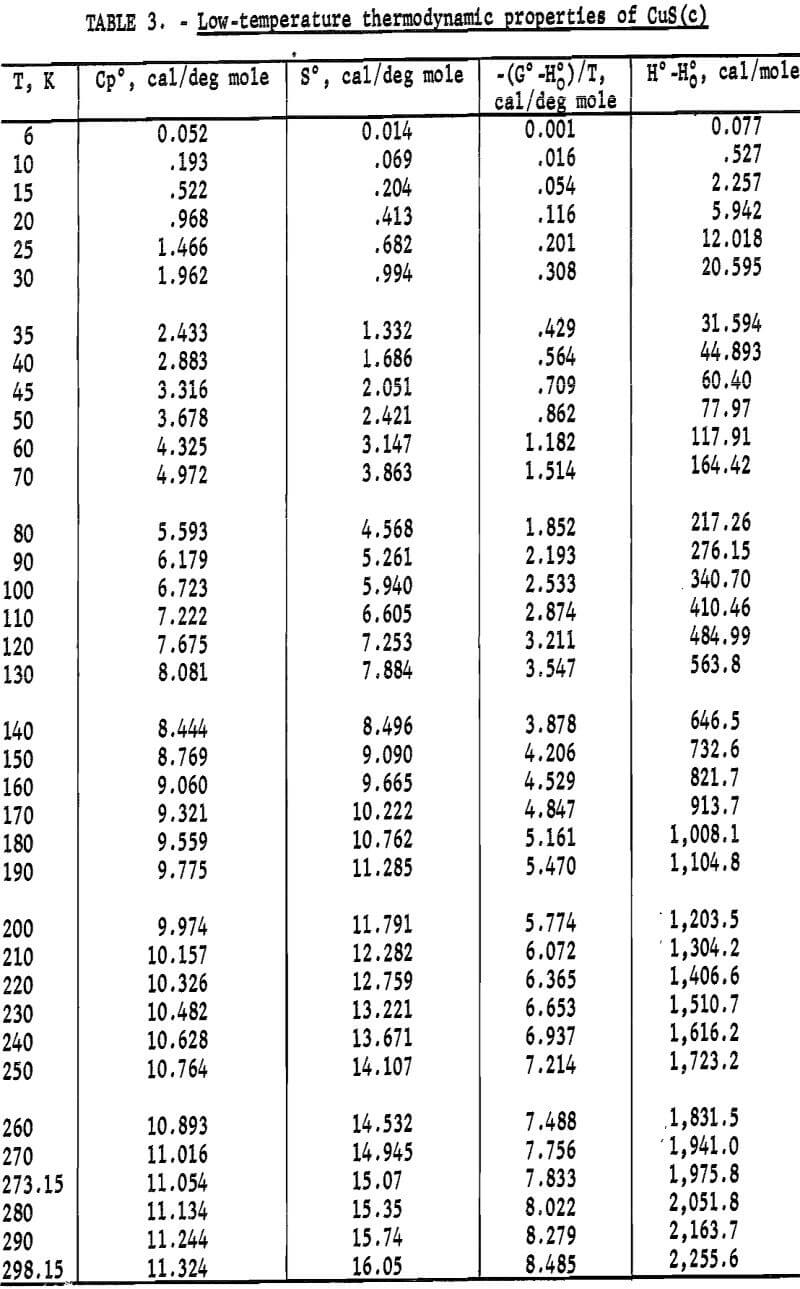
The calorimeter has a copper sample vessel with a capacity of 90 ml which was filled with a sample mass of 272.781 g Cu2S or 109.468 g CuS. After the vessel was evacuated, it was backfilled with about 5.4 x 10 -5 mole of helium gas for better thermal exchange with the powdered sample. Experimental measurements of heat capacity for both sulfides are listed in table 1 and shown graphically in figure 1. The overall uncertainty of measurements for either compound was estimated to be ±5 pct below 10 K, ±1 pct from 10 to 30 K, ±0.1 pct from 30 to 310 K. Measurements for Cu2S generally had lower deviations from the smooth curve than those for CuS. Measured heat capacities of Cu2S were a smooth function of temperature, whereas those for CuS had a very slight bump around 48 to 52 K. No transitions were encountered with either sulfide over the measured range of temperature.
Heat capacities of the sulfides were extrapolated to 0 K by plotting Cp/T versus T2. These extrapolated data and experimental values were computer fitted with smooth curves by polynomial functions. These functions were then used to calculate the smooth heat capacities and related thermodynamic quantities at selected temperatures shown in tables 2-3.
High-Temperature Enthalpies
Enthalpies above 298.15 K were measured with a drop calorimeter described by Douglas and King. This isothermal-jacketed calorimeter has a copper block with a heat capacity of approximately 1.51 kcal/deg. The resistance thermometer was wound around the copper block and it was of the transposed bridge-type described by Maier. The apparatus was modified to incorporate a more sensitive potentiometer and null detector system. This system can resolve temperature changes equivalent to ±0.00005 K. The temperature of the sample in the furnace was measured with a platinum-10 pct rhodium versus platinum thermocouple, which was calibrated against the melting point of pure gold. Before and after enthalpy measurements of a substance, the calorimeter was calibrated electrically and the entire apparatus checked by measuring the enthalpy of pure magnesium oxide (periclase). The mass of a sample plus container was periodically checked for constancy during experimental measurements.
Sample containers for experimental measurements were pure silica-glass capsules; enthalpies for empty capsules were measured in separate experiments. Capsules were filled with powdered samples, evacuated, and fusion sealed with a flame while the portion of the capsule containing the sample was immersed in ice water. The sample mass of CuS was 7.79049 g. Sample masses for Cu2S were 7.82646, 7.80144, 8.17838, and 8.84168 g. Extra Cu2S samples were necessary to establish the curve of the enthalpy function in the liquid state, that is, above 1,400 K, because the glass capsules cracked in the calorimeter during measurements above the melting point.
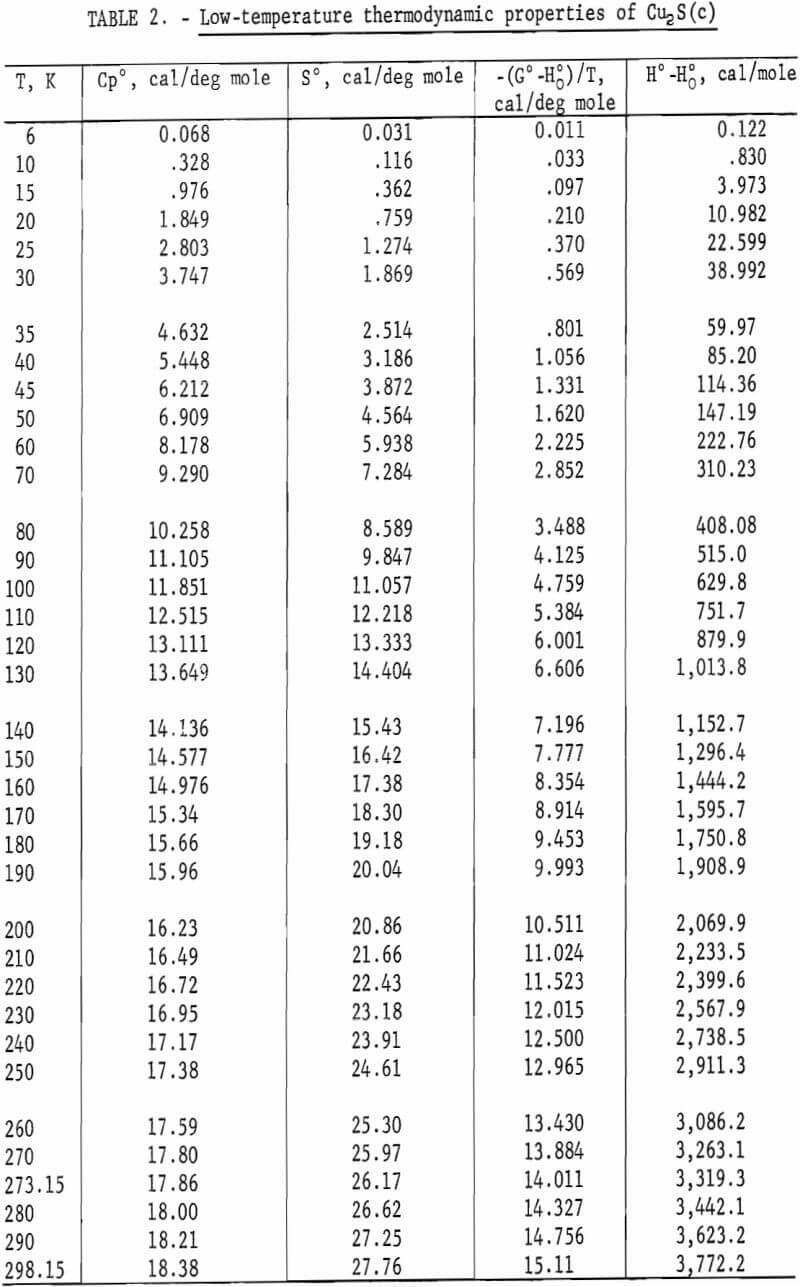
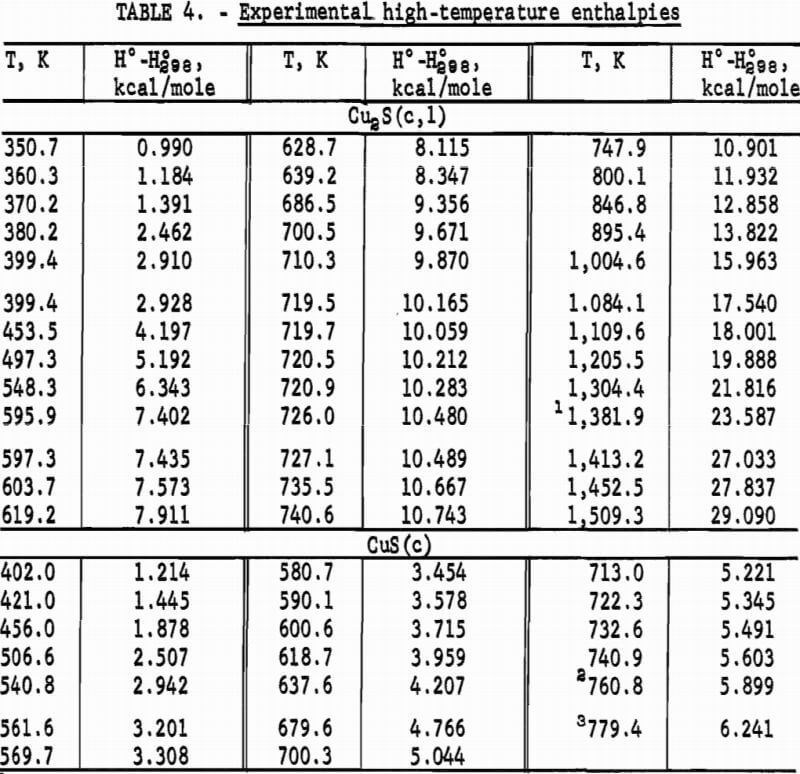
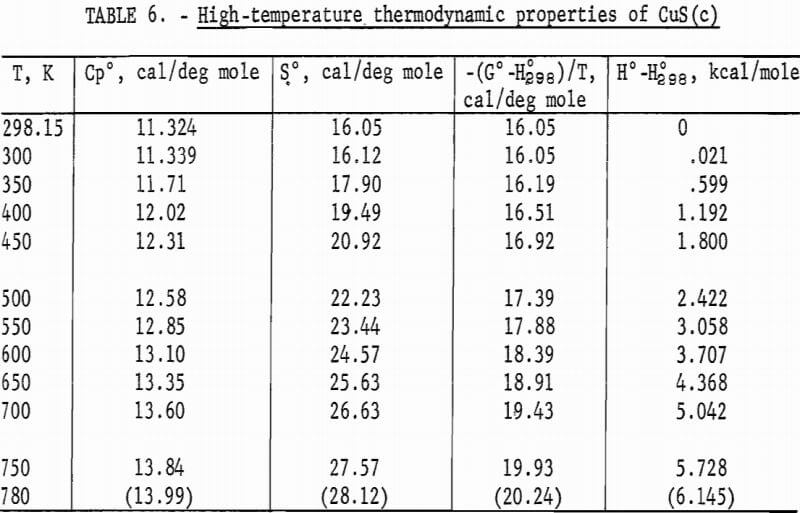
Experimental enthalpies relative to 298.15 K for cuprous and cupric sulfides are listed in table 4. To obtain the best fit of smooth curves to these data, the values were fitted with polynomial functions with the aid of a computer. During this procedure, care was taken to merge the high-temperature enthalpies smoothly with the low-temperature data given in the previous section. The polynomial functions were then used to calculate smooth values of enthalpies and related properties of heat capacities, entropies, and Gibbs energy functions above 298.15 K. These thermodynamic quantities are listed in tables 5-6 at selected temperature intervals. Values at 298.15 and 300 K were taken from the low-temperature data. Enthalpies greater than 10 and less than 50 kcal/mole were rounded to the nearest 0.005 unit. Extrapolation of CuS values to 780 K from the last valid experimental measurement at 740.9 was based on reasonable projections of the smooth values. The constancy of the heat capacity data in the liquid state of Cu2S permitted extrapolation of data to 1,600 K from the last valid measurement of 1,509.3 K. The standard error of measurement was 0.1 pct for CuS and 0.2 pct or less for Cu2S. The latter excludes 0.9 pct for the three measurements below the 376 K transition, where the precision of measurements is significantly less than it is above 400 K. The enthalpies of tables 5-6 are estimated to have an absolute uncertainty of about ±0.4 pct.
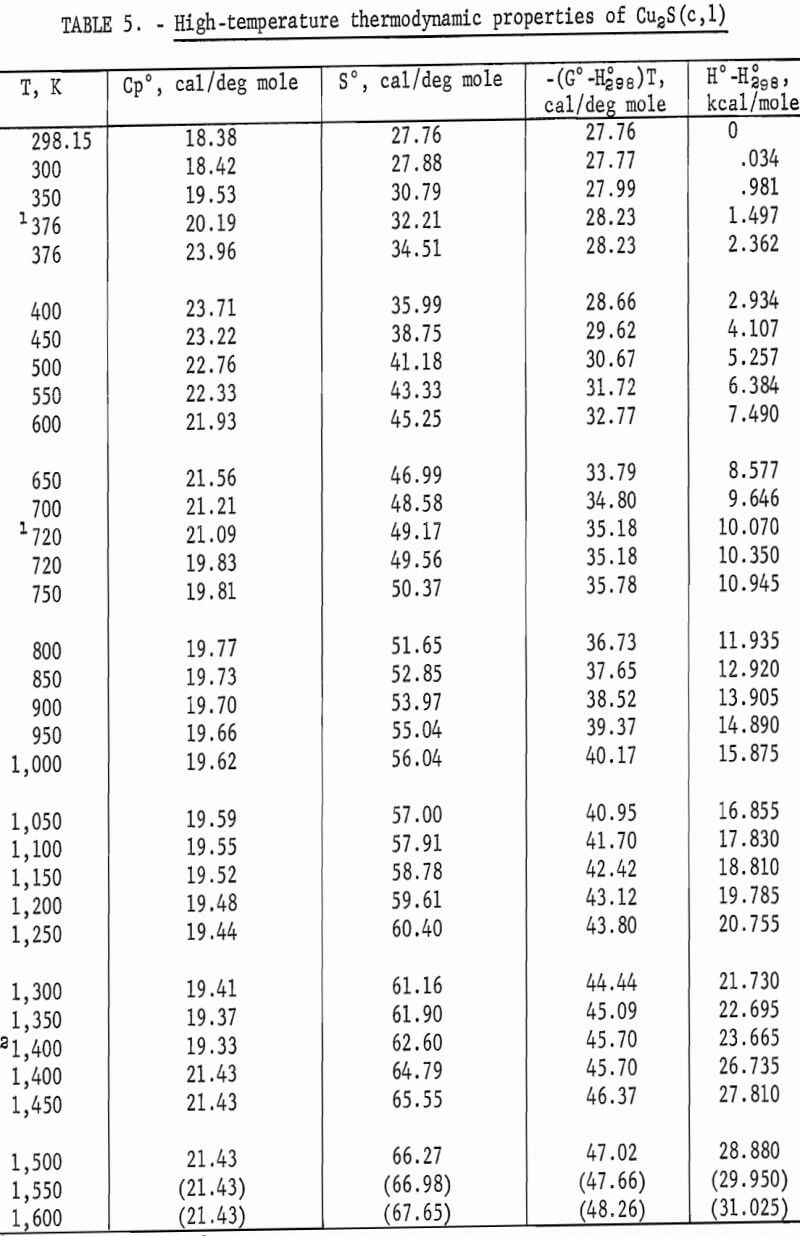
Note.-Values in parentheses are extrapolations.
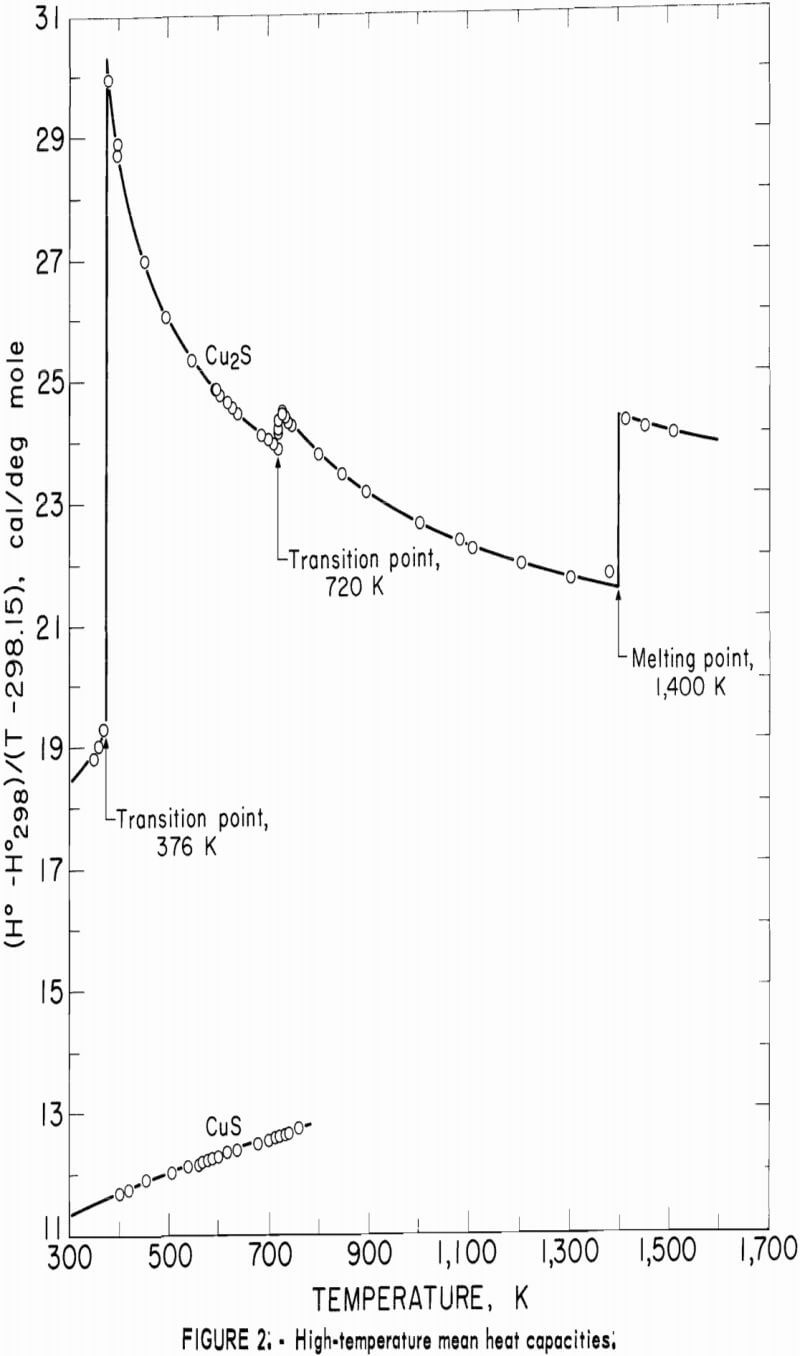
In addition to listing enthalpy values in tables 4-6 for Cu2S and CuS, these data are shown graphically in figure 2 as (H°-H°298)/(T-298.15) versus temperature. This expression is the mean heat capacity, and as such, is given in cal/deg mole. Although continuity was established down to 260 K during the merging of the high- and low-temperature data, the curves of figure 2 were extended only to the 300 K low-temperature value.
The curve of the mean heat capacity for CuS in figure 2 follows a regular course from 300 to 780 K. Decomposition of CuS was shown by the abnormally high thermal effect equivalent to 1.7 pct above the curve for the experimental measurement at 779.4 K, and by globular sulfur appearing on the interior wall of the glass capsule. The decomposition was also verified by X-ray diffraction analysis of the capsule contents, which showed that the sample contained a small amount of digenite (Cu1.8S) and sulfur, in addition to CuS. However, a slight amount of decomposition probably occurred in the last reported measurement at 760.8 K. This measurement was 0.4 pct above the curve, whereas the previous seven measurements over a temperature range of 123 K varied only 0.04 pct or less from the curve. The decomposed sample would recombine to form CuS after heating at about 725 K for 2 hours in the sealed capsule. It was then found possible to reproduce enthalpy values previously obtained at lower temperatures. To test phase stability below 780 K, separate samples were cooled from 600 and 700 K to 298 K in the calorimeter in the same manner as for enthalpy measurements, and then subjected to X-ray diffraction analysis. In both cases, the diffraction patterns matched that of the starting material for the room-temperature form of hexagonal CuS.
The complex thermal behavior of Cu2S is shown by the three reversible transitions in figure 2. Solid-solid transitions were found at 376 and 720 K with isothermal heat absorptions of 0.865 and 0.280 kcal/mole. Above each of these transitions, the heat capacity data of table 5 that were derived from enthalpies show the rather unusual behavior of decreasing values with
increasing temperature. Enthalpy measurements made above and then below the transitions at 376 and 720 K verified reversibility of phase transitions by again being on the curve of the mean heat capacity. The third transition from solid to liquid was found at about 1,400 K with a heat of fusion of 3.070 kcal/ mole. Rapid reversibility of phase transitions was confirmed by cooling separate samples from temperatures above the three transitions at 376, 720, and 1,400 K to 298 K in the calorimeter under the same conditions as for enthalpy measurements, and then within minutes subjecting these samples to X-ray diffraction analyses. Such tests were made at approximately 600, 1,000, and 1,500 K. An additional test was made at about 350 K to have a sample heated below the transition at 376 K. All samples reverted to the stable reference form of monoclinic Cu2S, and no metestable form was detected by X-ray. Over 2 months later, reanalysis of the same samples detected no structural change. This meticulous program was followed to be sure that the room-temperature form was the same after quenching in the calorimeter from each form encountered in this investigation, and to insure that there were no very slow transitions at room temperature. The quench from the liquid state, in particular, was suspect, in view of the small measured heat of fusion of 3.070 kcal/mole. Only the room-temperature form of monoclinic Cu2S was detected by X-ray diffraction analyses for samples used in enthalpy measurements.
The transition at 720 K for Cu2S was established by 12 enthalpy measurements made within 34° of the transition temperature. Figure 2 and table 4 show the results of four measurements, all lying along the isothermal transition line within 1° of the 720 K transition. This transition temperature was initially determined from enthalpy measurements with a minimum furnace residence time of 1.5 hr. To confirm the transition temperature, additional measurements were made with residence times much longer than the minimum. Measurements with residence times 11 to 46 times longer than the minimum established enthalpies below, at, and above the transition point at temperatures of 700.5 (17 hr), 720.5 (19 hr), 720.9 (43 hr), 727.1 (69 hr), and 740.6 K (21 hr).
Enthalpy measurements of Cu2S above the melting point of 1,400 K resulted in cracking of the silica-glass capsules. This cracking was caused by a slight visible devitrification of the silica-glass, and was probably aided either by a volume change of the sample upon rapid freezing in the calorimeter, or by the liquid wetting of the capsule wall with subsequent strain on the capsule upon freezing. The cracking of the glass capsule occurred inside of the calorimeter without loss of the sample, so that an adequate number of successful measurements were obtained for the liquid state before being discontinued at 1,509.3 K. X-ray diffraction analyses of the samples from the cracked capsules showed no differences from the starting material.
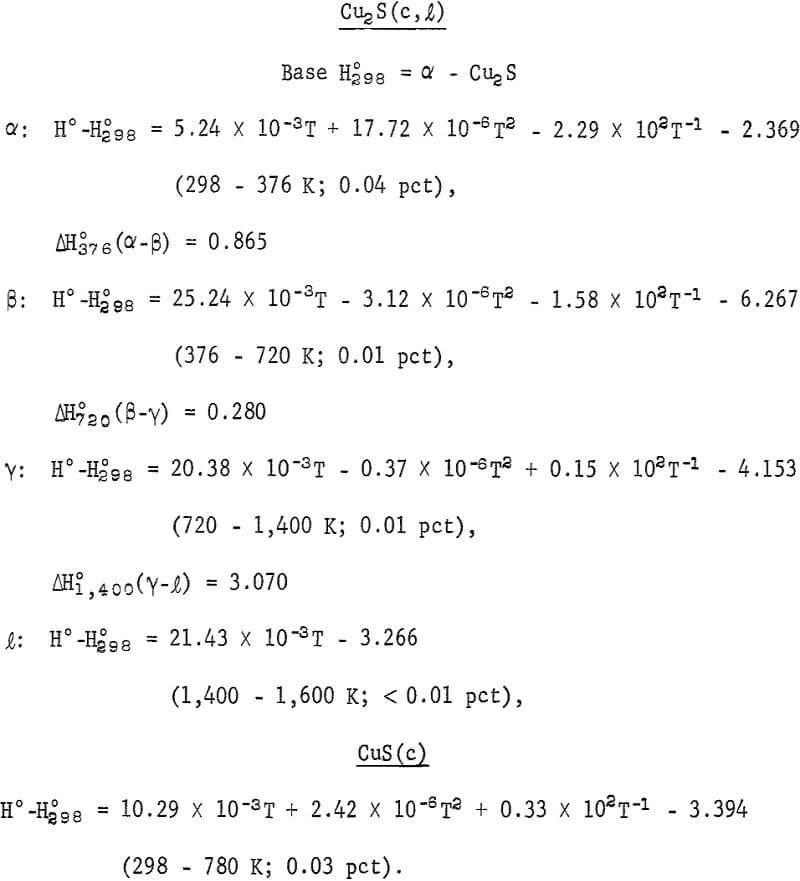
Smoothed enthalpy values for the sulfides from tables 5-6 were fitted with equations to better meet the needs of various users, particularly in engineering applications. Kelley described the method of derivation based on the equation first recommended by Maier and Kelley and on the graphical procedure developed by Shornate. The derived equations follow, expressed in kcal/mole, together with the temperature ranges of validity and average deviations from the smooth data.
Standard Enthalpies and Gibbs Energies of Formation
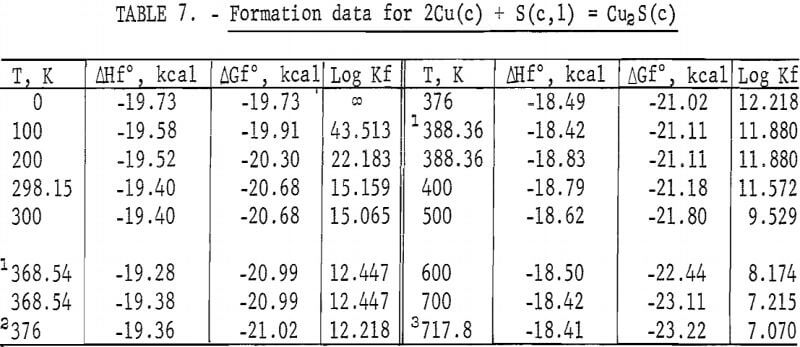
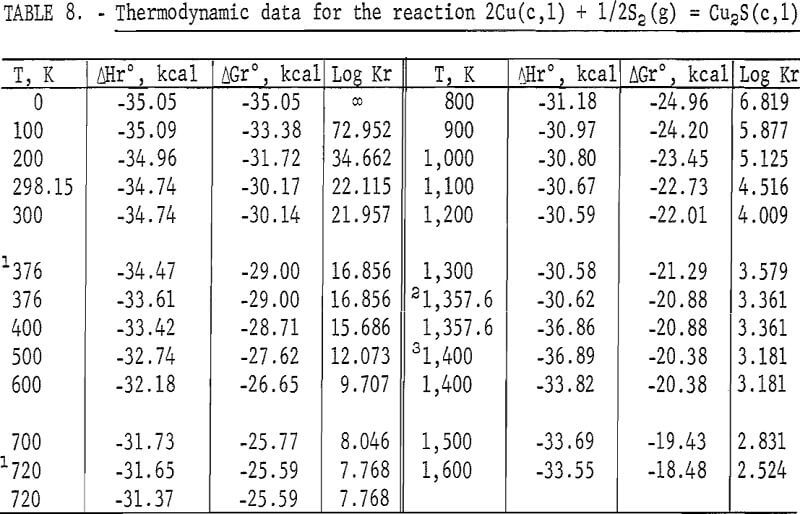
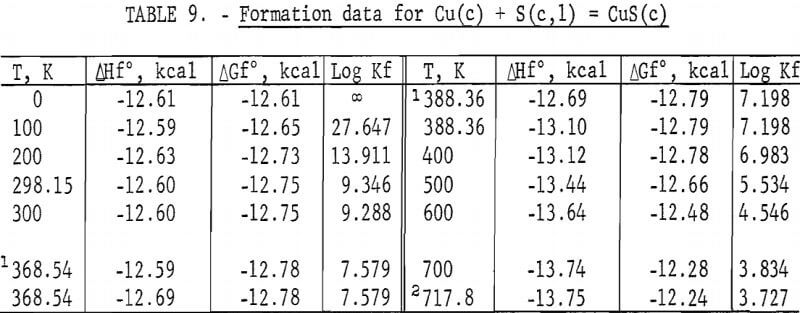
Standard enthalpies and Gibbs energies of formation were calculated as functions of temperature for Cu2S and CuS by combining enthalpy and entropy increments of the present investigation with supplementary data from the literature. Calculations were also made for reactions of copper with S2(g). The supplementary data needed for the calculations were obtained from various sources. The standard enthalpy of formation at 298.15 K for S2(g) was taken from Wagman and others. King, Mah, and Pankratz was the source of enthalpies and entropies for Cu(s,l) and the standard enthalpies of formation for Cu2S and CuS. Increments of the enthalpy and entropy above 298.15 K for S(c,l) were obtained from West, and were corrected to agree with International Practical Temperature Scale of 1968. The remaining thermodynamic properties for S(c,l) and S2(g) were from the JANAF tables.
The results of the calculations are given in tables 7-10, which also list equilibrium constants in addition to enthalpies and Gibbs energies.

Discussion
King, Mah, and Pankratz compiled a monograph on the thermodynamic properties of substances important in the metallurgy of copper. This compilation was sponsored by the International Copper Research Association. At the time the compilation was to be published, the present investigation of high-temperature enthalpies for Cu2S and CuS had been finished. Thus, the smoothed enthalpy values were included in the compilation to make it as complete as possible. These enthalpies were reported in the compilation with the low-temperature heat capacities measured by Anderson. After publication of the compilation, the heat capacities were remeasured, primarily to extend Anderson’s data below 56 K. When the new heat capacities were combined with the same experimental enthalpies, the resulting smooth enthalpies reported herein were found to be the same as those given in the compilation for CuS, and slightly changed only between 298 and 376 K for Cu2S. Consequently, enthalpies reported for Cu2S in the compilation still fit reasonably well with the new heat capacities of the present investigation.
Low-temperature heat capacities of Cu2S and CuS were measured by an adiabatic calorimeter in the present investigation and an isothermal-jacketed calorimeter in the studies of Anderson. His data averaged about 1 pct higher than heat capacities of this investigation, except near 295 K where the difference was closer to -0.5 pct for Cu2S and 0.5 pct for CuS. Anderson derived the entropy increment for CuS as S°298-S°56 = 13.29 cal/deg mole, and estimated the portion below 56 K as 2.64 cal/deg mole. These values resulted in S°298 = 15.9±0.3 cal/deg mole, which compares well with S°298 = 16.05 cal/deg mole of this investigation. In the case of Cu2S, Anderson reported S°298 = 28.9±0.5 cal/deg mole, which is in fair agreement with S°298 = 27.76 cal/deg mole of the present work. His estimation of the entropy below 56 K as 6.06 cal/deg mole is about 0.6 unit higher than determined in the present work.
No measurements of high-temperature enthalpies have been reported in the literature for CuS. An upper temperature limit of 780 K for the stability of CuS was adopted from the studies of Kullerud. This temperature is in agreement with results of the present investigation, which showed decomposition occurred at 779 K and may have started near 761 K.
Enthalpy measurements of Cu2S showed three reversible transitions that were reported previously. For the first transition from the monoclinic to hexagonal structure, temperatures from 364 to 388 K have been given in the literature. The present investigation established this transition between 370.2 and 380.2 K for an average temperature of 375 K. However, 376 K was adopted from Jost and Kubaschewski and Kubaschewski because their heat capacity measurements by adiabatic calorimetry below 400 K are more sensitive than enthalpy measurements by drop calorimetry. The isothermal heat of transition of 0.865 kcal/mole from the present work compares favorably with the value of about 0.920 kcal/mole reported by Jost and Kubaschewski, and 0.889 kcal/mole measured by Kubaschewski. Present results are also in good agreement with the transition temperature of 388 K and the heat absorption of 0.896 kcal/mole measured with a constant heating calorimeter by Ueda, and 376 K and 0.920 kcal/mole calculated by Kelley.
The second transition for Cu2S was established at a temperature of 720 K. A spread in temperatures from about 678 to 743 K has been reported for the transition due to sluggish behavior. Barton wrote, “The inversion is not well defined; it is subject to considerable hysteresis because the sulfur atoms must shift from the hexagonal- to the cubic-closest-packing on heating.” Roseboom stated, “Although this structure cannot be quenched to room temperature, inversion is slow near the transition temperature, and this fact accounts for the 20-degree uncertainty. However, the inversion occurs rapidly 50° above or below the transition.” This sluggish behavior was not encountered in the present enthalpy measurements made with furnace residence times of 11 times longer than the minimum of 1.5 hr. The 720 K temperature and heat absorption of 0.280 kcal/mole determined for the transition from this investigation are in good agreement with 717 K and 0.287 kcal/mole reported by Jost and Kubaschewski, 708 K and 0.306 kcal/mole measured by Kubaschewski, 723 K and 0.090 kcal/mole given by Ueda, and 703 K and 0.110 kcal/mole reported by Wehefritz from galvanic cell measurements. The transition temperature of the present investigation is in disagreement with 623 K calculated by Kelley, but in agreement with his transition heat of 0.200 kcal/mole.
The third transition of Cu2S was the congruent melting at 1,400 K adopted from measurements made by Jensen using differential thermal analysis. Present enthalpy measurements did not determine the melting point due to the premelting effect at 1,381.9 K, which showed an abnormally high thermal effect of 1.2 pct above the curve in figure 2. Consequently, the data were extrapolated to 1,400 K from the last valid experimental measurement at 1,304.4 K. Temperatures from 1,400 to 1,403 K are reported in the literature for the melting point. The present investigation determined the heat of fusion as 3.070 kcal/mole compared with 2.700 kcal/mole measured with a water calorimeter by Johannsen and Vollmer, 2,700 kcal/mole from differential thermal analysis measurements by Mendelevich, Krestovnikov, and Glazor, 2.300 kcal/mole from extrapolation of equilibrium data by Richardson and Antill, and values calculated by Kelley resulting in either 2.900 kcal/mole from the study by Friedrich or 5.500 kcal/mole by averaging the data of Truthe and Friedrich.
High-temperature measurements of Cu2S by others have been limited. Heat capacity measurements between 203 and 803 K were reported by Jost and Kubaschewski; however, their values were not tabulated and instead, were presented graphically. Their data differed from the present investigation by ±1 pct or less. Kubaschewski tabulated heat capacity values measured from 223 to 803 K. His values varied from the present investigation by ±0.03 pct or less. Kelley calculated enthalpies between 350 and 1,400 K from the incomplete and scattered data of investigators given in the Introduction. Kelley’s enthalpies were 1 to 2 pct higher than those of this investigation.
Enthalpy data expressed in equation form are commonly used by industrial scientists in engineering applications. Consequently, it should be noted that all of the standard-form equations given in this paper are an excellent fit to the smooth data with average deviations of 0.04 pct or less. Except for the equation representing the enthalpy data from 298 to 376 K for Cu2S, all other equations are the same as given by King, Mah, and Pankratz in the Bureau of Mines compilation sponsored by the International Copper Research Association.
