The data acquisition and modeling efforts are described first, followed by discussion of some of the simulation results. Observations pertinent to steady-state operation are presented followed by a description of the application of a dynamic model of the grinding circuit for synthesis and evaluation of grinding-circuit control.
Data Acquisition and Reduction
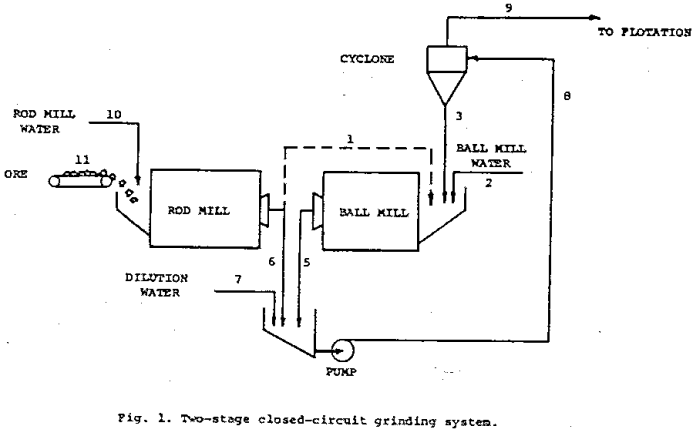
Eleven streams are identified. Stream 1, shown as a dashed line, indicates the rod-mill discharge could be fed directly to the ball mill, or it could be directed via stream 6 to the ball-mill discharge, or it could be split sending slurry each way. This permitted the investigation of two different modes of operation plus combinations of the two, thus allowing an excellent test of the ability of the model to account for modifications in circuit configuration.
The set of data taken for this system contains a considerable amount of redundant information. For example, only two of the three particle-size distributions around the cyclone, streams 3, 8, and 9, are independently specificable. Consequently a balance around the cyclone can be used to independently determine the particle-size-distribution information. Likewise, the circulating load can be computed from particle-size-distribution data or from total mass balances.
The approach developed for analysis of the data was to employ several different balances sequentially with each balance being taken over the entire circuit. First a mass balance was effected using solids-flow rate and screen-analysis data only. Depending upon the number of size fractions employed and the extent of the solids-flow-rate data, there may be from somewhere in the order of forty to perhaps seventy or more pieces of experimental data pertiment to the solids balance. Mass-balance equations introduce a number of constraints which in effect state that only a portion of the data (circuit conditions) may be independently specified. Thus, in a situation involving forty pieces of experimental data we may be able to arbitrarily specify twenty-four values, the remaining being determined from the mass-balance equations.
Model Development
The objective of the model-development phase was to adapt or construct models of the circuit components so that a dynamic simulation of the entire grinding circuit could be obtained by suitably imbedding the individual models in an overall model of the system. Components requiring modeling were the rod mill, ball mill, and cyclone.
Model-parameters were obtained by simultaneously fitting the model to all but five runs. These were reserved for use in validating the model. Since the data covered a wide range of ore grind- ability and slurry density, it was necessary to develop a functional dependence of the comminution coefficients upon these two variables. Note that in the case of slurry density, the influence of slurry density on residence time in the mill is accounted for directly by the W/F term (solids inventory/feed rate) in the model. Hence, the principal effect being accounted for by including slurry density is its influence on fluid properties.
Simulation Results
Inasmuch as the principal objective of the modeling effort was to obtain a dynamic model of the system suitable for control analysis, minimal effort was devoted to defining the steady-state response characteristics of the grinding circuit. Even so, the steady-state response of the dynamic model developed is in quite good agreement with the steady-state behavior exhibited and does serve to provide a good indication of how the various process variables interact. If steady-state optimization were the objective, then some additional runs over an expanded process variable space would be required. With such additional data in hand, the correlation of comminution coefficients with slurry density and ore grindability should be reviewed. Research recently conducted at the University of Arizona was directed toward defining these correlations for continuous-grinding operations for future presentation.
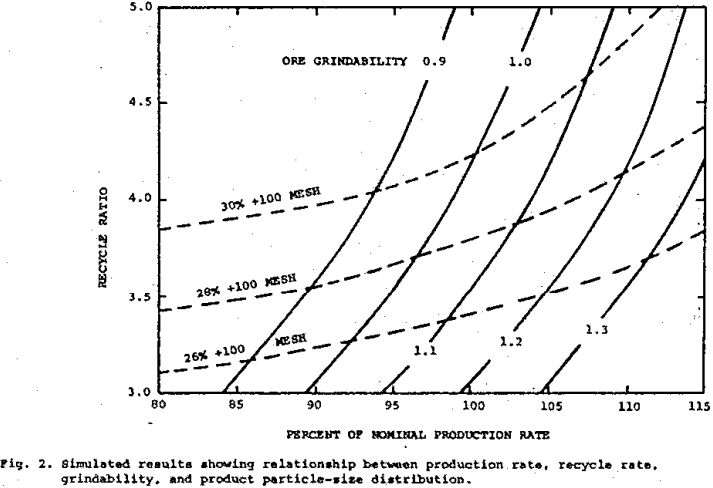
The proper operation of a grinding circuit requires, among other things, an appropriate response to changes in ore grindability and mineralization. In each situation there exists a compromise between high production rate and the fineness of the resulting ground product – i.e., cyclone overflow. As the ore grindability and mineralization change, then the best combination of particle-size distribution, feed rate, and slurry densities at various points in the circuit will vary in the closed-circuit grinding-classification system. Simulation may be employed to indicate how feed rate, grindability, and water rates influence the particle-size distribution of the resulting product. With this information operating policies can be devised that specify conditions to be employed for the processing of various ores in a closed-circuit grinding-classification system.
The variation in recycle rate as a function of production rate for five different ore grindabilities is shown by the steeply rising curves. The three dashed curves show the recycle ratio – tonnage relationship associated with the given particle-size criterion. The two sets of curves illustrate the complex interrelationship that exists between production rate, recycle rate, ore grindability, and particle-size distribution of the final product. For example, if we operate with a recycle ratio of 4.0, the cyclone overflow will contain 30 percent plus 100 mesh for hard ore (grindability = 0.9) and 27 percent plus 100 mesh for soft ore (grindability = 1.3). Thus if we operate on the policy of constant recycle rate, then finer material and more of it would be produced as the ore becomes softer (grindability values becomes larger).
Slurry densities may be influenced by adjusting the flow of water admitted to the process via streams 2, 7, and 10. In the present simulation rod-mill slurry density was controlled by maintaining stream 10 at a predetermined ratio with respect to stream 11.
This leaves the four slurry densities, streams 3, 5, 8, and 9, to be controlled, but only two variables, the water-flow rates of streams 2 and 7, to be manipulated. Obviously, it is not possible to maintain all four densities at a fixed level in the face of process disturbances such as changes in ore grindability. This is not to imply that certain densities should not be deliberately changed as variations in ore occur, but rather that only two independent conditions may be specified. As a consequence, the optimum control of water addition becomes somewhat complicated and includes, for example, consideration of the flotation-circuit behavior.
Dilution water to cyclone feed (stream 7) was manipulated to maintain the cyclone-overflow density constant. The control signal could have come from the density gauge on stream 9; a technique which was found to work satisfactorily. However in this case an alternate method was employed which is somewhat similar to the ratio technique employed to control rod-mill density. From a steady-state analysis it is possible to compute the total water that must be added to the mill at any given production rate to achieve a pre-determined cyclone-overflow density; in fact, it is merely a factor times the feed rate to the rod mill. It follows that the water to be added in stream 7 is readily obtained from a knowledge of the flow rates of streams 2 and 11. While this method would not be recommended for a circuit under poor control, it will do an adequate job of maintaining cyclone-overflow density constant in a stabilized circuit. Once again, we are not recommending this approach to water addition as a preferred operating policy; however, this basic technique coupled with supervisory control to modify set points has much to offer.
The behavior of circulating load shown on the lower set of curves in Figure 5 is seen to be very similar to the cyclone-feed density response. Note that the maximum deviation of production rate occurs at the point of maximum rate of change of the circulating load. The buildup of plus 100 mesh material in the product closely follows first-order response after an initial induction period. For a constant feed rate of 190 ton per hour the increase in ore grindability causes the recycle ratio to increase from 3.15 to 3.91 with a concomitant increase in plus 100 mesh material from 25.1 to 29.7 percent.
The initial sharp cutback in ball-mill dilution water causes an increase in the solids inventory of the ball mill and this effect is reflected by the dip in the production rate curve. The production rate lines out shortly after the ball-mill solids controller has established the new solids level.
One method of improving the situation is to use cascade control where the circulating-load target value (or set-point) in the feed-control loop is adjusted by another controller operating on an error signal proportional to the deviation in the particle-size criterion.
As expected, the excursions in the controlled variable increase as the frequency of the grindability disturbance is increased. At a frequency of one cycle per hour, the highest shown, the excursions in production rate are beginning to decrease because the controller is not keeping up with the process. For frequencies appreciably higher than one cycle per hour the natural damping caused by system capacitance will appreciably attenuate the effect of the disturbance. The system effectively behaves as a low-pass filter. The frequency-response characteristics of the controlled system must be investigated because lags in the system cause the control system to amplify rather than-reduce error in certain frequency ranges.