Table of Contents
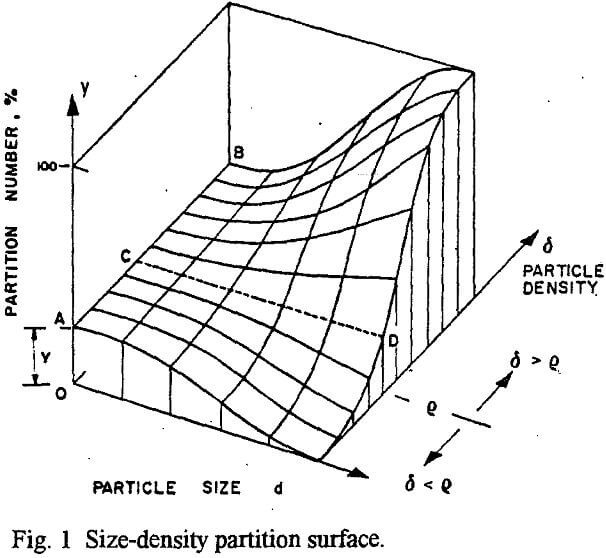
In mineral processing, segregation means a non-uniform distribution of particles with different size, shape and density among the various streams exiting a process plant or a generic operation unit. This term is generally applied with reference to the physical characteristics of particles that are of little or no interest in the separation, or may even be detrimental, e.g. transporting slurries in pipes or storing dry granular solids in bins and stockpiles. For example, the main function of a classifier is its “separation” according to particle size whereas the associated separation according to shape and density may be called “segregation”.
Model of Cyclone Behaviour under Ideal Conditions
The first step consists in providing a model of cyclone behaviour under ideal conditions. The assumptions made are:
- the fluid is homogeneous and Newtonian (e.g. water or heavy liquid); suspensions are not considered in this step;
- there are no lifting effects on particles due to their shape.
If a cyclone is fed with a fluid at density r which splits between underflow and overflow, the fluid recovery of the underflow will be RL=QLu/QLf.
.
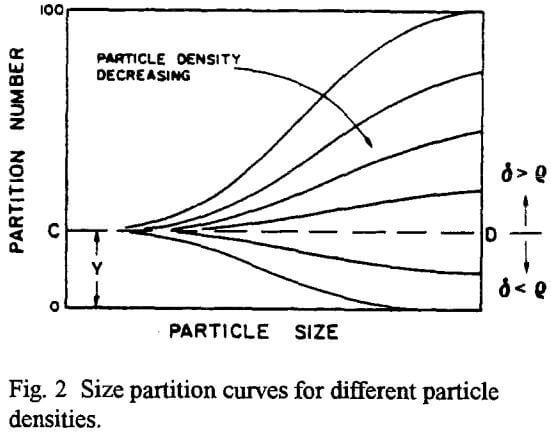
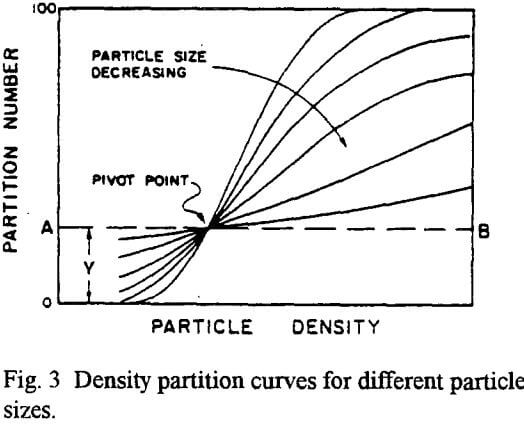
As particle size decreases, the slope of the density partition curve, decreases; the curve rotates around the pivot point and corresponds to less sharp separations.
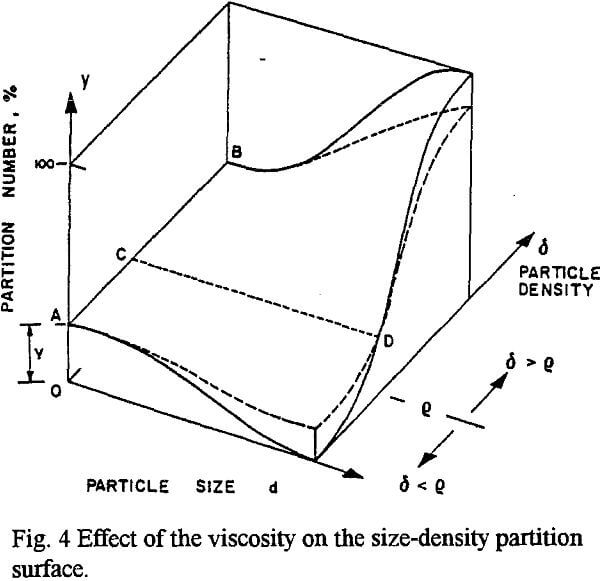
A change in particle shape also modifies the partition surface. The ratio of mass forces/surface forces is lower for flatter particles, so flatter particles will behave as if their density were lower: the partition surface becomes flatter likewise in the case of increased viscosity.
Cyclone Behaviour under Real Conditions
The behaviour model of a cyclone operating under ideal conditions does not take into account several effects, such as suspension thickening, rheological behaviour of the suspension and the dynamic phenomena of thrust on large particles.
Density partition curve
Some observations can be made on its position, that is, the partition number for very fine particles (d→0). Two extreme cases may be considered: liquid containing fine particles which behave as if they were part of the liquid and, hence, split according to the liquid flows; very dense and stable pulp in which the fine particles are entrapped and, hence, split according to the medium flows. For these two extreme though similar cases, the partition number for fine particles will be, respectively:
Y = (Cu/Cf)·(QLu/QLf)………………………………………………………………………….(1)
Y = (Cu/Cf)·(QMu/QMf)……………………………………………………………………….(2)
where Cu and Cf are the weight fractions of fine particles per unit volume of fluid; QLu, QMu and QLf QMf are the volume flow rates of liquid and medium for the underflow and the feed. In both cases, with neutral buoyancy of the particles, we will have Cu=Cf, therefore, the partition number can be calculated as the ratio of the underflow volume flow rate to the feed volume flow rate.
QLu/QLf=Z·QMu/QMf………………………………………………………………(3)
where:
Z = (1 – Pu)·Pu/(1 – Pf)·Pf = (δS-Pu)/(δS-Pf)………………………………………(4)
pu and pf are the weight fractions of solids; pu and pf are the densities of underflow and feed media; ps is the density of the suspensoid.
Size partition curve for δ=p (CD line)
Under ideal conditions the CD line, which the partition surface should pass through, was assumed to be a horizontal straight line of ordinate Y equal to the recovery of fluid in underflow for liquids and ideal stable suspensions. This hypothesis is justified by the neutral buoyancy of particles for δ=p and has been proved by Napier-Munn (1980). He tested different viscosities of a media made up of quartz sand (-38 microns) and heavy liquid of the same density (2.65 g/ml) and then calculated the partition curve for separations of an iron ore (-300 microns).
Dynamic lifting effect on particles
The Magnus effect produces a lifting force on the particles towards the cyclone axis. This happens when the particle shape allows the particle to rotate around an axis nearly parallel to the cyclone axis and normal to the direction of the maximum shear rate. This effect has been found be significant for particles of compact shape and very strong for particles shaped like elongated cylinders; it increases as particle size increases. Flat particles (which cannot rotate because their large surface lies normal to the direction of the maximum shear rate) and relatively fine compact particles do not seem to be affected by the Magnus effect.
Experimental Data
Information is limited in the literature on the segregation of suspension components according to particle size and density. Moreover, most of data refer to magnetic components and only a few also refer to non-magnetic components.
For low differentials (0.10-0.23 g/ml) and feed density in the range 2.70÷2.95 g/ml, only slight size segregation was found, i.e. the partition curve is nearly horizontal and, towards the very fine sizes, virtually tends towards medium recovery in underflow. Only tests at differential values 0.48 and 0.71 g/ml and densities 2.72 and 2.51 g/ml showed significant segregation for coarse sizes, and for both coarse and fine sizes, respectively.
The partition curves could be modelled with the Whiten classification curve expression:
where x=d/d50c, d50c is the corrected partition size and α is a parameter that represents the separation sharpness, related to the imperfection “I” (Ep/d50c=(d75-d25)/2d50C).
The investigations mentioned are insufficient to fully explain the segregation phenomena in cyclones and other dynamic separators. Although agreement with the indications given in the first sections of this paper and with Figs. 1 through 4 is fairly good on the whole, some of the results obtained by the different authors are inconsistent or even contradictory. This is because the industrial or pilot plants and the operating conditions used by the researchers differed widely as well as the purpose of the investigations. Moreover, the conditions were not always favourable for reliable sampling, especially in the case of industrial plants. The results may also have been affected by the different analytical methods employed.
Most of the data reported concerned the magnetic components of dense media fed to DMS or thickening cyclones. We have tried to process them so we can evaluate the possibility of comparing cyclone behaviours, for example in terms of probable error Ep or imperfection I.
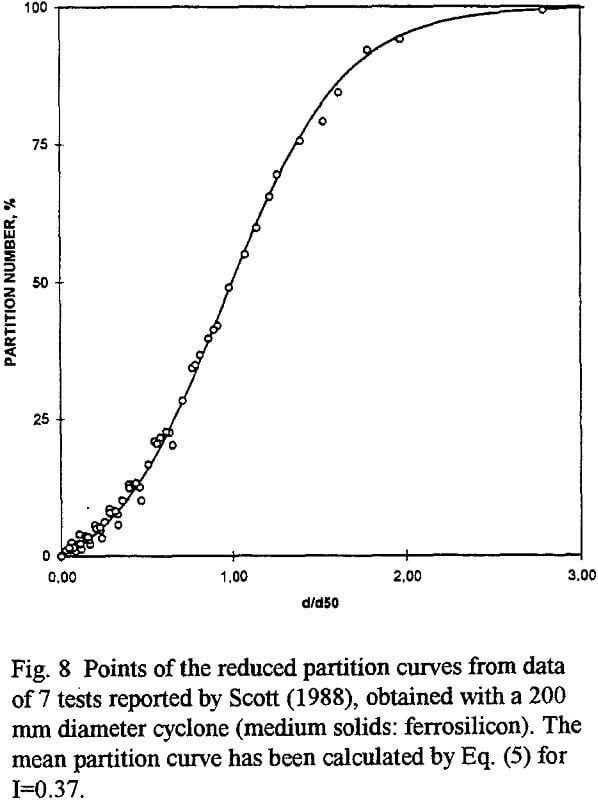
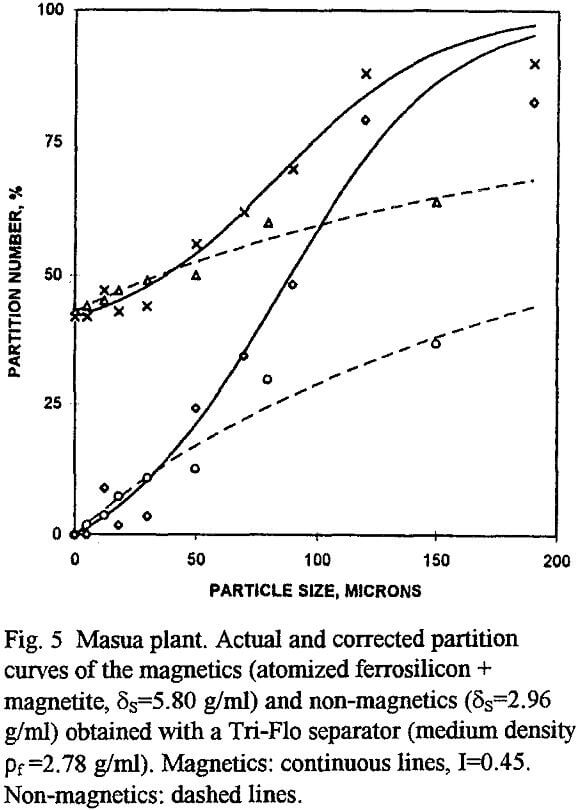
The reduced partition curve in Fig. 8 (continuous line) has been obtained for this value using Eqs. (5) and (6). It can be noted that Eq. (5) fits the experimental points. The tests were carried out with a 200 mm diameter cyclone, non-contaminated ferrosilicon of density δS=6.85 g/ml, density of the medium ranging from 1.46 to 2.60 g/ml and viscosity at 20 through 50 Nsm-²·10-³ (shear rate 130 s-¹).
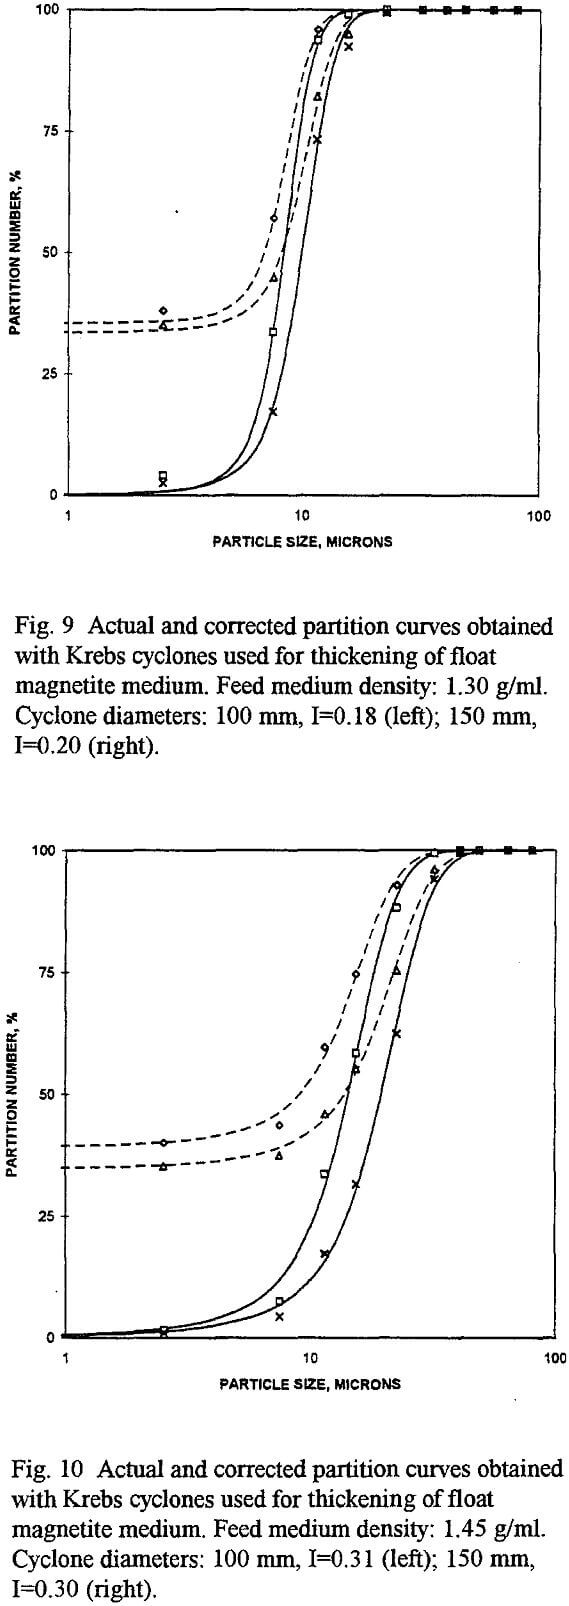
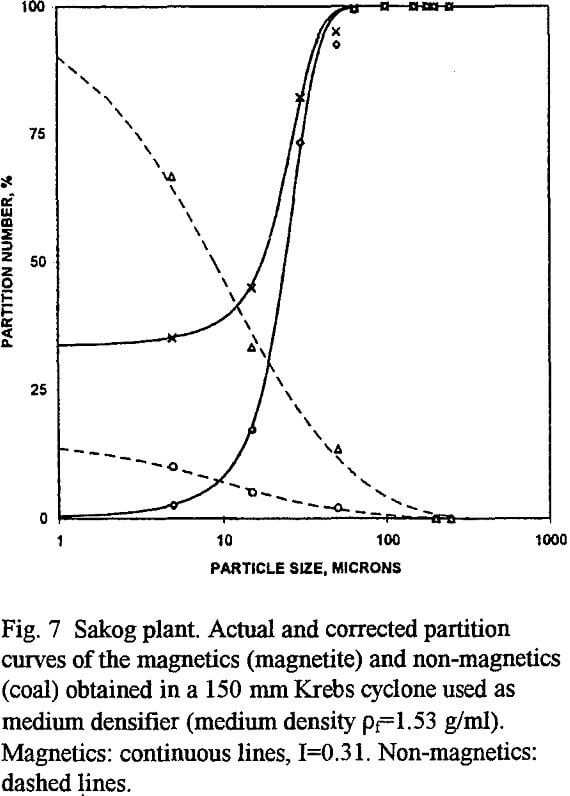
Figures 9 and 10 give the size partition curves for Krebs cyclones used to thicken a float magnetite medium. For medium density 1.30 g/ml, the actual and corrected partition curves obtained with a 100 mm and a 150 mm diameter Krebs cyclones are reported in Fig. 9: the imperfection values are I=0.18 and I=0.20. The results for the same cyclones fed with medium density 1.45 g/ml are reported in Fig. 10: the imperfection values are I=0.30 and I=0.31.
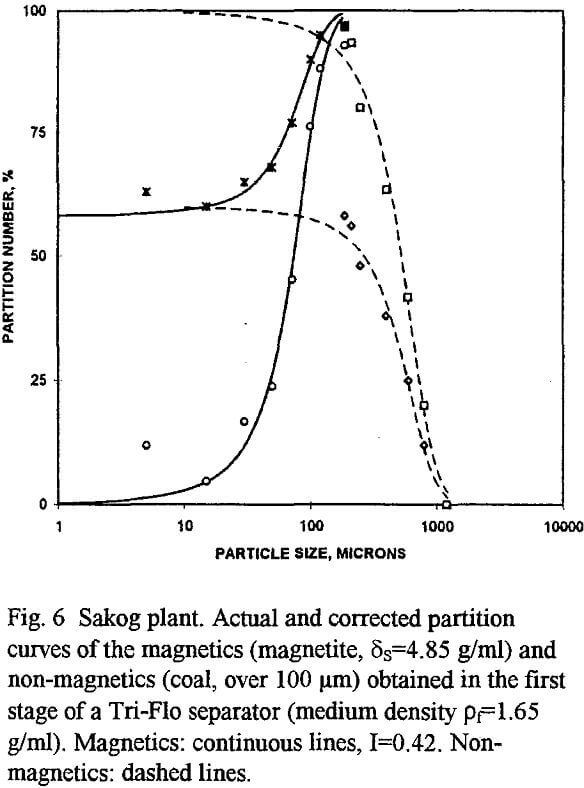
The amount of data is rather limited and the different operating conditions render the comparison questionable. However, the data show that: (a) classification and thickening cyclones fed with magnetite medium give I values roughly from 0.20 to 0.30 for solid volume concentration from 8% to 22%; (b) DMS cyclones fed with ferrosilicon medium give I values roughly from I=0.30 to I=0.40 for solids volume concentration from 8% to 30%; for higher solid volume concentrations, the I value increases and the size separation becomes poor in quality; similar results have been obtained with a magnetite medium; (c) the Tri-Flo gives less segregation if compared with the cyclone: the I values range roughly from 0.40 to 0.45 with both magnetite and ferrosilicon (solid volume concentrations from 27% to 37%).