We describe here one of the very first pioneering SAG Mill Feed Particle Size Analysers: A set of preliminary experiments was carried out in order to assess the hardware-software’s behaviour. Static ore was used to obtain the right sequence of image processing algorithms.
The camera was installed 3 mts away from the commercial sizer over the feed conveyor of the SAG Mill. This analyzer was calibrated following the manufacturer’s procedure.
The process characteristics are those of any normal working day:
Conveyor belt width………………………………………………………………..1 mt
Conveyor belt speed……………………………………………………………..2 mt” sec
Capacity…………………………………………………………………………….650 MTPH
100%, of then ore under…………………………………………………………….8″
The T.V. analyzer ranges were adjusted to be the same as the ARMCO sizer: 1″, 2″, 3″, 4″. The data output from the commercial sizer was recorded every 1 minute over 5 hours operation. Data from the T.V. analyzer was recorded 10 times per second and then compressed off-line.
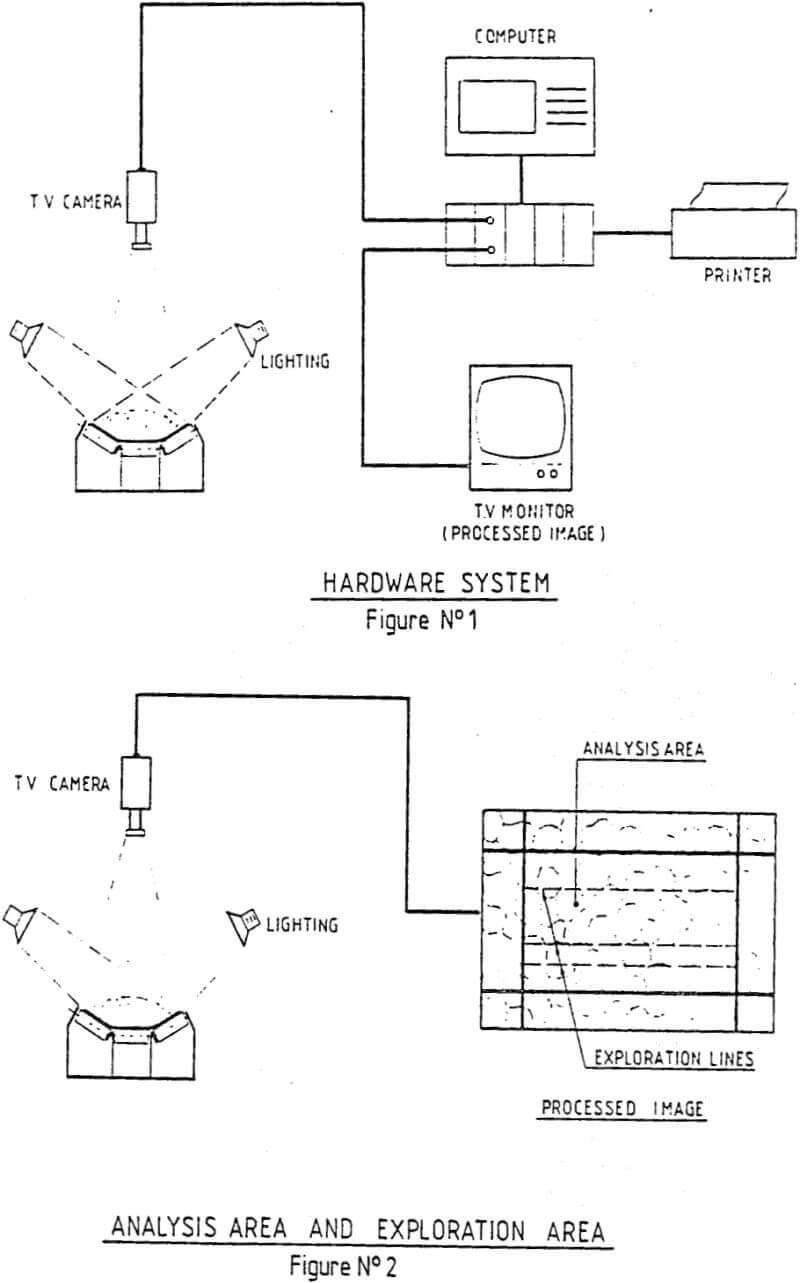
The graphs in figures 2 and 4 show the close agreement between both analyzers. From the table in figure 3 it can be inferred that both analyzers give the same output. The statistics of the differences of averages µO, µI are not significant for t. 995 = 2.75.0 for all the sizes.
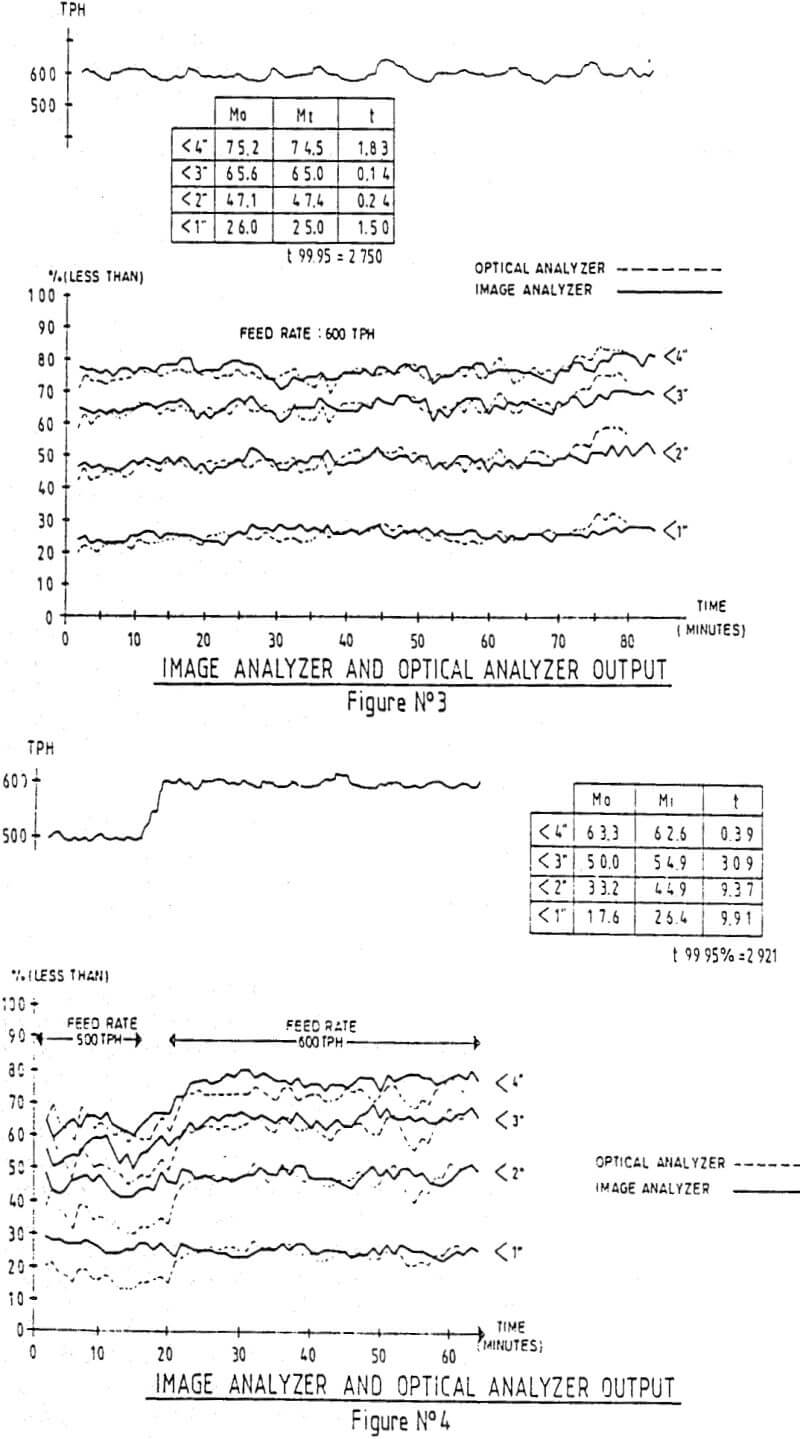
One of the tests consisted in the analysis of the behavior of both analyzer under a “step” of increment of the capacity.
There is a statistically significant difference between both analyzer’s output for the 500 TPH capacity. See Figure 4. “t” numbers and statistics procedures form Dillon (1969).
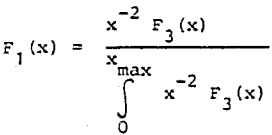
As mentioned in previous paragraphs, the size distribution percentages are calculated as a fraction of “chord lengths”. The study of the correlation of the T.V. analyzer output and a reference weight distribution from a calibrated stock of ore was carried out in the pilot plant.
Original data from weight distribution was converted to a linear distribution using the formula
where: F1(x) = Linear frequency distribution os size x chord length based F3(x) = Weight frequency distribution of size x.
Calculation were made using a discrete formula, taking into account size range frequencies and the mean value of the limiting sizes of each range.
Experimental data shows an adequate correspondence between the outputs of both analyzers for a steady capacity of 600 TMPH.
Under dynamic conditions, both analyzers responded with the some speed, although there is a significant output difference for the small size ranges at a 500 TPH capacity. The “t” statistics are showing a significant difference for the outputs of the ARMCO and T.V. based analyzer. The ARMCO analyzer measure lower percentages of ore for the 3″, 2″ and 1″ ranges. This is due to the segregation of the fine particle induced by the lower capacity.
This effect tends to group the coarse particles at the centre of the conveyor belt.
At a lower TPH, the ARMCO sizer detect less percentage of fines particles due to its measurement principle. The T.V. based analyzer uses exploration lines which are less sensitive to the segregation effects due to their orientation.
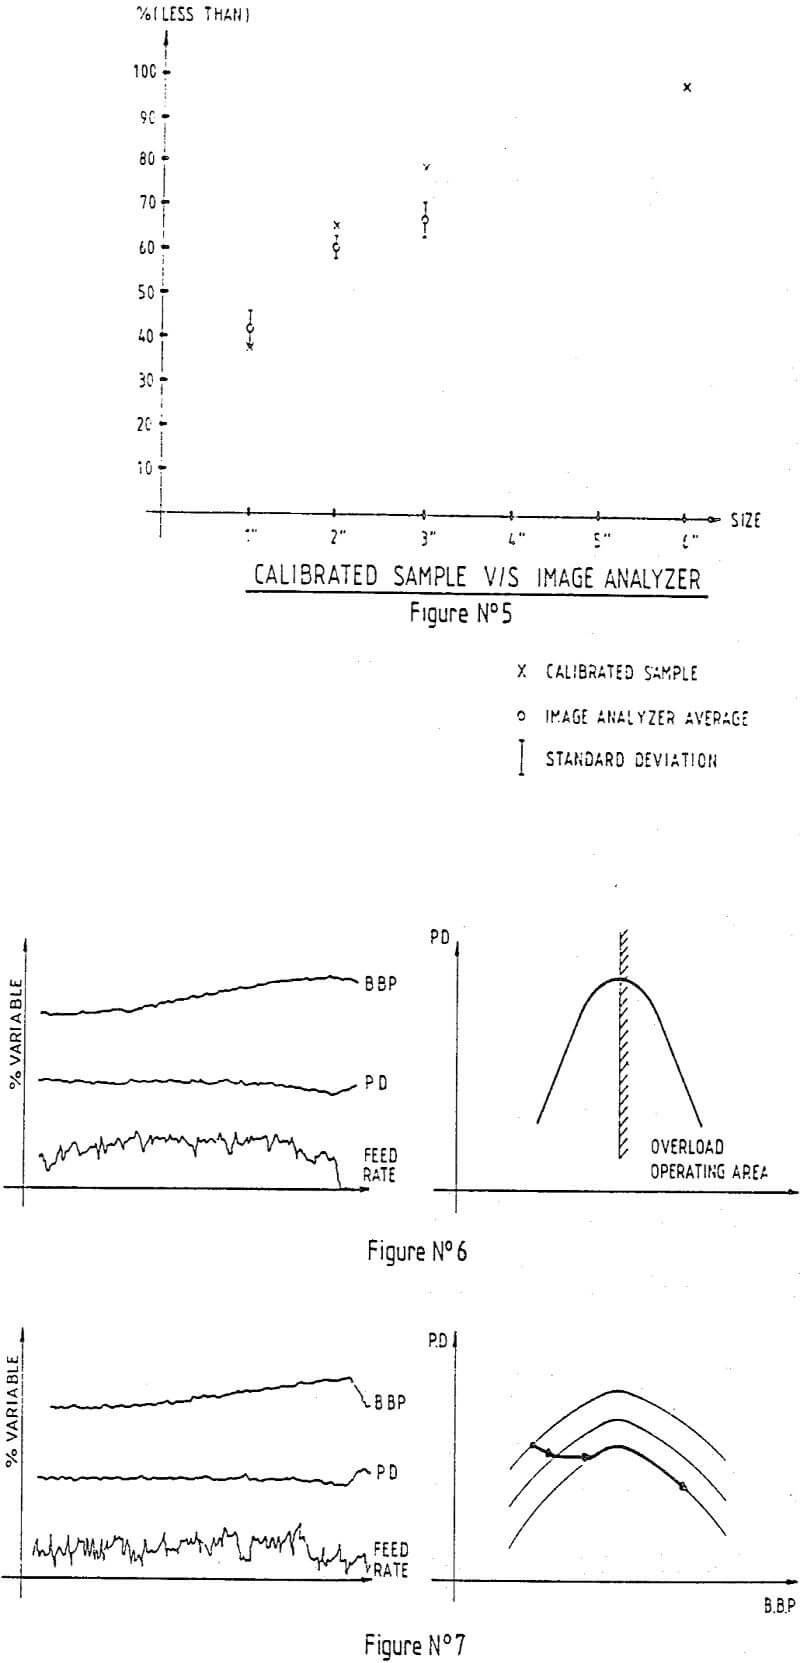
There is also a good correlation between the output of the T.V. analyzer and the transformed weight distribution of the reference stock. See Figure 5.
The Image Analyzer has demonstrated to be an efficient option to ether commercially available products.
Since the T.V. analyzer is computer based, more power and sophistication on data minipulation and analysis are possible. Customized analysis is also attractive depending on the particular requirements of the application.
The field instrument, the T.V. camera is already a proven apparatus which has demonstrated to withstand a good number of industrial environments.
Modular implementation introduces important saving costs since a multipoint analysis uses one computer and several camera linked by a suitable switcher to the digitizer-computer unit.
The flexibility of this software based machine makes possible to configure a very powerful operation tool such as automatic “chute” and feeder monitoring.
– Material segregation on the conveyor implies a “bias” on the measurement because it is made ever the surface of the material being transported
– Measurement of length along exploration lines do not correspond to standard ore size distribution analysis, such as weight distribution or sieve size.
 |
 |