Table of Contents
This process uses electronic ore sorting or “pre-concentration” as an added step before normal concentration to develop a processing system for the native copper ores. Successful ore sorting can lead to cost reductions in the following areas:
- Materials handling, and hoisting (if sorting is done underground).
- Capital and milling operations.
- Mill tailings disposal, as well as decreasing the amounts of them produced.
Such reduced costs could open up large reserves of the low-grade and deep native copper deposits still left in Upper Michigan.
The electronic ore-sorting test program consisted of plant-scale sorting and lab sorting. Plant sorting was done to determine the sortability of different native copper ores and the efficiency of the electronic ore sorters. Tests were run at the sorting plant owned by Minerals Recovery Corp. (MRC) in Painesdale, Mich.
Lab tests were performed at Michigan Technological University, Houghton, Mich. They were done to determine the efficiency of a belt sorter equipped with a second sensing coil located above the belt, and to determine the sorting characteristics of larger ore size fractions than those used in the plant
sorting.
The ore sorting system performs three basic operations-singulation, detection, and ejection. Singulation is the flow of the material that presents each rock fragment to the detector for inspection. Detection senses the presence or absence of the desired values. Ejection is the physical separation of the detected fragments from the remainder of the ore.
The four major types of mechanical ore sorters are electronic (which is the subject of this report), photometric, radiometric, and conductivity-resistivity. The main difference between the sorters is in the detection operation; each uses a different physical property of the rock for separation.
Photometric ore sorters use an optical property such as color or reflectivity. A system of this type using reflectivity has sorted ore in a South African gold mine since 1969. Radiometric sorters detect the presence or absence of gamma rays as the basis for separation. This method became the first successful sorting system when it concentrated low-grade uranium ore in the late 1940’s. Conductivity-resistivity sorters measure either the conductivity or resistivity of a rock, compare that measurement to a standard, and then either accept or reject the rock. The first serious effort to use this technique was in the early 1930’s, but no practical and accurate system was developed until the early 1970’s.
In the electronic method, ore pieces are individually introduced into the electric field of a tuned coil oscillating at high frequency. If the piece contains enough metallic copper, the frequency of oscillation is altered, triggering the ejection. The alteration is detected by the beat-frequency technique.
For electronic ore sorting to be successful, the mine-run rocks must have a high degree of heterogeneity. If all the rock pieces have similar copper contents, the sorter cannot detect a difference. Heterogeneity must also be present in the larger pieces for the sorting process to have a reasonable capacity, since the sorters examine one piece at a time. Pieces that are too large, however, will not sort well because they tend to be more homogeneous and because air requirements for the sorter are too high. The proper size for separating must be determined for each type of feed material. The test program was designed to measure sorting efficiency as a function of feed size.
In previous research, the Bureau of Mines conducted sorting experiments on minus 1- plus ½-inch native copper ore and designed an electronic sorter that used the induction balance technique of detecting metals. The sorter was then tested by Michigan Technological University on native copper ores. In these tests larger size ore (minus 4 plus 2 and minus 2 plus 1 inch) was sorted, and a high average recovery (91.5 pct) was attained.
Electronic Ore Sorting Machines
Belt Sorter
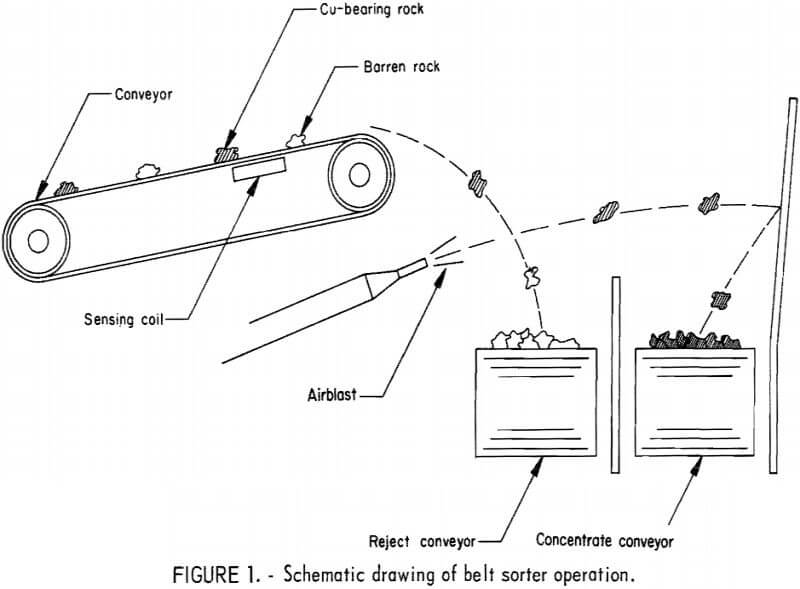
Belt sorters (fig. 1) were used in both parts of the experimental program. In the plant tests, they were used to sort the minus 6- plus 4-inch and minus 4- plus 2-inch fractions. In the lab tests, they were used on the four feed size fractions in the minus 12- plus 2-inch range; the minus 2-inch fraction was not sorted.
The sorter is a conveyor belt upon which individual pieces of ore pass over a tuned coil oscillating at high frequency. If a rock contains sufficient native copper, the frequency of the oscillation is altered. An electronic circuit detects the change in frequency and opens an air valve positioned to deflect the copper-bearing piece from its normal trajectory at the end of the belt and onto a concentrate conveyor. A second sensing coil was placed above the conveyor belt in the lab tests to increase copper recovery.
Rotary Sorter
Rotary sorters (fig. 2) were used only in the plant tests. They sorted the minus 2- plus 1-inch and the minus 1- plus ½-inch fractions. Rotary sorters contain a number of chutes rotating about a central feed point. Using centrifugal force, the feed particles pass through the chutes, each of which has its own sensing coil, as in the belt sorter. An airblast at the exit of each chute deflects the desirable particles onto a concentrate conveyor.
Both the belt and rotary sorters were developed and manufactured by International Sorting Systems Corp. (ISSC) of Santa Barbara, Calif.
Ore Description
General Geology of Michigan Native Copper Deposits
The native copper deposits of Upper Michigan are found within a narrow, linear band of layered Precambrian volcanics and sediments. The band runs along the length of the Keweenaw Peninsula, and the beds dip 20°-75° NW under Lake Superior. The beds form the southern link of the Lake Superior syncline known as the Portage Lake Lava Series. The series contains more than 200 lava

flows and over 20 conglomerates with a total thickness ranging from 9,000 to 15,000 feet.
Both fissure and lode deposits are found in the district. Fissure deposits occur in fractures in the conglomerate and lava flows. They were mined during the early development of the district but have produced only 2 pct of the total 11 billion pounds of copper mined from the Keweenaw Peninsula.
Lode deposits are subdivided into conglomerate and amygdaloid types, which have produced about 40 pct and 58 pct of the native copper, respectively. Copper has filled the primary voids in the rock in both types of ore. In the conglomerates, copper is found in the spaces between pebbles; in the amygdaloid ores, vessicles and brecciation of the lava flow tops during cooling provided the primary voids for native copper mineralization. Copper was precipitated from hydrothermal solutions migrating upwards through the porous and permeable zones of the conglomerates, flow tops, and fractures. The copper was probably carried as complexes in chloride brine solutions, but geologists still disagree on theory of formation.
Ore Sample Information
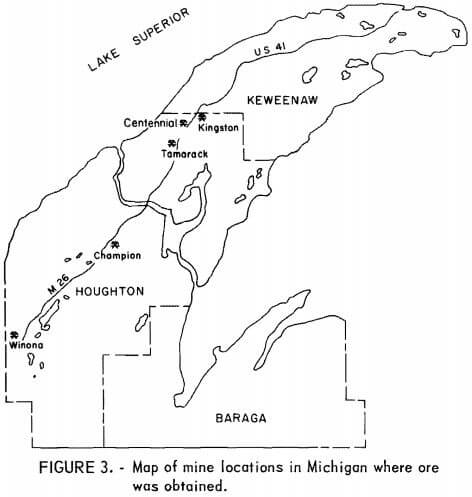
Four different ores were obtained for the sorting in the plant tests. High- and low-grade ore from amygdaloid and conglomerate types represented the kinds of ore derived from either bulk or selective mining methods. Since the mines were inoperative, poor rock had to serve for the low-grade amygdaloid and conglomerate samples. The ore from the Winona mine was of a lower grade than anticipated. Data on the samples are shown in table 1, and the mine locations are shown in figure 3.

Conglomerate ore from both the Centennial and Kingston mines was used for the lab tests. Tonnages and ore grades of the samples are presented in table 2.


Plant Tests
Plant Flow Scheme and Test Procedures
General Description of Ore-Processing Flowsheet
The MRC plant flowsheet is shown in figure 4. The ore is crushed in an 18- by 30-inch jaw crusher set at 5 inches. The ore is then screened into four size fractions for sorting (minus 6- plus 4-inch, minus 4- plus 2-inch, minus 2- plus 1-inch, and minus 1- plus ½-inch). The plus 4- and plus 2-inch pieces are belt sorted, and the plus 1- and plus ½-inch pieces are rotary sorted. The concentrates and rejects are taken by conveyor to their respective stockpiles.
Test Procedures
Plant Warmup
The sorters and feed stockpile were enclosed and the screens were covered to protect them from the excessive annual snowfall during the time the tests were to be run. Because the rest of the plant was outdoors, a warmup period of 2 to 5 hours (depending on the temperature and snowfall) was required before each test to clear the snow off the conveyors, check and adjust the sorters, and to tare and calibrate the belt scale.
Preliminary Tests
Preliminary tests were run on all ore types except the Kingston ore, which was available in limited quantity. To determine the maximum throughput for each ore, the crushed, screened rock was run through the sorting plant at an increasing rate until one section could not handle the feed efficiently. To determine the effect of feed rate on recovery, two preliminary tests were made at feed rates of 90 and 60 pct of the maximum. Each run consumed 75 to 100 tons of feed. The results are presented in the appendix, table A-1.
Formal Tests
Feed rates were set for the formal tests based on the results of the preliminary tests and the knowledge gained from working with the different ores. Capacity was limited by the tonnage that a particular sorter could handle or by the quantity of air available. The tests were run at conservative feed rates to avoid overcrowding. Air pressure was monitored and, when necessary, feed rates were reduced to insure adequate air pressure in the supply system. The ore was double-sorted; the reject from the first pass was the feed for the second pass. At the end of the formal tests, the product samples were rescreened into the four size fractions to determine sorting performance as a function of feed size.
Sampling of Test Products
The formal test on each ore yielded a first pass concentrate, a second pass concentrate, and a final reject. Owing to the coarse rock size (minus 6 inches) and the nonuniform copper distribution, it was necessary to collect large samples for copper analysis.
All of the concentrate was collected for assay. The reject samples were collected in a front-end loader at the reject conveyor. The samples were collected for a fixed period with a fixed interval between samples. The weight of the reject sample varied with the ore type, but in general ran from 18 to 30 tons, or 10 to 30 pct of the total reject. The concentrate products and the reject sample from each test were stockpiled prior to sizing and preparation for assay.
Sorting Test Results
Formal Tests
Feed rate and copper recovery data are summarized in this section of the report for the formal runs on Champion, Winona, Tamarack, and Kingston feed materials, tables 3-6. Data presented in tables 7-10 show the copper size recovery on four size fractions of each ore type.
Results are tabulated for single and double sorting. In double sorting, tailings from the first pass were resorted. Copper contents of the combined concentrates were calculated from the assays and weights of the pass 1 and pass 2 concentrates. Feed rates are listed separately for each pass to the sorters. Results do not include the minus ½-inch material, which was removed from the feed prior to sorting.


Discussion
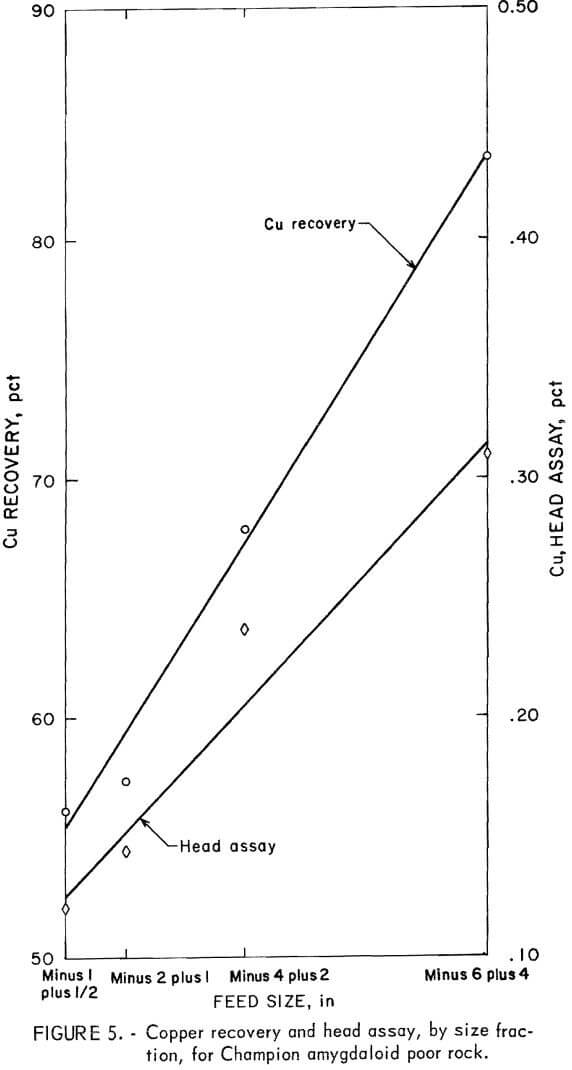
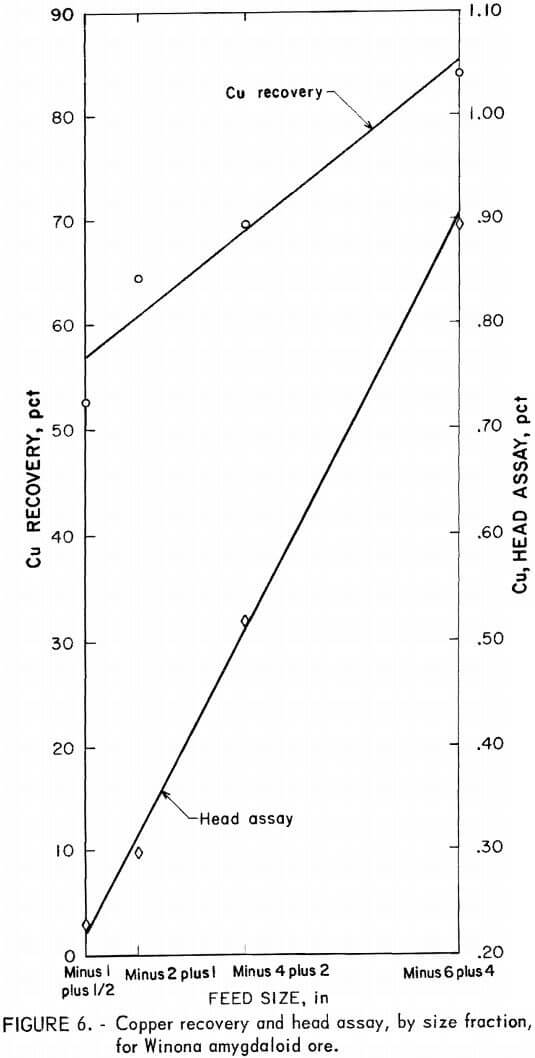
Copper recovery and head assay versus size fraction for the amygdaloids and conglomerates are shown in figures 5-8. In general, the head grade increased as rock size increased, owing to the cementing action of the copper, which held the country rock together during blasting. Except for the Tamarack poor rock, copper recovery also increased as rock size increased.
Table 11 lists the copper distribution by size as a percentage of total, copper and the copper size recovery in the minus 6- plus ½-inch products. The presence of coarse copper and the association of coarse and fine copper have an effect on copper recovery. The lowest recovery was obtained from Tamarack poor rock which had only 5.5 pct plus 10-mesh and 17.0 pct plus 100-mesh copper. Copper particle recoveries from the Tamarack combined concentrate varied from 80.7 pct for the plus 3/16-inch copper to 14.5 pct for the minus 100-mesh copper. The highest copper recovery was achieved from Kingston ore which contained 22.1 pct plus 10-mesh copper. Copper size recoveries on this ore ranged from 93.3 pct for plus 3/16-inch copper to 69.2 pct for minus 100-mesh copper. Although the Kingston ore contained a smaller amount of coarse copper than some of the other feed materials, a significantly higher percentage of minus 100-mesh copper was recovered. It is apparent that the association of coarse and fine copper contributed to the overall high recovery from this ore.



Laboratory Tests
Processing Flow Scheme & Test Procedures
Preliminary sorting tests were run on ore from the Centennial and Kingston mines in order to evaluate the performance of the laboratory belt sorter and to determine which ore would be used for more intensive testing. From the preliminary tests, it was determined that the Kingston ore should be used because it responded better to sorting, resulting in a lower copper content in the rejects.
Ore Sizing
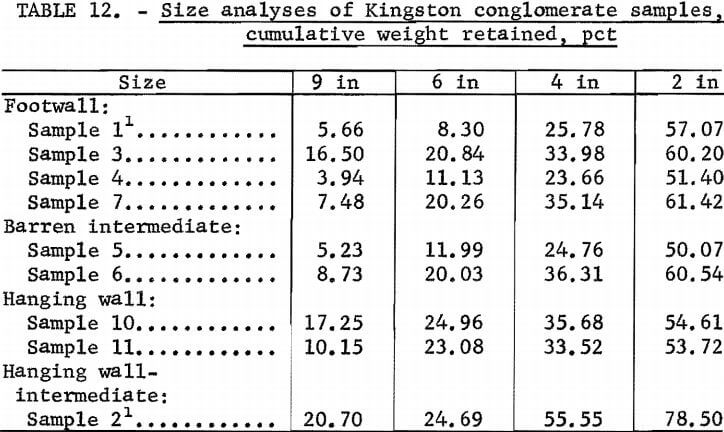
The Centennial ore was separated into the following four size fractions for sorting: Minus 6 plus 4, minus 4 plus 2, minus 2 plus 1, and minus 1 plus ½ inch. The Kingston ore was separated into the following five size fractions: Minus 12 plus 9, minus 9 plus 6, minus 6 plus 4, minus 4 plus 2, and minus 2 inches. The size analysis of the Kingston samples appears in table 12.
Sorting Flowsheet
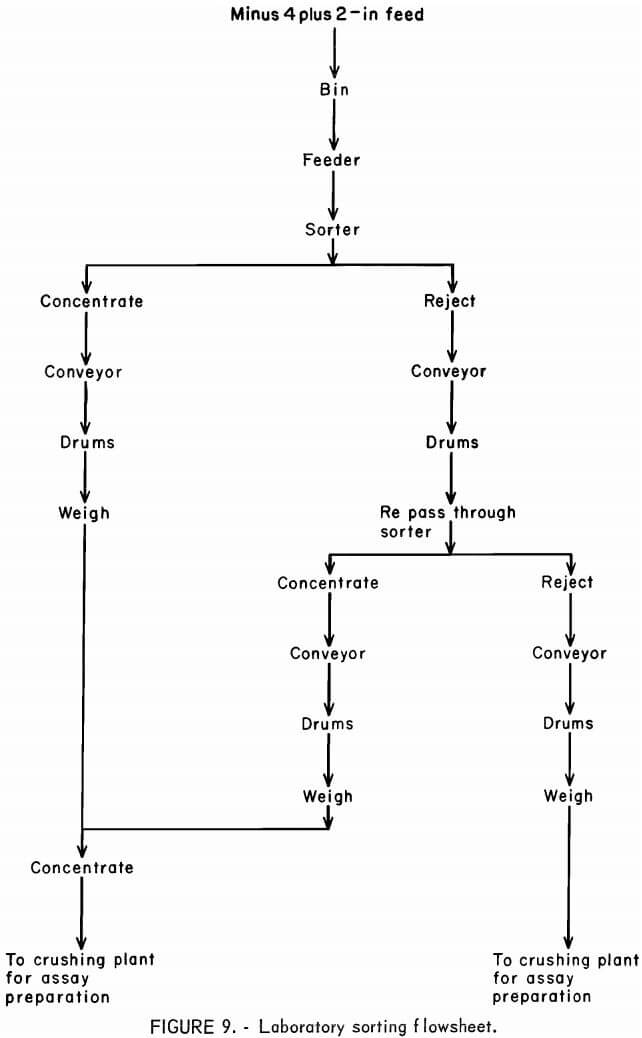
The laboratory sorting operation flow scheme is in figure 9. Each size fraction from each ore zone sample was sorted with the two-pass system, with the reject from the first pass used as the feed for the second pass. This resulted in first- and second-pass concentrates, which were combined, and a final reject.
The belt sorter ran empty for at least 20 minutes each day prior to the actual sorting operation. During this time, the sorter was checked out and adjusted to assure proper operation.
Ore Sorting Test Results
Centennial Ore
Centennial ore sorting results are summarized in table 13. Copper recoveries by copper size for the separate feed fractions are presented in table 14. Copper recovery increased as feed size increased. Data in table 14 also indicate a more favorable association of coarse and fine copper in minus 6- plus 4-inch feed than in minus 1- plus ½-inch feed. About 77 pct of the minus 100-mesh copper was recovered from minus 6- plus 4-inch feed, but only 27 pct of the minus 100-mesh copper was recovered from minus 1- plus ½-inch feed.


Kingston Ore
Sorting results on minus 12 plus 2-inch Kingston ore are in table 15. Copper recovery ranged from 47.0 pct for barren feed assaying 0.13 pct copper to 96. 8 pct for intermediate feed assaying 4.87 pct copper. The plot of copper recovery versus feed grade in figure 10 shows a trend for recovery to increase with feed grade. Concentrate grade also increased with feed grade (fig. 11).

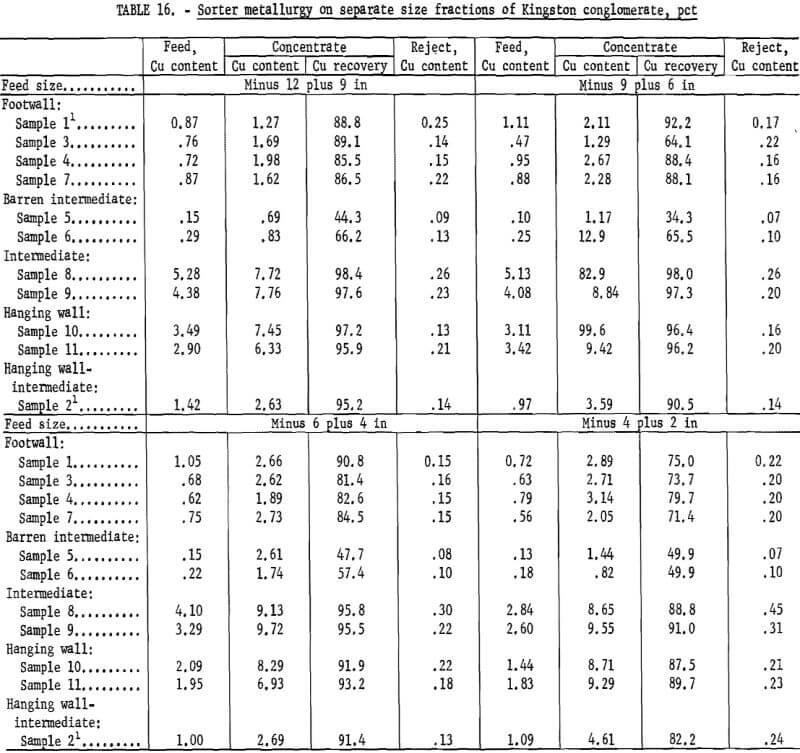
Sorter metallurgy for the separate feed size fractions is listed in table 16 and plotted in figures 12 and 13. Figure 12, a plot of sorter copper recoveries versus feed grades, shows that the highest recoveries were attained on minus 12- plus 9-inch and minus 9- plus 6-inch feed and the lowest was on minus 4- plus 2-inch feed. Figure 13, a plot of sorter concentrates against feed grades, shows that, at any equivalent feed grade in the 0.75- to 3.0-pct- copper range, minus 4- plus 2-inch feed yielded the highest grade concentrates.

Plus 100-mesh, minus 100-mesh, and minus ½-plus 0-inch copper recoveries for the separate sorter feed fractions and minus 12- plus 2-inch feed are listed in table 17. The data indicate a general trend toward better recovery as sorter feed size increased from minus 4 plus 2 inches to minus 12 plus 9 inches.
Data in table 18 show the copper distribution in the sorter products as a percentage of the total copper in the minus 12- plus 2-inch sorter feed. In addition to feed grade, the presence of coarse copper and the association of coarse and fine copper affect copper recovery. The presence of 52 to 58 pct plus 10-mesh copper in the feed accounted for the high recovery from the intermediate and hanging wall samples. Footwall materials contained 8 to 23 pct plus 10-mesh copper. The association of coarse and fine copper contributed to the relatively high recovery (80 to 83 pct) from these samples. Barren intermediate feeds contained 10 and 24 pct plus 10-mesh copper, but the fine copper was not associated with coarse copper in the concentrate, and a low recovery was achieved.
Mineral Sorting Techniques
The plant tests demonstrate the feasibility of using electronic sorting to preconcentrate native copper-bearing materials. Double-pass sorting, however, is necessary to achieve adequate recovery.
Copper size and association are found to be important in copper recovery. Tamarack conglomerate ore contained the highest percentage of fine copper and yielded the lowest recovery of the four ores. Although the Kingston ore contained less coarse copper than other samples, it yielded the highest recovery, apparently owing to the association of coarse and fine copper in the ore.
Sorter feed size also turned out to be important. Results of tests on the Champion, Winona, and Kingston ores show that the highest recoveries came from the coarsest feed size, the minus 6- plus 4-inch fraction.
Lab tests demonstrated the feasibility of using electronic sorting to reject low-grade material from coarse Kingston conglomerate ore. Of four size fractions sorted, the highest recoveries were from the two largest sizes— minus 12 plus 9 inches and minus 9 plus 6 inches-and the lowest recoveries from the smallest, minus 4 plus 2 inches.
The effects of copper particle size and association on sorter performance are reflected in the test results. Large amounts of coarse copper in the intermediate and hanging wall ore types enhanced the recovery. The footwall samples had less coarse copper, but its association with fine copper resulted in high recovery. The barren intermediate samples had the least favorable association of coarse and fine copper and had the lowest recovery.


The Bureau of Mines, in cooperation with the Institute of Mineral Research of Michigan Technological University, and the Upper Great Lakes Regional Commission, conducted an investigation of electronic sorting of native copper ore from Upper Michigan. This report is based on research by the Institute of Mineral Research under contract to the Bureau. The test program evaluated the use of belt and rotary sorters on various size and grade fractions of ore. Both plant-scale sorting and lab sorting tests were run.
The plant sorting objectives were to determine the sortability of different ores and the efficiency of the electronic ore sorters. High- and low- grade ores from both conglomerate and amygdaloid types were separated into four size fractions. The two larger sizes were sorted on belt sorters and the two smaller ones on rotary sorters. Copper recoveries ranged from 20.0 pct from a feed grade of 0.40 pct to 80.3 pct from a feed grade of 1.08 pct.
Lab sorting tests of conglomerate ore were run to determine the efficiency of a belt sorter equipped with a second sensing coil located above the belt and to determine the sorting characteristics of larger ore size fractions than those used in the plant sorting. Copper recoveries from the combined feed sizes ranged from 47.0 pct from a feed grade of 0.13 pct to 96.8 pct from a feed grade of 4.87 pct. For all the ore types except one, it was found that the copper recovery increased with the feed size.
