Table of Contents
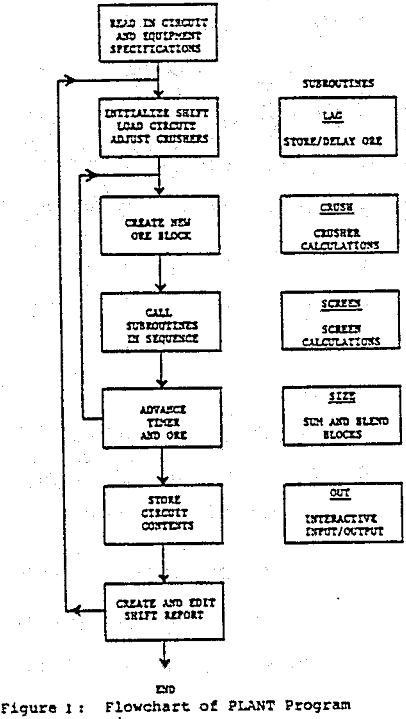
An analysis of screen design options on the operating efficiency of secondary crushing plants has been conducted using a dynamic computer model. The model allows for the simulation of a wide variety of crushing circuits and can be run on either a microcomputer (IBM PC/XT) or a large time-sharing mainframe computer. Size reduction and separation characteristics of crushers and screens are based on standard manufacturer design and performance data. Input/output routines are available in tabular, alarm or strip chart recorder modes to facilitate operation of the program.
Model Design
Calculations are based on the design considerations, performance specifications and suggested operating and control procedures of the major equipment manufacturers. The model is designed to reflect the general trends and relationships encountered in normal plant operations. Directional accuracy has been emphasized to indicate the correct trends in circuit response to changes in operating strategy and ore variation. It was considered that a rigorously accurate determination of product sizes was not warranted since intermediate products are not routinely sampled in an operating plant. When conducted, these studies produce data that are difficult to assess and require statistical adjustment to remove error.
The program has been structured in a general and adaptable way to allow the simulation of a wide range of plant capacities, equipment sizes and circuit configuration. Adjustments to individual units within a circuit can be made quickly to reflect site specific factors or to emphasize a particular facet of the operation.
When operated on a microcomputer, output can be viewed in a variety of modes. A tabular mode showing all unit power draws, feed rates and alarms is the normal configuration. Alternatively, a graphical strip chart each unit power draw and feed rate can be called to depict output for the entire shift. Alarm signals both visual and audio can be acknowledged through a separate alarm panel.
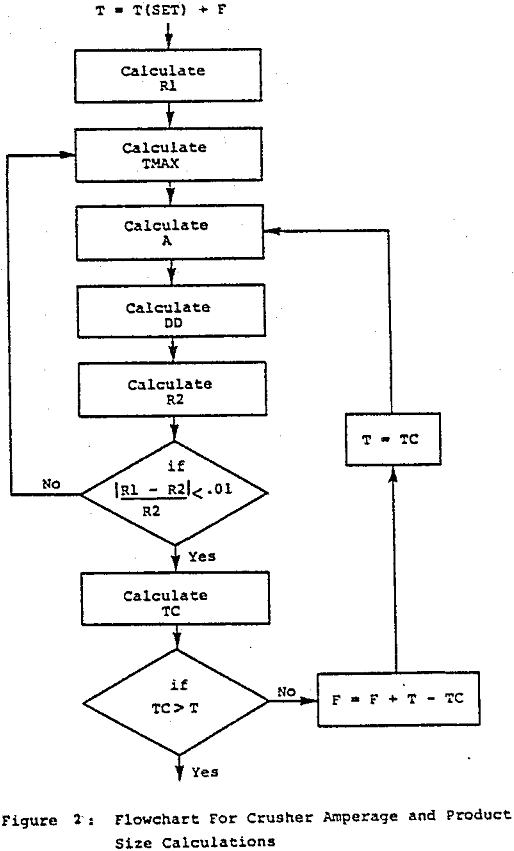
The CRUSH subroutine is capable of considering three commonly used crusher sizes in either secondary or tertiary service (1.3, 1.7 and 2.1 m). The model calculates product tonnage, product size distribution, crusher power draw and tonnage of material held up within the crusher chamber according to the flowchart.
The model is designed to demonstrate two main trends’ in the operation of a crusher: first, the generally accepted concept that product size decreases with higher power draw and secondly, that capacity or throughput can be limited either volumetrically or by available horsepower.
Screen calculations are based on the standard relationships used by manufacturers to determine screen area requirements for a given feed, a selected screen opening and a desired efficiency. For the purposes of the subroutine, where screen area and opening are set, the process is reversed so that the efficiency is calculated based on the feed and operating conditions.
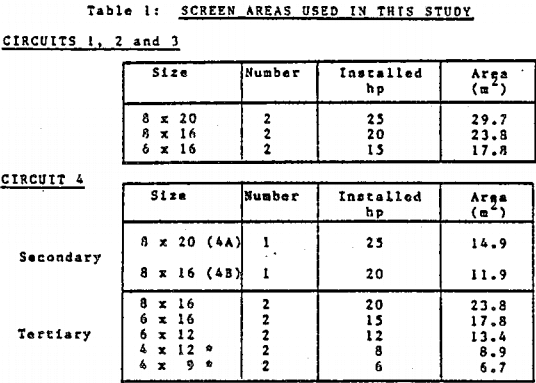
Screen amperage and overload calculations are based on the greater of either the total screen feed or the oversize tonnage. Total feed load is based on the assumption that a screen area of 14.9 m (8 ft x 20 ft) is capable of handling 1000 tph. Oversize load is based on this same screen handling 700 tph of oversize. Similar to the procedure for the crushers, a tripout due to overload conditions results in retention of material for treatment on subsequent start up. Products discharged from the various units of equipment during each cycle are summed in an appropriate manner to allow calculation of the amperages on interconnecting conveyors.
Conveyors or surge bins are represented within the system by subroutine LAG. This model provides a method to control equipment feedrates when feeders are defined as part of the circuit. Output from a preceeding operating is placed in the first block of the unit. This material is advanced one block at the completion of each cycle (first in – first out or plug flow). When used as a bin a certain degree of mixing occurs when the discharge feeder is operating.
Operating and Control Strategies
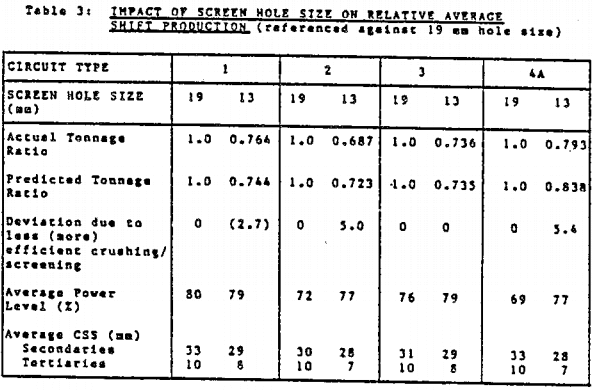
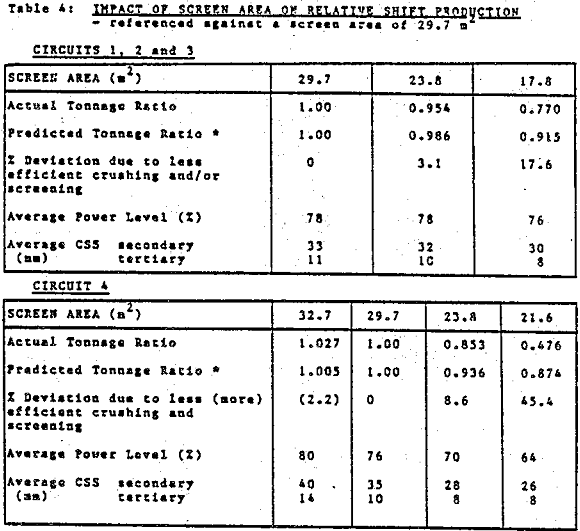
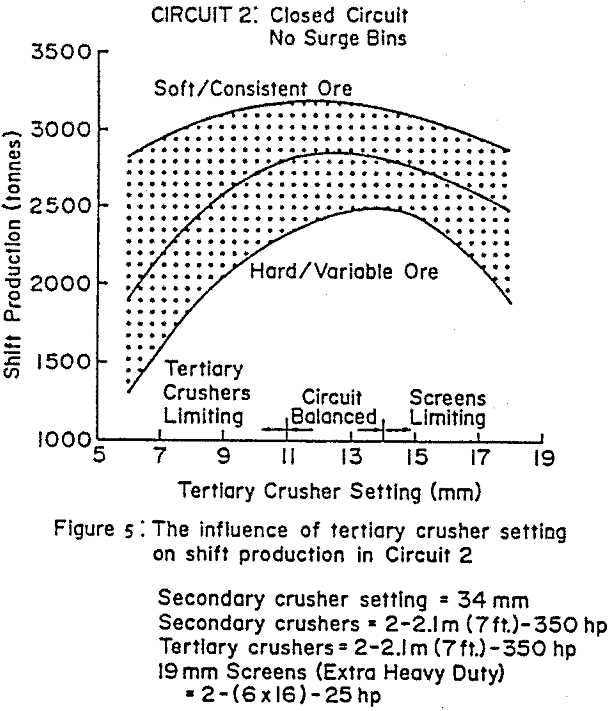
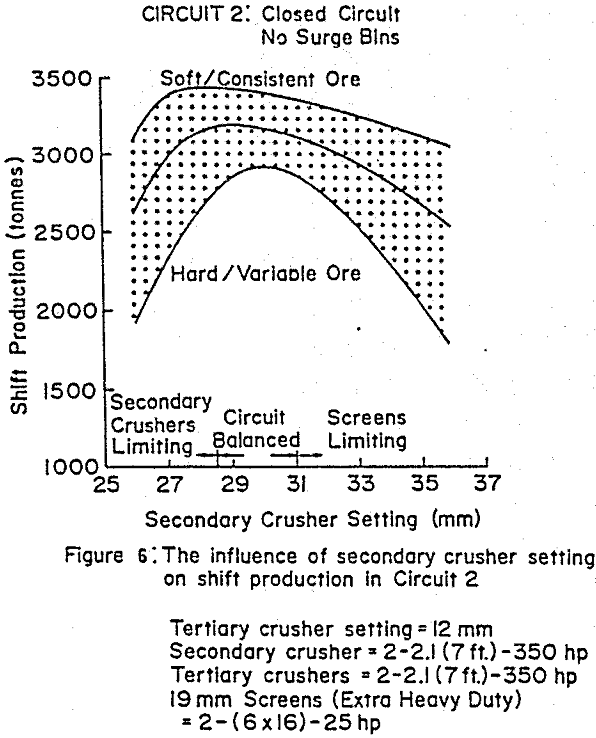
Each circuit was adjusted to optimize the crusher settings for the particular screens installed. Basically as the screen area was decreased, both the secondary and tertiary crushers were tightened to decrease the amount of oversize to be handled. Similarly when the screen hole size was changed from 19 to 13 mm, the crushers were tightened further to match the change in final product size required.
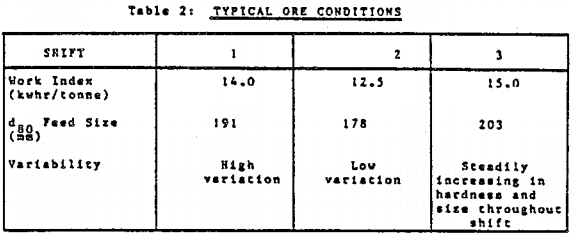
Each circuit containing the different screening equipment was operated for 3 shifts at a variety of closed side settings to establish the “best” average settings for the ore conditions and the installed screening equipment.
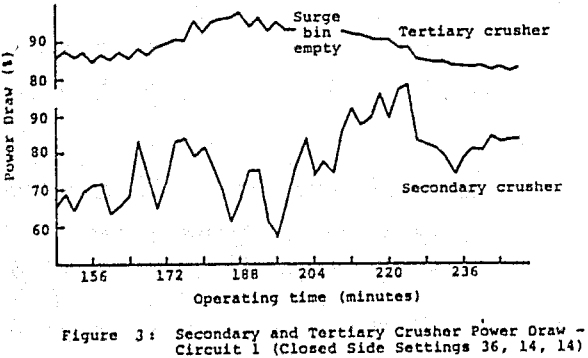
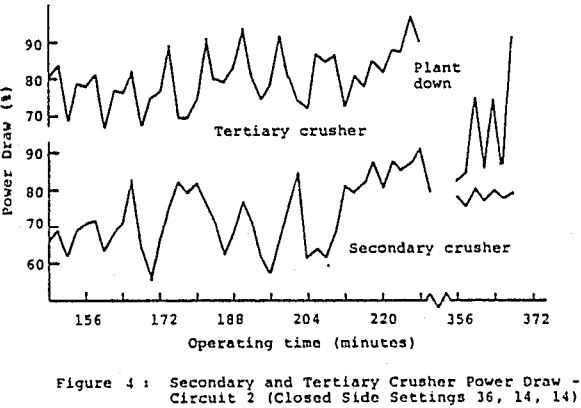
Approximately four hours into the shift, one of the tertiary crushers in Circuit 2 tripped out on high amperage resulting in the shutdown of the entire plant under full load. Two hours of operating time were required to jog the circuit empty and restart the plant. This lost time and lower power draw combined to reduce the shift throughput to 2505 tonnes for Circuit 2 as compared to 4106 tonnes for circuit 2.
Results
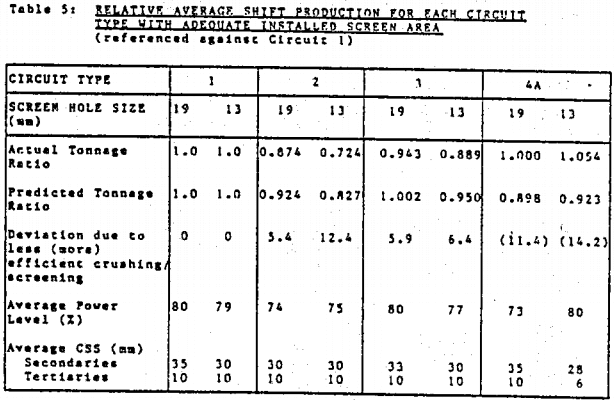
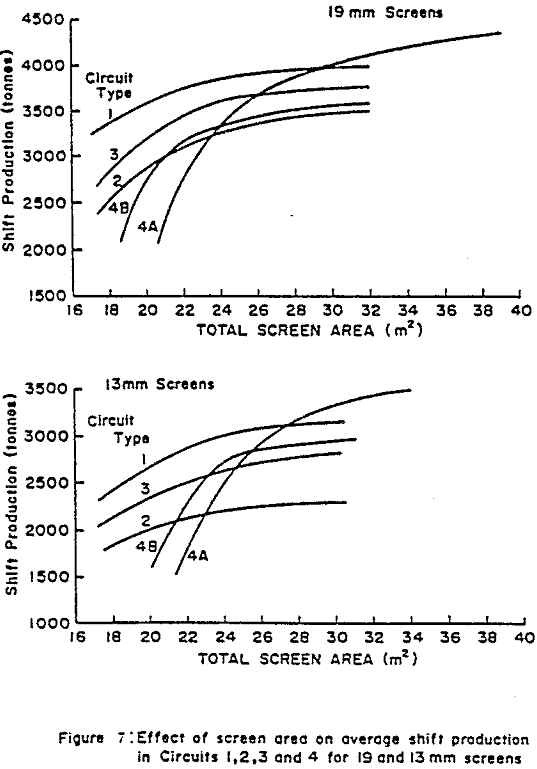
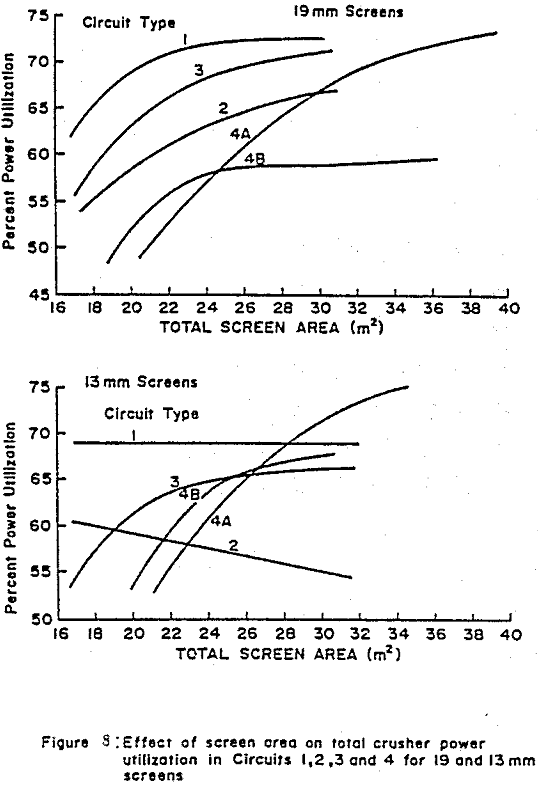
From the application of the preceding testwork with each circuit, the “best” crusher settings were selected for each screen type used. Figure 7 shows the average results achieved for each circuit. Note that Circuits 1, 2 and 3 all show similar responses with a moderately decreasing production as available screen area is reduced. Circuit 1 performs at the highest level while Circuit 2 is the poorest of the three, indicative of the influence of individual unit feed control and internal surge capacity on the efficiency of plant operations. With one internal bin and screen feedrate control, Circuit 3 falls between these two extremes.
Circuit 4 shows a higher sensitivity to screen area reductions than do the other circuits since the total reduction affects only the tertiary screens and not all of the remaining screen area is available to the tertiary crusher product. At high total screen area (>29m² ) note how the lower secondary screen area (4B) limits throughput significantly while at lower total screen area, both curves (4A and 4B) follow similar slopes, displaced by 2 m², indicative of tertiary screens limiting production.
Preliminary testwork with the model have also been conducted to examine an open circuit crushing plant containing one 2.1 m secondary crusher with a 350 hp motor, one 8×20 (14.9 m² ) double deck screen and one 2.1 m tertiary crusher with a 450 hp motor. The crushers were set to produce a final product size similar to that achieved in the above closed-circuit flowsheets and operate both units at about 75 percent power draw. At 19 mm product size, the plant produced a tonnage ratio to Circuit 1 of 0.813 compared with 0.732 predicted by the Bond formula.
