 A new procedure for determining the optimum separation for any unit operation. This procedure is based on maximization of the yield index, YI, which is the product of the yield (or valuable recovery) and gangue rejection. In addition, the characteristics of the yield index and the separation efficiency are compared and contrasted.
As indicated earlier, the separation efficiency is the difference between the recoveries of the valuable and gangue material. Mathematically, this may be represented as:
SE = Y + R-100…………………………………………………..(1)
where SE is the separation efficiency, Y and R are the yield of valuable and gangue rejection, respectively. To determine the conditions which result in the optimum separation efficiency, we may differentiate Eq. 1 with respect to the gangue rejection, and equate to zero to get:
∂Y/∂R = -1………………………………………………………..(2)
Eq. 2 suggests that the optimum separation is obtained when the incremental yield of the valuables and gangue are equal (Schulz, 1970; Agar et al. 1980). It is also noted that the point at which the slope of the yield versus gangue rejection plot is equal to minus 1 is suggestive of non-selective separation, i.e. the gangue material is associated with the matrix. This means that to determine the best possible separation using the separation efficiency criterion, we need to determine the point on the yield-gangue rejection plot where the slope is minus 1. It is obvious that with limited data, the accuracy of the procedure will be tentative at best.
In order to overcome this difficulty, the authors suggest the use of the yield index, YI, a product of the yield (or recovery of the valuable component) and the rejection of the gangue or refuse. It is a variation of the index suggested by Trustcott (1917) in tabling operations. By definition,
YI = Y x R…………………………………………………………………(3)
It is evident from Eq. 3 that the yield index will concurrently maximize the yield and the gangue rejection. It can be shown that the best separation which will concurrently maximize the yield and gangue rejection will be obtained when:
∂Y/∂R = -Y/R…………………………………………………………….(4)
There is only one point on the yield-gangue rejection plane that satisfies Eq. 4. A comparison of Eqs. 2 and 4 shows that the optimum separation will be obtained at:
Y = R…………………………………………………………………………..(5)
Thus the optimum separation can be determined in one of two ways:
(i) From a yield – gangue rejection plot, draw a line from the origin with a slope of unity. The optimum separation is determined at the intersection point.
(ii) From the yield-gangue rejection data, plot the yield index as a function of the gangue rejection. Determine the maxima of the yield index and the corresponding gangue rejection.
The efficacy of the procedure outlined above will be demonstrated using the two limiting cases:
- no liberation of the gangue mineral
- perfect separation of folly liberated gangue mineral
No Liberation of Gangue Mineral
Consider a separation in which the gangue is intrinsic to the matrix. An example of this could be organic sulfur in coal. For this special case, the gangue rejection and yield are related by the relationship:
R = (100-Y)……………………………………………………….(6)
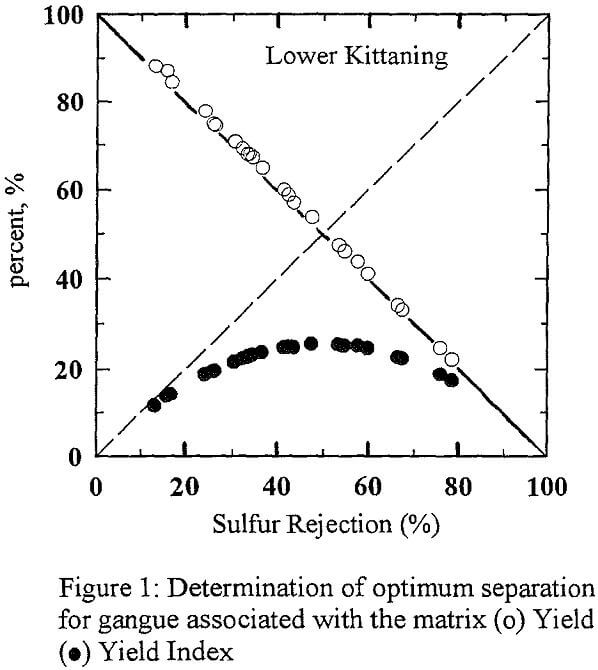
It can be shown mathematically that the maximum value of YI will be 25% and it will occur at the point:
Y=R = 50%……………………………………………………………..(7)
An example of such a separation is shown in Figure 1. It is noted that the sulfur content of the Lower Kittanning seam coal sample from Doverspike Bros. Mines (Dora 6) was 0.78%. A regression analysis of the yield-sulfur rejection data gave the following relationship:
Y = 102 – 1.02 x R……………………………………………………………(8)
with a regression coefficient of -0.9995. As a result of the linear nature of the relationship, it was concluded that the gangue component (organic sulfur) was associated with the coal (Miller et al 1994). The intercept of 102% suggests that the errors in our measurements were of the order of 2%. We can readily see that the maxima in the yield index (25%) occurs as predicted by Eq. 7. It is also noted that a line from the origin with a slope of unity will intercept the yield – sulfur rejection line at Y = R = 50%.