Table of Contents
Testing Plant Equipment: In order to determine, among other things, the operating conditions of the ball-mill when working on this rock, a test mill of about 300 T. daily capacity was erected at Duluth, Minn. The fine-crushing plant contains a Hardinge 8-ft. by 22-in. (2.4-m. by 55.8-cm.) conical mill, a 6- by 27-ft. (1.8 by 8.2-m.) Dorr duplex bowl-type classifier, a 4½-ft. (1.37-m.) standard Akins classifier, and the auxiliary machinery necessary to handle the products. Each machine is driven by an individual motor, each of which is provided with meters for measuring the power required. Over 150 tests have been made in the ball-mill, varying in duration from a few hours to several weeks, in every case being continued until operating conditions became steady. The plant is so constructed that good samples of all products can be secured, both by automatic samplers and by hand. An apron feeder governs the feed rate and the tonnage is checked in every test. Water is metered into the circuit and every precaution is taken to make the data accurate and reliable.
It is a little hard to secure a basis upon which to compare crushing results. Neither Kick’s nor Rittinger’s law of crushing is of much use in this case. This is evident when it is considered that the average size of a particle finer than 200 mesh is a matter of opinion, and that in this crushing problem practically all the ore must be crushed to pass a 200-mesh screen. The comparisons have therefore been made on the basis of kilowatt-hours per ton of material finer than 200 mesh actually produced. This, of course, does not give a scientifically exact basis for comparison, but since only the material below 200 mesh is considered finished product, in this case this is a suitable method for comparison.
On the eastern end of the Mesabi Range, in Northern Minnesota, is a large formation of siliceous rock which contains bands and fine grains of magnetite. The magnetite comprises about 35 per cent, of the rock, the remainder being chiefly quartzite and iron silicates. The rock has a specific gravity of 3.4, a hardness of 7, and is extremely tough.
This large deposit was located early in the history of the Minnesota iron-ore industry but has not been utilized because of its low percentage of iron as compared with the other Mesabi ores, and because of the difficulty and expense of any milling treatment that would concentrate the iron. An investigation, begun about 3 years ago, shows that the magnetite is finely disseminated throughout the entire formation and that there are bands or lenses of higher- and of lower-grade material, in which the magnetite and silicate are intimately mixed. As a result, the scheme of milling adopted must include a fine-crushing plant. As it is necessary to crush to 200 mesh in order to produce the desired grade of product, the fine crushing is one of the largest items of expense and for this reason has been given detailed study. It is the purpose of this paper to present some of the results of the work on fine crushing, as to both theory and practice.
Previous to fine crushing the part of the rock that contains little or no magnetite can be discarded by magnetic concentrators after each reduction in size in the dry-crushing plant. This makes it possible to fine-crush a minimum of rock and also establishes the feed to the ball-mill as below ¼ in. The fine-crushing problem, then, consists simply in crushing the rock from ¼ in. to 200 mesh at the minimum expense.
Open Circuit Grinding
The object of this test was to determine the crushing efficiency of the ball-mill when operating in open circuit. The conditions were as follows:
Feed rate, variable from 3 to 18 T. per hr.
Ball load, 28,000 lb. of 5-, 4-, 3-, and 2½-in. balls.
Speed, 19.7 r.p.m.
Ball-mill power, 88 kw.
Feed, minus ¼ in., containing 6.52 per cent, minus 200-mesh material.
Amount of solids, about 50 per cent.
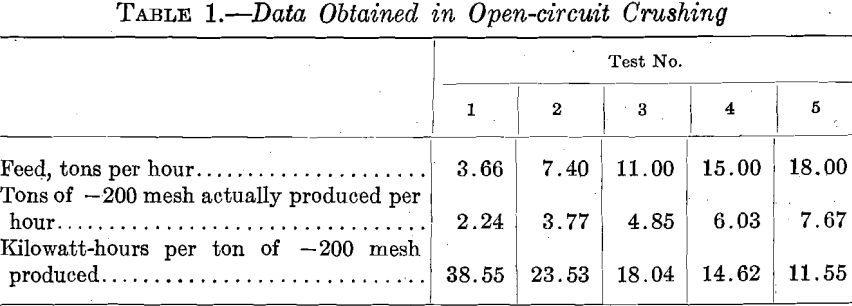
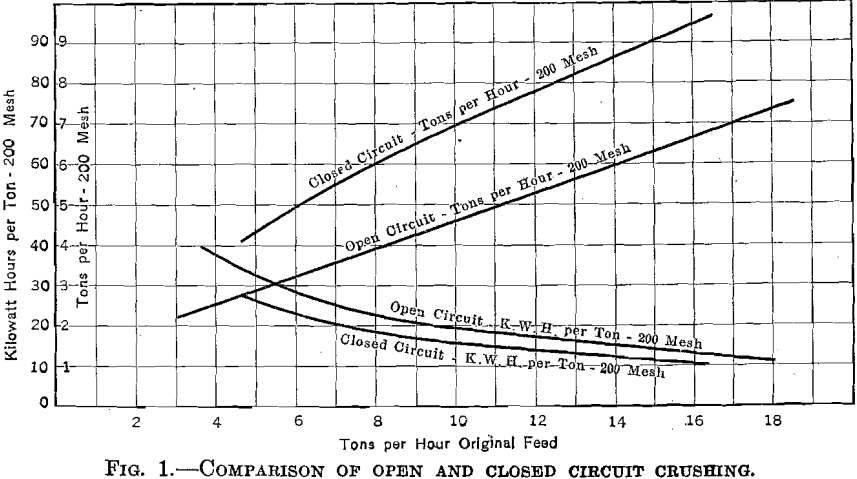
Fig. 1 shows graphically that the tonnage of minus 200-mesh material produced varies directly with the tonnage fed to the mill. There is undoubtedly some limit to this relation, but there seems to be no indication of it at 18 T. per hr. Some of the conclusions drawn from this test are that: (a) The ball-mill is naturally a machine of very large capacity; (b) if it is not possible to deliver a large tonnage of original feed to the mill, a closed circuit should be provided so that the mill may crush its own oversize.
Closed Circuit Grinding
The object of these tests was to determine the crushing efficiency of the ball-mill when crushing in closed circuit with a classifier. The conditions were as follows:
Feed rate, variable from 4 to 15 T. per hr.
Ball-mill power, 108 kw.
Ball load, 28,000 lb. of 3- and 2-in. balls.
Feed, minus ¼-in. material.
Speed, 23.8 r.p.m.
Amount of solids, about 60 per cent.
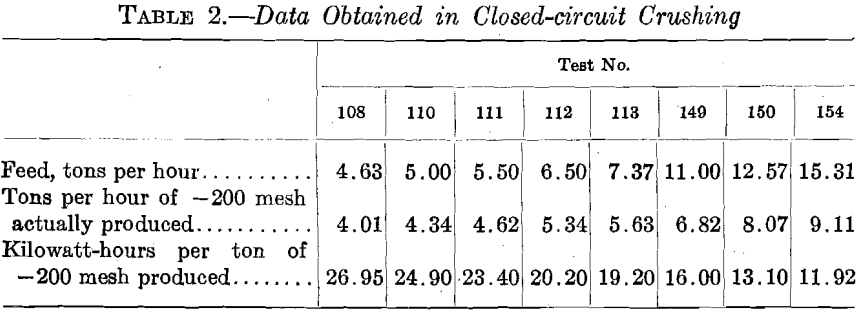
The results of these tests also are shown in Fig. 1. It is interesting to note that the curve showing tons per hour of minus 200-mesh material does not tend to flatten out as the tonnage to the mill is increased. The power per ton is also continually decreasing. It is, of course, impossible to state how much further this condition will continue, but it seems evident that it will continue for tonnages considerably beyond 15 T. per hr. As the two curves are slowly converging, at some large tonnage the amount of minus 200-mesh material produced per kilowatt-hour will be the same for either open- or closed-circuit crushing. The real advantage then gained by the closed-circuit system lies in the fact that the product consists of particles much more uniform in size. Although the average reduction in both systems may be the same, the closed-circuit will deliver a product in which the maximum-size particle will be much nearer the average size than will the open-circuit system.
The following conclusions may be stated from these two series of tests:
(a) For equal tonnages of original feed, the closed-circuit crushing system produces the greater tonnage of minus 200-mesh material per kilowatt-hour, (b) For equal tonnages of original feed, the closed- circuit system of crushing shows the greater average reduction, (c) There is no indication that the mill was operated at, or even near, a tonnage that would give the greatest number of tons of minus 200-mesh material per kilowatt-hour. (d) Closed-circuit crushing will always have the advantage over open-circuit crushing, in that the maximum-size particle produced will be much nearer the average size. This is a desirable condition since the size of the balls making up the charge must be computed on the maximum-size particles in the feed rather than the average size.
Single Stage Grinding
No. 113
The object of this test was to determine the capacity of the ball-mill crushing in closed circuit and producing 200-mesh material. The conditions were as follows:
Feed rate, 7.37 T. per hr.
Ball-mill power, 108 kw.
Classifier, Dorr duplex bowl-type.
Feed, minus ¼-in. ore.
Ball load, 28,000 lb. of 2- and 2 3/8-in. balls.
Amount of solids, about 70 per cent.
Speed, 23.8 r.p.m.
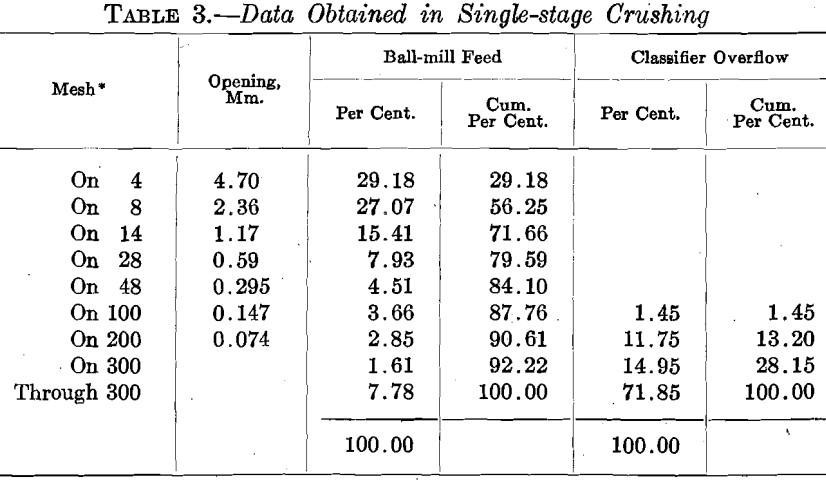
There were 5.63 T. of minus 200-mesh material actually produced per hour and 19.2 kw.-hr. per ton of minus 200-mesh material produced were required. The classifier delivered 33 T. of sand per hour. The total ball-mill feed was therefore 40.37 T. per hr. or 550 per cent, of the original feed.
Two Stage Grinding
The object of these tests was to determine the capacity of ball-mills when crushing in two stages. The conditions of the test were as follows:
First Stage of Ball Milling
Feed rate, 15.31 T. per hr.
Classifier, Dorr duplex with baffled overflow.
Ball load, 28,000 lb. of 3- and 2-in. balls.
Speed, 23.8 r.p.m.
Ball-mill power, 108 kw.
Second Stage of Ball Milling
Feed rate, 6.54 T. per hr.
Classifier, Dorr duplex.
Ball load, 28,000 lb. of 2- and 1-in. balls.
Speed, 23.8 r.p.m.
Ball-mill power, 108 kw.
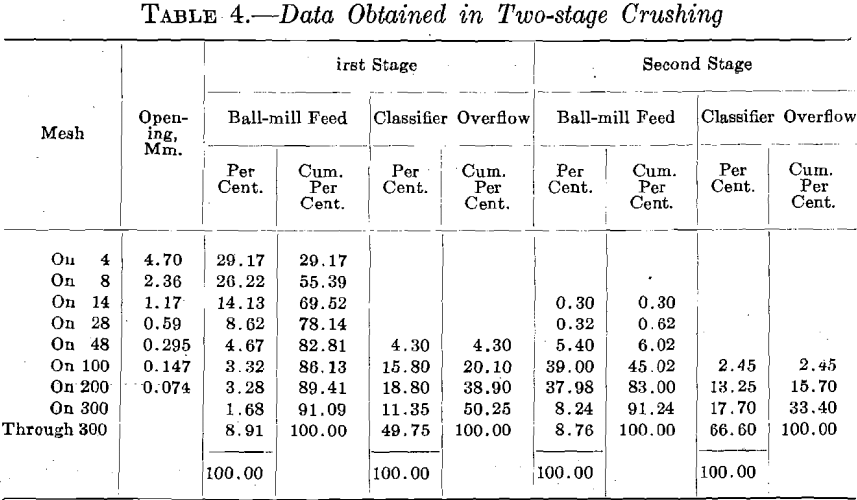
In the first stage, 9.11 T. of minus 200-mesh material were produced per hour and 11.98 kw.-hr. were required for each ton of minus 200-mesh material produced. The classifier delivered 32 T. of sand per hour. The total feed to the mill was therefore 47.31 T. per hr. or 308 per cent, of the original feed. The classifier overflow was reclassified, most of the material below 200 mesh being discharged from the crushing circuit while the sands were fed to the second stage. In this stage 3.73 T. of minus 200-mesh material were produced per hour and 28.9 kw.-hr. were required for each ton of minus 200-mesh material produced.
The classifier delivered 5 T. of sand per. hour. The total feed to the ball-mill was therefore 11.54 T. per hr. or 179 per cent, of the original feed. It was evident that the ball-mill was greatly underloaded in this test, but so much trouble developed in the classifier, due to the tendency of the sands to slip down the slopes, that a more rapid feed was not attempted at this time. The classifier had been set at a slope of 1½ in. per ft. (125 mm. per m.) and conditions were such that the slope could not be decreased. It was impossible also to use the bowl overflow at this flat slope without rebuilding the classifier. At the present writing this work has not been completed. It seems certain, however, that the ball-mill will crush to 200 mesh a considerably greater tonnage when the proper classification is provided. Since in previous tests the mill has crushed 7½ T. per hr. from ¼ in. to 200 mesh, it seems possible that it will crush at least 8 T. per hr. from 48 to 200 mesh.
Comparing single- and double-stage crushing on the basis of these two tests, it appears that the single-stage crushing produces a ton of minus 200-mesh material for 19.2 kw.-hr. while double-stage crushing produces a ton of minus 200-mesh material for 16.8 kw.-hr. These figures, though, do not show the real relative efficiencies of the two systems, for the second stage of the two-stage system was so obviously underloaded. The conclusions drawn from these tests are that (a) two-stage crushing shows a greater efficiency than single-stage, (b) two-stage crushing is much more flexible and offers greater possibilities for improvement than does single stage. In addition, a considerable amount of tailing can be discarded between the stages.
Large VS Small Grinding Balls
Two tests with closed-circuit crushing are reported to show the efficiency of the ball-mill when charged with large and with small balls.
Test No. 12 shows a production of 6.3 T. of minus 200-mesh material per hour, which is 17.15 kw.-hr. per ton of this material actually produced. Test No. 150 shows a production of 8.07 T. of minus 200-mesh material per hour, which is 13.10 kw.-hr. per ton of this material actually produced. These two tests clearly indicate the superiority of small balls. It is instructive to compare the classifier sands in these two tests (see Table 0).
It appears that the small balls produced a much more uniform sand than did the large balls. The evident crowding of material at certain sizes is almost entirely absent in the small-ball test. Since this classifier sand is composed of the particles of ore that have passed through the mill at least once without being crushed, it appears that the large balls
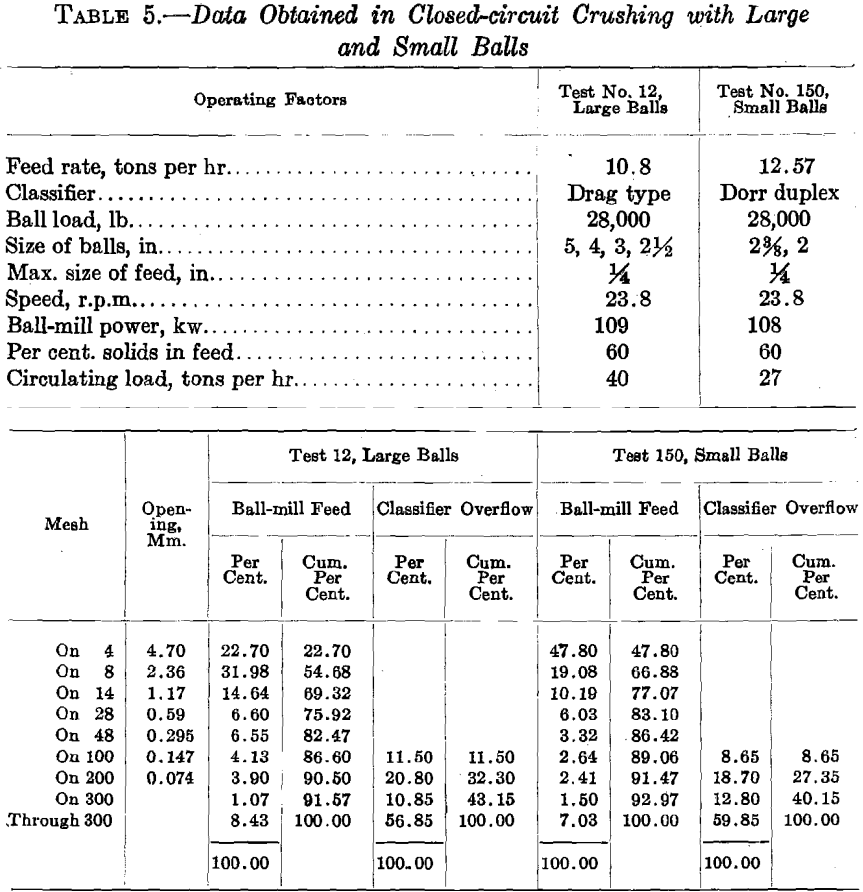
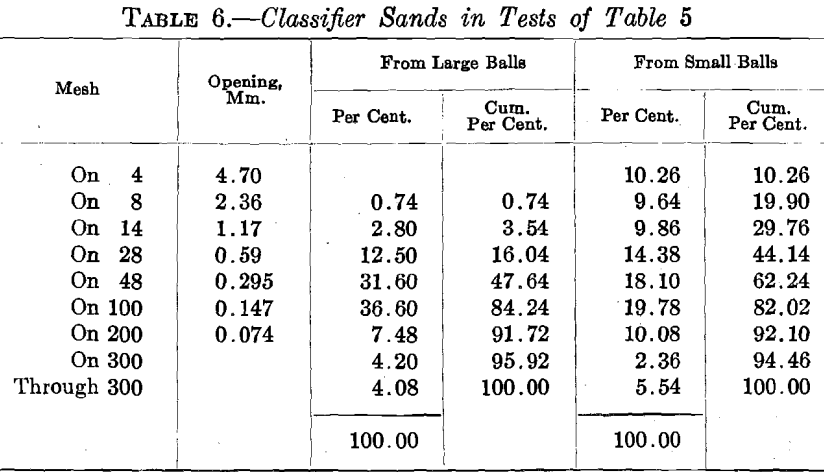
reduce the coarse particles very readily but have trouble in crushing the finer particles. On the other hand, the small balls appear to crush all particles equally well. From this it would seem to be possible, by an analysis of the classifier sands, to determine whether or not the balls are too large or too small for the work they are doing. If the screen analysis of the sands is crowded on the upper end, the balls are too small; if it is crowded at the approximate size of the overflow, the balls are too large. The best results have been obtained when the screen analysis of the sands is about uniform between the size of the original feed and the size of the overflow.
Relation between Speed of Mill & Size of Balls in Mill
Improper mill speed seems to be indicated in the same way. Table 7 shows screen analyses of classifier sands from tests in which only the speed of the mill was changed.
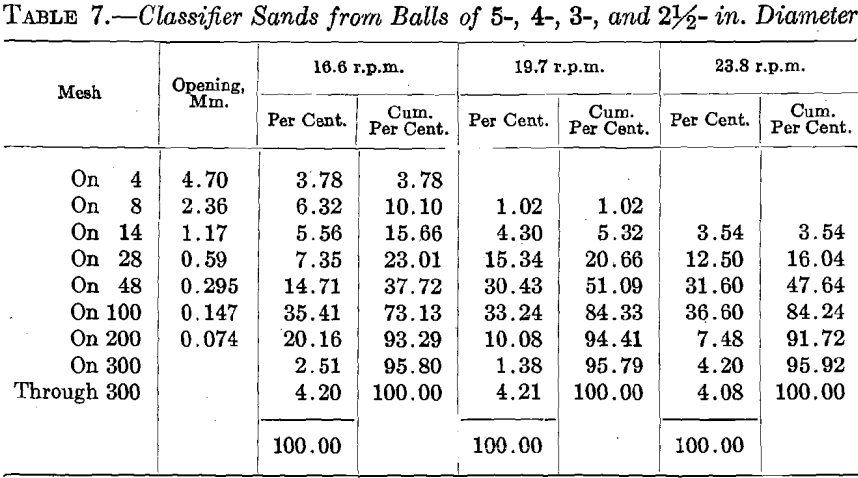
The balls were so much too large that a reduction in speed to 16.6 r.p.m. could not compensate for them. In the next tests the balls were more nearly of the proper diameter for the work to be done.
In the tests shown in Table 9, in which balls of 2½-, 2-, and 1½-in. diameter (63.5, 50.8, and 38.1 mm.) were used, the tonnage also being increased, the effect of a change in speed is much more marked.
In the preceding test, at 19.8 r.p.m. the circulating load became so large, over 60 T. per hr., that operation had to be discontinued, for the
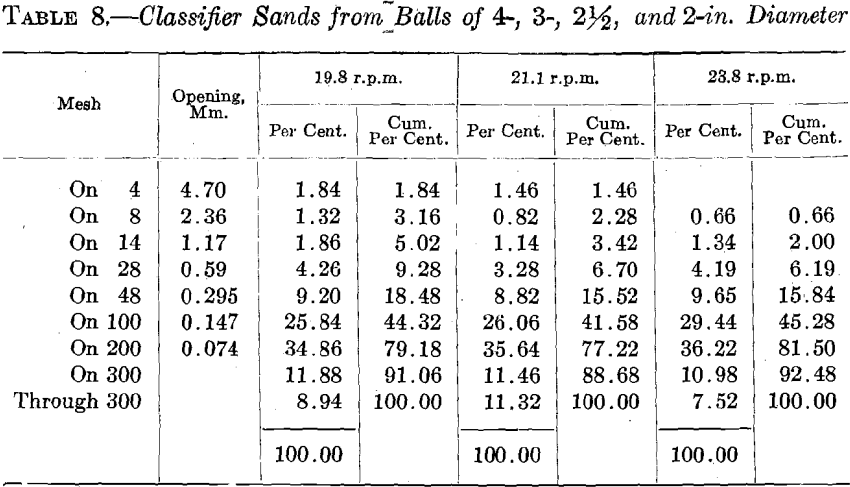
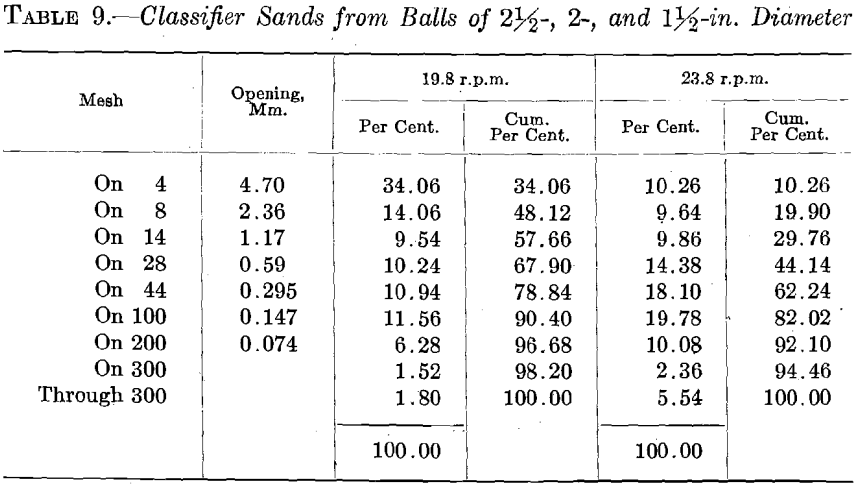
mill was unable to handle the coarse ore. The obvious conclusion is that either the speed of the mill should be increased slightly or balls of a little larger diameter should be used. At 23.8 r.p.m. the sands were nearly uniform and at this speed the mill showed the greatest efficiency.
In order to show the marked effect of a slight change in the average size of balls, the two tests shown in Table 10 are reported, in which all conditions were the same except the size of balls.
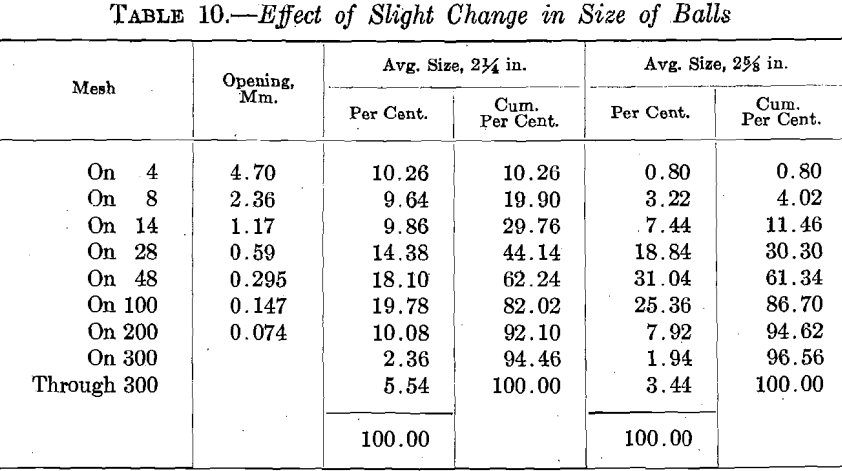
From this series of tests the following conclusions may be drawn:
(a) If the balls are large or the speed of the mill is high, crowding will appear at the finer sizes in the classifier sands.
(b) If the balls are small or the speed is low, crowding will appear at the coarser sizes in the classifier sands.
(c) The indications are that best efficiency is obtained when the screen analysis of the sands shows a minimum of crowding at any size. This statement has not been proved conclusively, however.
Deductions from Operating Tests
The foregoing tests are only a few of the more important ones that were made. Over 150 tests have been made altogether, and it may be of value to state some of the general conclusions from them.
- In every case an increase in the tonnage fed to the mill resulted in an increase in the efficiency.
- In every test the limiting factor of the test was not the ball-mill but some auxiliary apparatus, usually the classifier.
- All tests point to the fact that the ball-mill is a machine, of very large capacity, especially if it is provided with proper auxiliary apparatus.
- Classifying and pulp-handling machines that will handle a circulating load of at least 500 per cent, of the original feed should be provided.
- Closed-circuit crushing is more desirable than open-circuit.
- The real advantage in closed-circuit crushing lies in the fact that the maximum size of particle is nearer the average size of particle discharged from the circuit.
- Two-stage crushing is more efficient than single-stage.
- The real advantage in two-stage crushing lies in the fact that the ball charges can be adjusted more nearly to the required conditions.
- Two-stage open-circuit crushing does not present this advantage, as the maximum-sized particle in both stages is more nearly the same.
- The proper adjustment between size of balls and speed of mill can be secured by an examination of the classifier sands.
- If the balls are large or the speed is high, the screen analysis of the classifier sands will be crowded at the finer sizes.
- If the balls are small or the speed is low, the screen analysis of the classifier sands will be crowded at the coarser sizes.
- From the data at hand, the indications are that the best efficiency is obtained when the screen analysis of the classifier sands shows a minimum of crowding at any size.
- Balls no larger than necessary should be used, as this makes it possible to charge the mill with the greatest number of balls.
- Balls smaller than can crush the larger particles of ore should not be kept in the mill as they take up space, absorb power, and do inefficient crushing.
Design & Regulation of a Fine Crushing Plant
In view of these conclusions and the test data at hand, it is interesting to outline the manner in which a fine-crushing plant may be designed. In this discussion, the following limitations are imposed:
(a) The first cost of the plant must not be excessive.
(b) Since the experiments were made with a Hardinge mill and a Dorr classifier, these are given first consideration herein, although not necessarily the best adapted for the work to be done.
(c) The plant is to receive a feed and deliver a final product approximately as shown in Table 11.
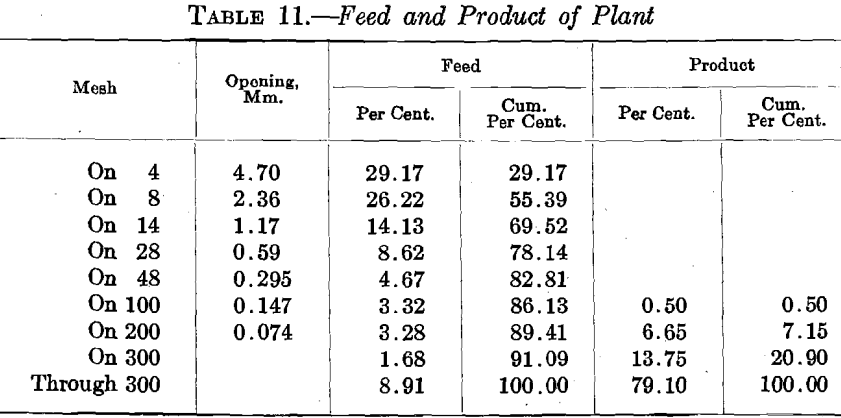
The flow sheet shown in Fig. 2 has been designed to meet these requirements. Its most conspicuous feature is the large number of classifiers; possibly there are too many, but in all tests the limiting factor has been the capacity of these machines. 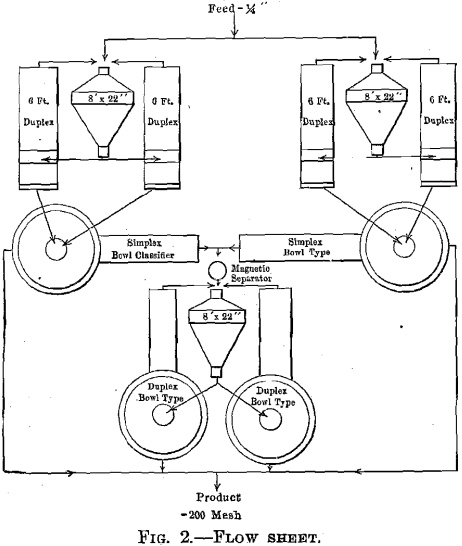 It is estimated that the capacity of this plant will be 720 T. per day, receiving a feed and delivering a product as shown. The plant will require 344 kw. at the switchboard, which Will be 11.5 kw.-hr. per ton of ore crushed, or 14 kw.-hr. per ton of minus 200-mesh material actually produced. This is not an extremely low figure as better results have been obtained many times in the tests.
The 720 T. per day, or 30 T. per hr., of original feed will divide to the various units in the following manner: Each first-stage ball-mill will crush 15 T. per hr. to minus 48 mesh. This 15 T. will pass into the Simplex bowl-type classifier, where 10 T. will overflow as finished product; the 5 T. of sand, with the 5 T. of sand from the second Simplex bowl-type classifier, will constitute the feed to the second-stage ball-mill. The test data indicate that this can be accomplished with one classifier in closed circuit with each ball-mill. By adding the second classifier, as shown, it is expected that the tonnage can be increased at least 25 per cent. In order to maintain this feed rate, it will be necessary to maintain carefully the proper ball charge in each mill. A slight increase or decrease in the average size of the balls making up the charge will cause a large loss in efficiency and a corresponding reduction in tonnage.
If balls 3 in. (76.2 mm.) in diameter are fed to the first-stage mills and if all balls less than 2 in. (50.8 mm.) in diameter are removed from the mills regularly, the average size of the balls forming the working charge will be 2.499 in. (63.47 mm.), which is about the size indicated in the tests as giving the best results. The working ball charge in the mill will be as shown in Table 12.
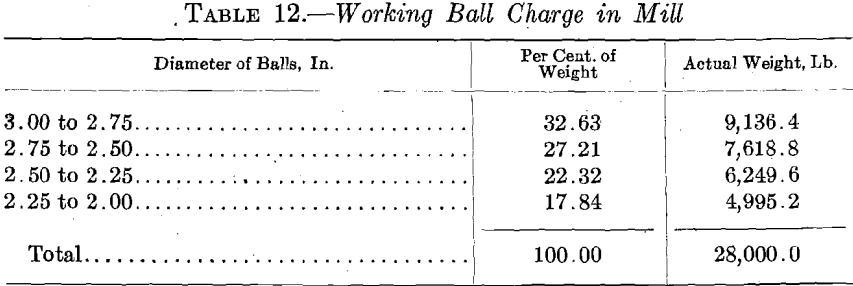
Suppose that once every week the mills are stopped and all balls less than 2 in. in diameter are removed. If the ball wear is 2 lb. per ton of ore crushed, this will amount to 720 lb. (326.5 kg.) per day for each mill. This is actual wear and takes no account of the small balls that are removed. Then, since the working charge is to comprise balls from 3 in. (76.2 mm.) to 2 in. (50.8 mm.) in diameter, the amount of wear secured from each ball will be 2.89 lb. (1.31 kg.) and the 720 lb. of wear per day will be taken care of by the reduction in diameter of 249 balls per day from 3 in. to 2 in. It will then be necessary actually to charge 249 three-inch balls, or 1020 lb. (462.6 kg.) per day.
It is evident that some of the minus 2-in. balls that will be removed after seven days will be smaller than others. It may be computed by methods hereinafter described that the smallest ball will be 1.92 in. (48.7 mm.) in diameter. Then if 249 three-inch balls are charged at the beginning of each day, at the end of each day 249 balls will have been worn to a diameter of less than 2 in. At the end of seven days there will be 1743 balls of diameter between 2 and 1.92 in., which will weigh 1995 lb. (904.9 kg.) and will be removed from the mill. As the operation of each of the first-stage mills will consist in charging 249 three-inch balls each day, the mill charge will gain in weight each day until at the end of seven days it will have gained 1995 lb. and will therefore weigh 29,995 lb. At the end of the seven days, however, the 1995 lb. of balls smaller than 2 in. will be removed, leaving the original 28,000 lb. working charge, as at the beginning of the week.
Since in this flow sheet there are two first-stage mills, there will be formed 3990 lb, (1809.8 kg.) of balls per week of average diameter 1.96 in. (49.7 mm.). These 3990 balls will be used up each week in the daily charges of balls to the second-stage mill. In order to have a balanced condition, it will be necessary to charge these balls at the same rate as that at which they are made, or 498 balls per day. These 498 balls, weighing 571 lb. (259 kg.), will constitute the daily charge to the second-stage mill. This mill is to handle 240 tons of ore per day and the steel consumption at 2 lb. (0.9 kg.) per ton will be 480 lb. (217 kg.) per day. Since 498 balls, weighing 571 lb., are to be added to the mill each day, 498 balls weighing 91 lb. (41 kg.) should be removed each day. These 498 balls will weigh 0.1827 lb. (0.08 kg.) each and will be 1.06 in. (26.9 mm.) in diameter. At regular intervals all balls less than 1 in. in diameter should be removed from the second-stage mill.
It is now possible to compute the screen analysis of the working charge of balls in the second-stage mill (see Table 13).
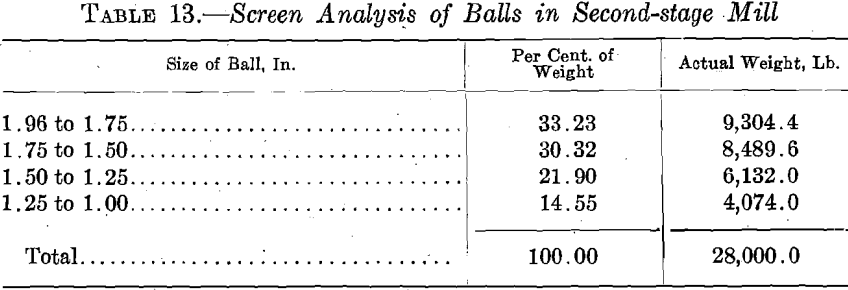
If the ball charge in the second-stage mill is screened once a month, there will be 14,940 balls less than 1 in. in diameter to remove. The smallest ball will be 0.85 in. (21.59 mm.) in diameter and the largest ball will be 1 in. The total weight of the balls removed at the end of the month will be 1825 lb. (824.8 kg.). The removal of this weight of small balls will again produce the original charge that is shown in the above screen analysis. Of course, if the ball wear is not 2 lb. per ton, as assumed, these figures will not hold. However, as soon as the correct ball wear is found, it will be possible to determine by this method the exact figures that will make it possible to maintain the proper ball charge and the balance between the different mills at all times. As a result in the design of this fine-crushing plant, provision should be made for sizing the ball charges of the first-stage mills each week and of the second-stage mill each month. It can then be done with a very small amount of lost time.
The chief advantages in this flow sheet are: Good efficiency as to the power expended; large tonnage for the capital invested; and flexibility. By adjusting the overflow end of the classifier in the first stage, the load can be balanced perfectly between the two crushing stages.
Mechanics inside a Ball Mill
In the endeavor to determine the best working conditions for the ball-mill, a detailed mathematical study was made of the action of the ball charge. While the data taken from a properly conducted test are convincing, an engineer sometimes prefers a mathematical proof. Test data contain a large personal factor, not only of manipulation but also of the person reporting the results. In the case of ball-mill crushing the amount of available data is enormous and, by careful selection, nearly any statement can be “proved.” For this reason, a consideration which is entirely theoretical and devoid of any personal element would seem to be desirable and instructive.
It is evident that the ball inside a revolving mill must act according to some exact regulating force which governs its every motion. There are three important variables to consider: the speed of the mill, its size, and the size of the ball charge, and it will be the aim of this discussion to show the relation existing between these variables.
Action of Charge at Slow Speed
Any loose charge piled up in a cone will assume a certain definite critical angle, usually called the angle of repose. If more of the charge is added to the top of the cone, this will be increased in size but the same critical angle will be maintained. This is what happens inside a mill revolving at very low speeds. The charge is tilted until the critical angle is reached, after which the balls simply roll down the slope to the lower side of the mill. This critical angle is affected but slightly by a change in the speed of the mill, up to a certain point; the increase in speed simply increases the rapidity with which the charge is raised to the top of the incline. In this condition the balls are in contact with one another except as they may bounce in rolling down the slope of the charge; also, the balls must roll down the incline at the same rate, pounds per hour, at which they are raised to the top. Then, with a mill half full of balls, any particular ball will roll down the incline something less than twice per revolution of the mill.
As the speed of the mill is slowly increased, the time required to bring the ball back to the top of the pile is diminished, but the time required by it in rolling down remains practically the same. It would seem then that the whole problem of crushing would resolve itself into getting the balls to the top of the heap fast enough. This would be true if it were not for centrifugal force and inertia. As the speed of the mill is increased these two forces grow very rapidly in importance.
Motion of Charge at Higher Mill Speed
Consider the forces acting on a particle p, Fig. 3, in contact with the lining of the mill. The centrifugal force c acts to press it against the lining while w1, a component of the weight w, acts to pull it away from the lining. Then if α1 is the angle between the vertical axis and the radius op, w1 = w cos α1. It is possible for c to be greater than, equal to, or less than w1 or w cos α1 for as α1 decreases w1 increases. Then c — w cos α1 = f1, and f1 may be positive, negative or zero. If f1 is positive the particle will be held against the lining of the mill. As α1 decreases f1 decreases and if, when is zero, f1 is still positive, it is evident that the particle will maintain its contact with the mill lining throughout a complete revolution.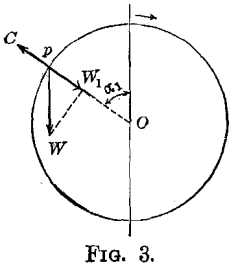
If f1 becomes zero for some value of α1 the particles below p1, having a greater angle α, will be held against the lining of the mill by a positive force f. In other words, as the mill rotates, the force with which a particle p is held in position decreases until it reaches zero. At this point the particle is being pushed on by the particles below it and is free to move in a path governed by this initial velocity and gravity. The path it takes will, of course, be parabolic. Then when the angle α is such that f is zero, the particle p will leave off contact with the mill and start on a parabolic path. In this position c = w cos α.
The centrifugal force c = wv²/rg, where w = weight of particle; v = initial velocity; r = radius; and g = 32.2 ft. per sec. per sec. Also the initial velocity of the particle is its velocity in the circular path, or v = 2πrn in which n = speed of mill in revolutions per second. Then by substitution in the formula c = w cos α,
wv²/rg = w cos α, or w(2πrn)²/rg = w cos α, or
cos α = 4π²rn²/g……………………………………..(1)
From this equation it is evident that an increase in either the speed of the mill or its radius will cause a decrease in the angle α and the parabolic path will not start until the particle is carried farther around in the direction of rotation. At any speed n,
cos α = kr……………………………………………(2)
in which k = 1.226n². Then at constant speed, the particle p nearer the center of the circle than p1 will start on its parabolic path from a larger angle α, or as r decreases α increases, the relation between r and α given in equation (2) always holding true when α is the angle at which the parabolic path starts. Equation (2), then, is really the equation of the curve above which all particles are following the parabolic path and below which all particles are following the circular path.
From equation (1) n = √g cos α/4π²r and if the radius is considered as the constant, α must decrease as n increases. Since the minimum value of α is zero, when cos α = 1, the speed has reached a point above which c is always greater than w cos α (Fig. 3), and the particle will cling to the lining of the mill throughout the complete cycle. Then the speed at which any particle of radius r will cling is given by the equation n = √g/4π²r in which n is in revolutions per second and r is in feet. If the speed is in revolutions per minute the equation will become
N¹ = 54.19/√r………………………………….(3)
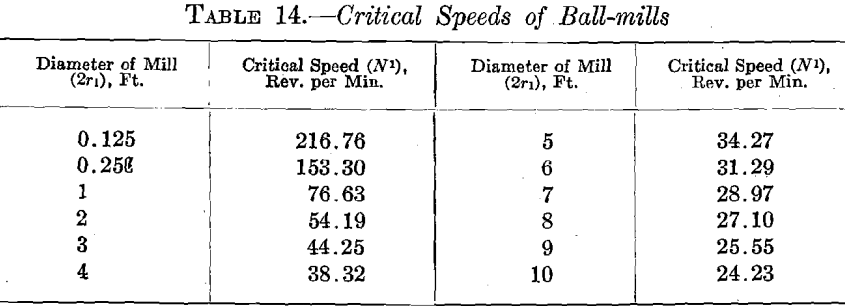
This equation shows the critical speed N¹ at which the particle of radius r will cling to the lining of the mill or to the next outer layer of particles of radius greater than r. If N¹ is sufficiently large, r will be sufficiently small to include all of the balls in the mill and the mill will rotate as a flywheel with no relative motion between the particles in the charge. Table 14 shows the speed at which the first particle will cling to the lining of the mill.
Parabolic Paths of Falling Particles
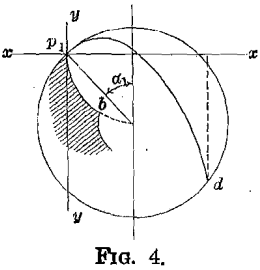 Below the critical speed given in equation (3), the particle of radius r will reach the critical angle a and will then start on its parabolic path. The next consideration is to determine where the particle p1 will strike the lining of the mill at the end of its parabolic path.
In Fig. 4, the equation of the parabola, origin at p1, is y = x tan α1 – gx²/2V1²cos²α1 and the equation of the circle of the mill, origin p1, is x² + y² — (2r1 sin «i) x 4- (2ri cos α1) y = 0.
The simultaneous solution of these two equations will give the co-ordinates of the point d, where the two curves intersect. Substituting the value of y from the equation of the parabola in the equation of the circle and then simplifying, the following equations are secured:
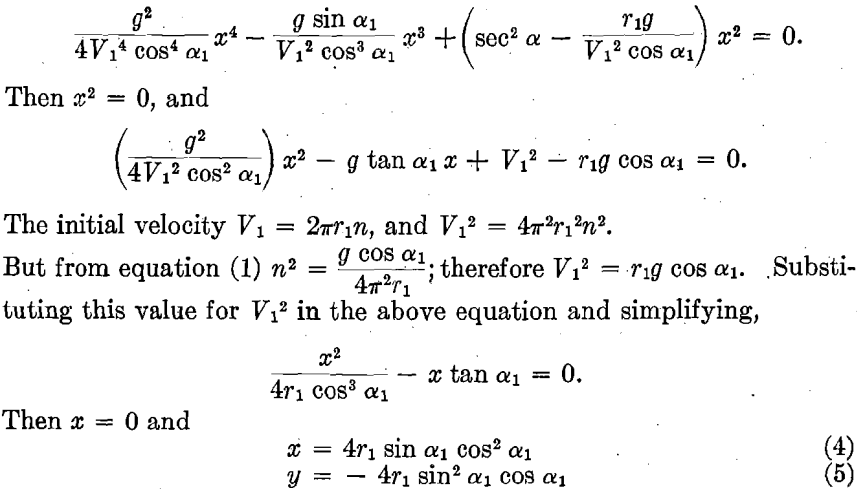
These are the coordinates of the point d, at which the particle p1 will strike at the end of its parabolic path. From the above solution, it is seen that there are, in general, four points of intersection between the two curves. In this case, however, only one of these intersections requires consideration, the other three being zero. This is a very important fact, for if this condition did not exist the paths of travel of the various particles would cross and recross one another, resulting in a large friction loss above the pulp level in the mill and the performance of little or no crushing.
Application to a Definite Problem
It is now possible to draw the outline of the charge in the mill under operating conditions. Consider an 8-ft. mill running at 24 r.p.m. From equation (2) cos α = 1.226 x 24² x r/3600 = 0.1962r, which is the equation of a circle of radius 0.408/n². The center is then vertical axis 0.408/n² units above the center of the mill. From this the value of α in Table. 15 can be computed:

From the values of r and a, the curve aO, Fig. 5, can be drawn, which is the dividing line between the parabolic path and the circular path of the particles. Then by use of equations (4) and (5) it is possible to find any number of points on the curve cd. This may be done more simply by drawing the circle through the point e and then measuring a distance z to a vertical line which will intersect the circle at the desired point f as in Fig. 5. For this purpose, the corresponding values of x are added to the preceding table.
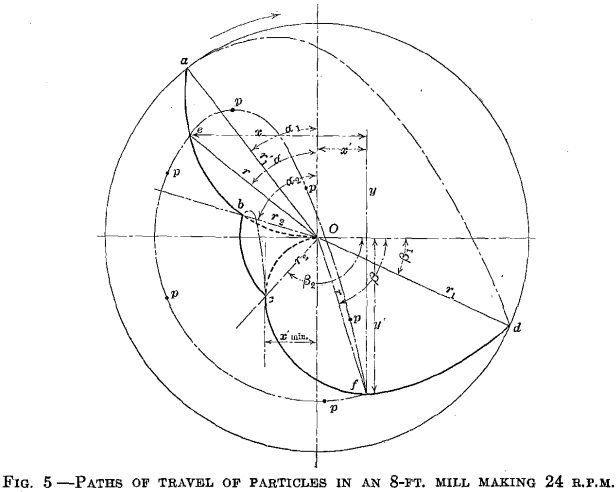
It is then possible to draw the line Od, which is the dividing line between the parabolic path and the circular path for all particles of the charge. The complete cycle of any particle p is then seen to be from e to f along the parabolic path, and then from f to e along the circular path. From Fig. 5 it is evident that the particle p acts exactly as though it were in a mill of radius r, the lining of which is the layer of particles of radius next larger than r.
Since, as has been shown,
x = 4r sin a cos² a and y = — 4r sin² α cos a,
from Fig. 5, x’ = 4r sin a cos² a — r sin a,
and y’ = 4r sin² a cos a — r cos a.
As the value of r at which a particle starts on its parabolic path and ends its parabolic path is the same, then
sin β = y1/r = 4r sin2 a cos a — r cos a/r = —(4 cos³ α – 3 cos α)
Then sin β = — cos 3a; but — cos 3a = cos (180° — 3a) and sin β = cos (90° – β); then cos (90° – β) = cos (180° – 3a), or 90° – β = 180° – 3a; or 90° — β = 180° — 3a; hence — β = 90° — 3a,
or β = 3a — 90°…………………………………..(6)
From Fig. 5 it is evident that when a has increased beyond a certain large value, the parabolic paths of the balls near the center of the mill will overlap, thus causing interference. The balls will then be striking together at a point so near the maximum pulp level that little or no effective crushing can be done. It is thus obvious that the size of the charge should be so regulated that this interference shall not occur. It appears from Fig. 5 that this limiting condition occurs when x’ is a minimum, or is equal to its largest negative value.
Then since x’ = 4r sin a cos² a — r sin a, or eliminating r by use of the equation, r = g/4π²n² cos a,
x’ = g/π²n² (sin a cos³ a — ¼ sin a cos a).
dx’ = g/π²n² (cos4 a — 3 sin² a cos² a — ¼ cos² a + ¼ sin² a).
For maximum and minimum values of x’, dx’ = 0.
Thus 4 cos4 a — 7/2 cos2 a + ¼ = 0;
whence cos a = 0.8925 and 0.2801,
and a = 26°49′ and 73°44′ (7)
From equation (6), β = — 9°33′ and 131°12′.
The larger result is obviously the one desired, the smaller one being the value that makes x’ a maximum. From this it appears that the largest charge that can be used in the mill without definite interference between the particles is when angle a2 = 73°44′ and β2 = 131°12′. If the inner radius of the charge, corresponding to a2 = 73°44′, is r2, then cos 73°44′ = 1.226n²r2 or r2 = 0.2283/n² which is the smallest value that r2 should have at any speed.
Blow Struck by Falling Particle
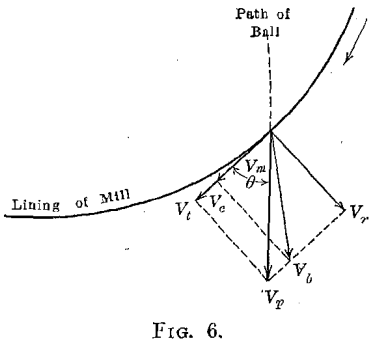
In order to determine at what angle a the maximum effective blow will be delivered by the particle when it strikes the surface of the mill, it is necessary to find the resultant velocity of the particle relative to the lining of the mill. Fig. 6 shows the resultant velocities and their components.
Vp = velocity of point on parabola;
Vc = velocity of point on mill;
Vt = component of Vp in direction of Ve, with mill stationary;
Vm = component of VP in direction of Vc, with mill revolving;
Vr = component of Vp perpendicular to Vc;
θ = angle between Vc and VP;
Vt = velocity that produces blow; or the velocity of’ particle relative to lining of mill.
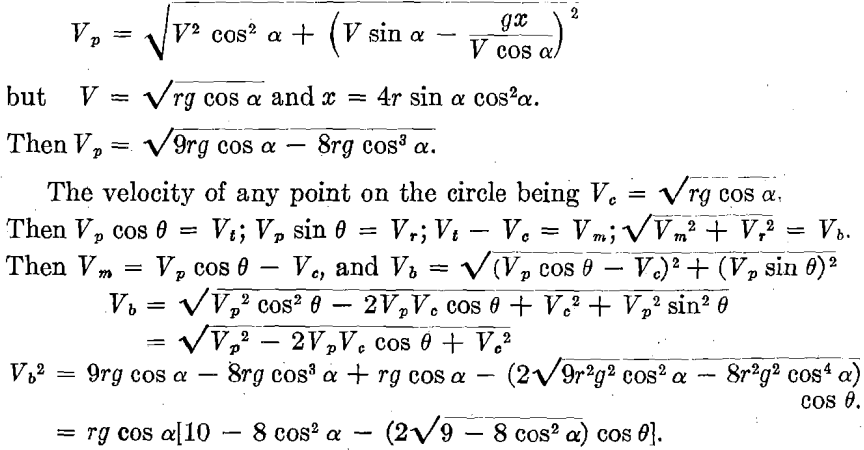
It has been shown that the initial velocity of any particle when it started on its parabolic path is given by the equation V = √rg cos a. This is the velocity in the circular path of a particle of radius r. The velocity of any point on the parabola is given by the equation
In order to determine the angle θ it is necessary to find the angle at which the circle and parabola intersect. This is done by computing the slopes of the tangents to both curves at this point and then the angle between these tangents. As the slope of the tangent is the first derivative of the equation of the curve, the slope of the tangent to the circle is
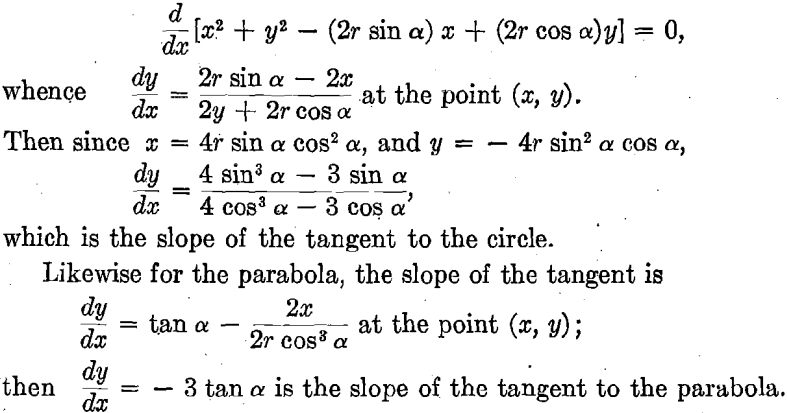
which is the slope of the tangent to the circle.
Likewise for the parabola, the slope of the tangent is
dy/dx = tan α – 2x/2r cos³ α at the point (x, y);
then dy/dx = -3 tan α is the slope of the tangent to the parabola.
The angle between two lines is expressed by the equation,
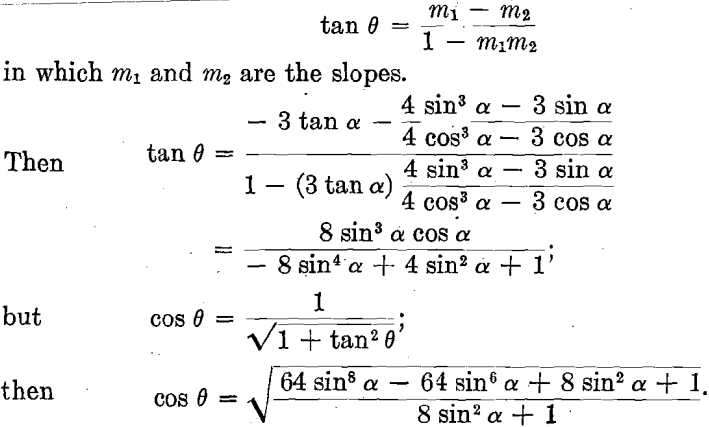
It is now possible to write the complete formula for the effective velocity of the particle:

In order to find r for the maximum velocity squared,
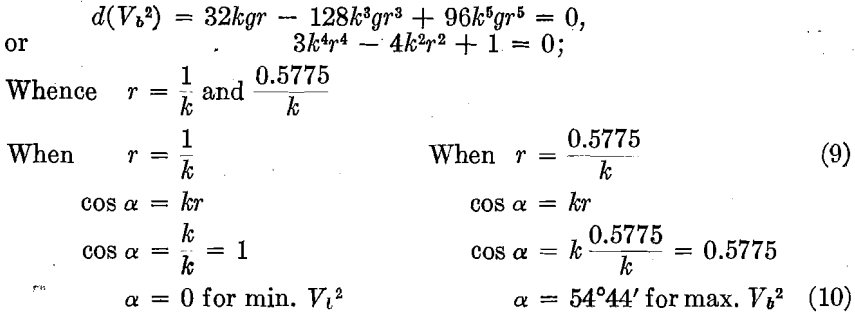
Thus when a = 54°44′ the balls are striking with maximum velocity relative to the circular path in which they travel. Since the whole charge, near ao, may be considered as being concentrated at the radius of gyration, it would seem that the most effective conditions would be obtained by placing r (equation 9) equal to the radius of gyration of the charge. Since the radius of gyration is equal to √r1² + r2²/2 when
r1 is the radius of the mill and r2 is the inner radius of the charge, then

when r is the radius of the mill and n is its speed in rev. per second.
The value of K given by this equation is the relation between r1 and r2 which should exist for best operating conditions and is really the measure of the quantity of the charge. This equation then gives the
proper relation between the size of the charge, the size of the mill and its speed. It is the fundamental equation of the ball-mill and shows the relations mentioned on page 264.
Equation (11) may be restated in the following forms, which may be more convenient.

Since cos α = 1.226rn²,
cos α = 1.226 r/r1 √0.443/1 + K² = 0.8165r/r1 · 1/√1 + K²………………………(14)
in which α is the angle corresponding to any radius r.
Then cos α1 = 0.8165/√1 + K²……………………………………….(15)
in which a1 is the angle corresponding to the radius r1, which is the radius of the mill and is therefore the minimum angle a.
cos α2 = 0.8165/√1 + K² = K cos α1…………………………………(16)
in which a2 is the angle corresponding to the radius r2, which is the inner radius of the charge and is therefore the maximum angle a.
Equations (12) to (16) all depend on the value of K, which is the real measure of the quantity of the charge. It is now necessary to get a better idea of the exact relation between K and the volume of the charge. In order to do this the cycle of the charge must be known.
Cycle of Charge
Since β = 3a — 90°, the angle passed through by a particle in the parabolic path is a + 90 + β, or a + 90 + 3a — 90 = 4a.
If the speed of the mill is n, the time per revolution is Tr = 1/n. Then the time in the circular path is Tr (360 – 4a/360) = Tc.
The time required by a particle passing through a parabolic curve is given by the equation, Tp = x/V cos a.
Then Tp = 2/πn sin a cos a…………………………………..(17)
Again consider the average of the whole charge as passing through the same cycle as the particle at the radius of gyration, which is (√1 + K²/2) r1 at the angle a = 54°44′. (Equation 10.)

The number of cycles per revolution is given by the equation,
Tr/T = 1/n ÷ 0.6923/n = 1.444……………(19)
This means that when the mill is running at the proper speed for the ball charge, then the charge is passing through 1.444 cycles per revolution, and each ball in the charge strikes, on the average, 1.444 blows per revolution.
Ball Mill Volume of Charge
Equation (18) states that the balls spend 56.65 per cent, of the time in the circular path. Then it is apparent that 56.65 per cent, of the total charge is always in the circular path. In other words, the volume of the charge between r1 and r2 (Fig. 5) is only 56.65 per cent, of the total charge, the remaining 43.35 per cent, being spread out over the rest of the mill and following the parabolic path.
The exact analytical determination of the variation in the volume of the total charge as K varies is very complicated and will not be gone into here. A very close approximation can be made, however, by use of the equation,
K = — 0.024 + 0.39√7 – 10P…………………………..(20)
in which P is the fractional part of the entire volume of the mill that is occupied by the charge when the mill is stationary. It should be noted that the charge will contain a considerable proportion of voids. These are, of course, included in the space occupied by the charge.
Ball Mill Power
From equation (8) it appears that Vb² = 16kgr² – 32k³gr4 + 16k5gr6, but the kinetic energy e = wv²/2g, or in this case, e = w(8kr² – 16k3r4 + 8k5r6), which is the energy possessed by any particle of weight w, and radius r, at the end of its parabolic path, which is available for the purpose of crushing ore. Then the total energy possessed by the particles of radius between r1 and r2 is expressed by the equation,

In this equation, if W is the entire weight of the charge, then E represents the foot-pounds of energy delivered each time the charge passes through one cycle. Then since there are 1.444 cycles per revolution, and n = 0.8158/√r1 4√1 + k² rev. per sec., the number of foot-pounds per second is represented by the equation,

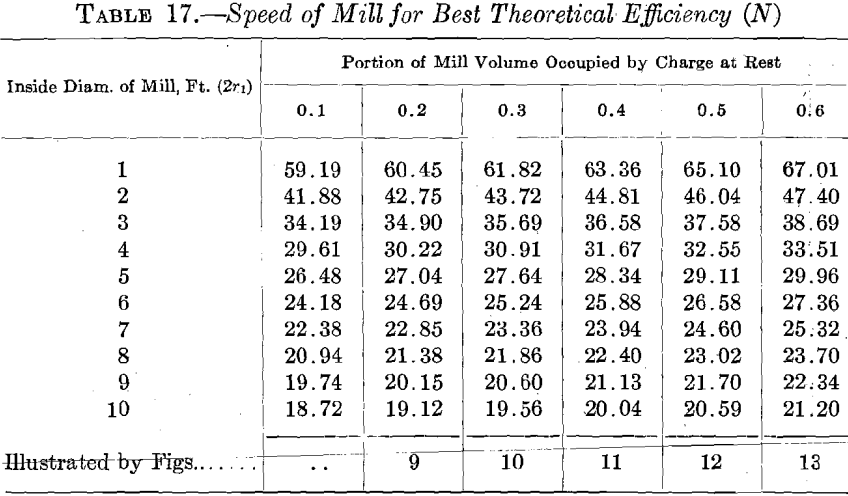
This formula gives the power output and therefore input to the mill when the weight of the charge is W, in pounds, the radius of the mill is r1, in feet, and the value of K and the speed N are as given by formulas (20) and (13). In other words, formula (22) gives the power required to operate the mill at the most efficient speed for any ball charge. In Table 16 the horsepower required has been computed for certain operating conditions: Any table or set of curves covering all conditions would be too large and complicated to include in this paper; the formulas may, however, be applied to any particular condition.
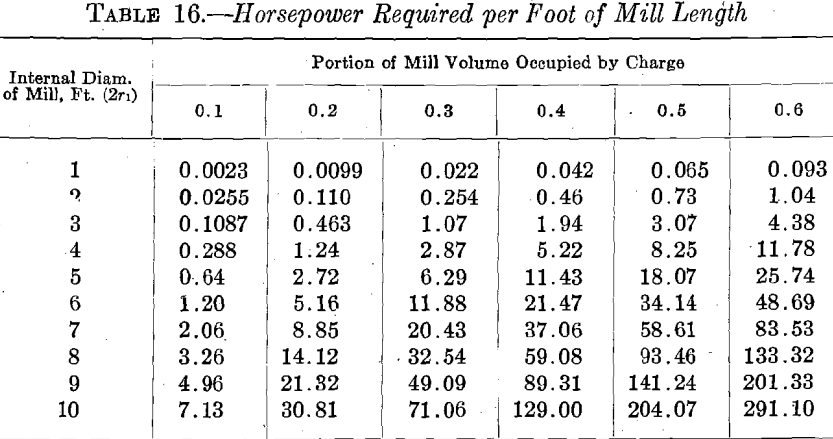
Note.—In this table the mill is assumed to be operating at the most efficient speed, as given in Table 17, and the charge is assumed to weigh 325 lb. per cu. foot.
Consideration of a Definite Case
The actual application of the formulas to a definite problem may be instructive. Consider an 8 by 6-ft. cylindrical mill charged with 28,000 lb. (12,700 kg.) of steel balls. If the balls are made of steel weighing 500 lb. per cu. ft., and are all of one size, it may be shown that the charge will weigh 74.05 per cent, of 500 lb., or 370.25 lb. per cu. ft. The charge will then occupy 28,000 ÷ 370.25 = 75.6 cu. ft. (2.14 cu. m.) of space in the mill. The factor 75.05 per cent, is derived on the assumption that the spheres are equal; in the case of a mill, the space being limited and the balls not of one size, 65 per cent, is probably more nearly correct. Using this factor, the charge would weigh 325 lb. per cu. ft., and would therefore occupy 86 cu. ft. (2.23 cu. m.). The volume of an 8 by 6-ft. mill is 301 cu. ft. (8.5 cu. m.), hence the charge occupies 28.6 per cent, of the total volume. From formula (20), when the charge occupies 28.6 per cent, of the volume of the mill, the factor K is 0.770. The speed of the mill, by formula (13), is 21.75 r.p.m., and the power, by formula (22), is 181.5 hp. Angle a will then be given by formula (15):
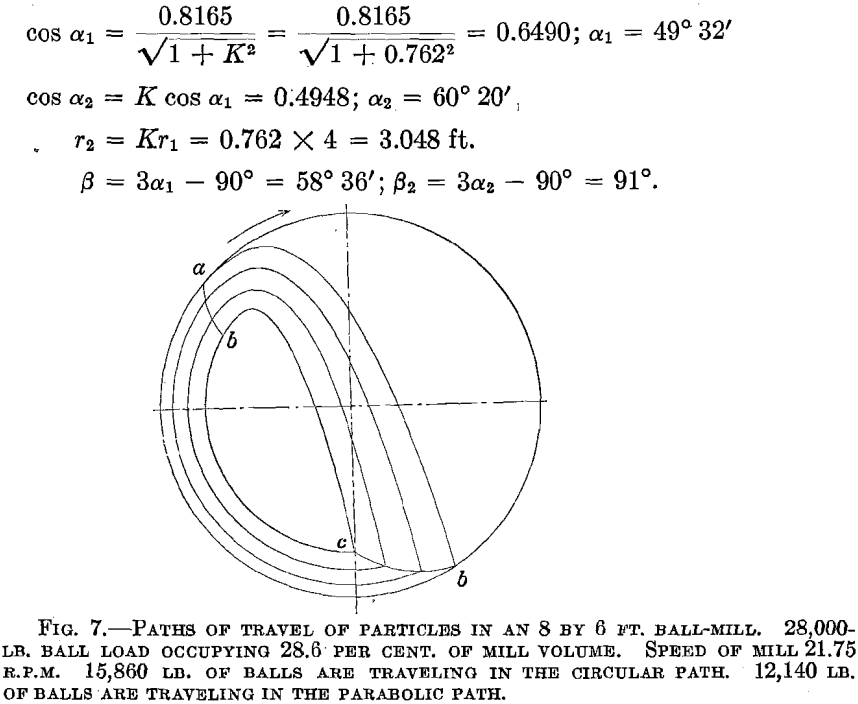
From these results and formula (2), which gives other values of r for various values of a, it is possible to plot the outline of the charge, as is shown in Fig. 7. The particular path of any ball can be plotted by use of equation (3a).
Ball Mill Internal Mechanics
Notation
r = radius to any particle p.
r1 = radius of mill.
r2 = inner radius of charge.
R = radius of gyration of charge near ao. 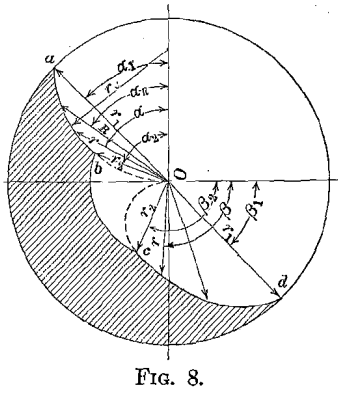
a = angle from vertical to r.
a1 = angle from vertical to r1
a2 = angle from vertical to r2.
ar = angle from vertical to R.
β = angle from horizontal to r.
β1 = angle from horizontal to r1.
β2 = angle from horizontal to r2.
n = speed of mill in rev. per sec.
N = speed of mill in rev. per min.
N1 = critical speed of mill in rev. per min.
Vb = relative velocity of particle at od, ft. per sec.
w = weight of portion of charge, lb.
W = weight of entire charge, lb.
P = fraction of mill volume occupied by charge.
g = a constant = 32.2 ft. per sec. per sec.
k = a constant = 4π²n²/g = 1.226n².
K = a constant = r2/r1
H = height of charge in mill at rest.
E = kinetic energy, foot-pounds.
Cn = cycles per revolution.
re = radius of circle oa.
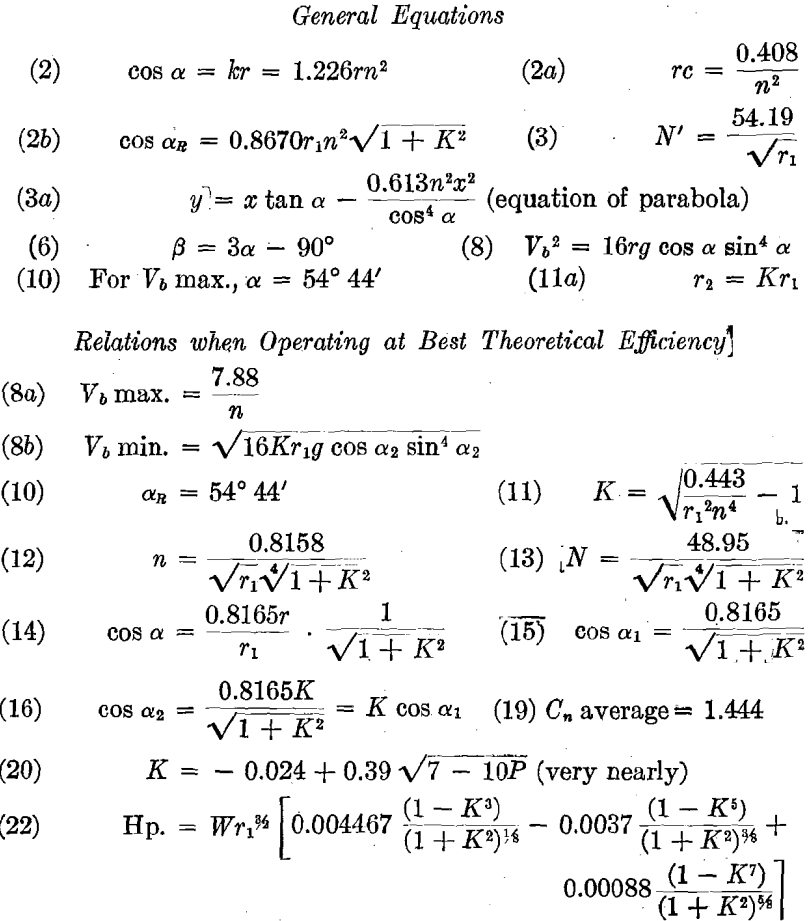
By use of these equations, with any given set of conditions, it is possible to determine the geometrical shape of the charge in the mill, the horsepower absorbed by it, the velocity of the blow struck by any ball, and the number of blows struck by any ball. The equations show also the relation that should exist between speed, diameter of mill and size of charge in order to secure the maximum theoretical efficiency.
Comparison of Observed & Calculated Curves
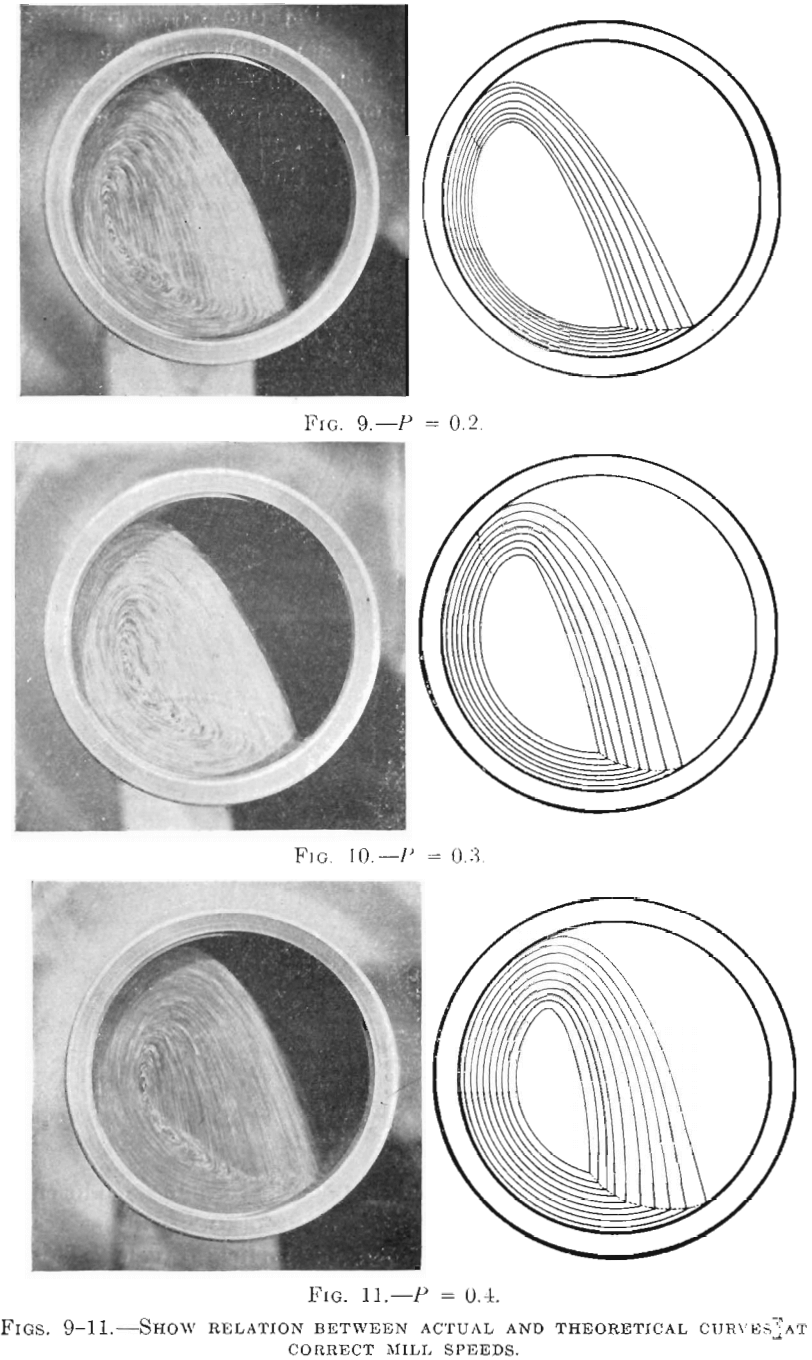
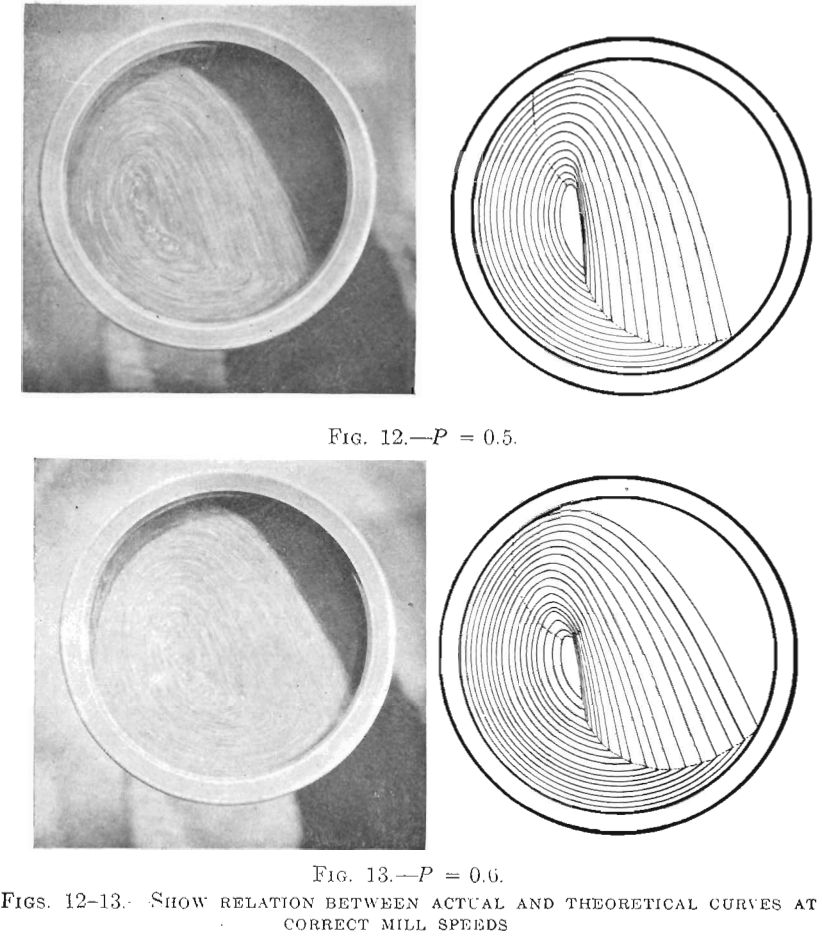
In order to observe how closely theory and practice agree, a small model mill 3 in. (76.2 mm.) in diameter and 2 in. (50.8 mm.) long was made, having a bearing at only one end so that the other could be closed by a piece of glass through which the action of the charge could be observed. The method of comparison consisted in introducing a weighed charge of fine sand, computing the best operating speed, and drawing the outline of the charge according to the preceding theory. The mill was then operated at this speed, and photographed. The comparison between the photograph and the drawing shows how closely theory and practice agree. No accurate data as to the power required could be secured on this small model. A number of these photographs and the corresponding drawings are shown.
The similarity between the photograph of the mill in actual operation and the theoretical drawing is very striking, especially when, the mill contains a large charge. When the charge is small, the difference appears greater; this is because all interference between the particles causes them to fall into the open space near the center of the mill. The photographs could not be made to show clearly the fact that these particles were accidental; it is apparent, however, when actually watching the mill run, that the particles in the central space are only occasional, as compared with the outer band. While the results of interference are more evident in the small charge than in the large one, the actual amount of interference is greater in the large charge than in the small. This is evident when the cause of this interference is considered.
The curve a-b (Fig. 5) shows the boundary line between the circular and the parabolic paths. Each particle, as it passes the line a-b, starts on its parabolic path in a direction perpendicular to the radius of the
mill through that point. It is evident that the perpendicular to the radius at p would intersect the perpendicular to the radius at a if it were produced far enough. If the two particles considered are closer together than a and p on the curve a-b, the intersection between the lines of initial direction are closer to the points considered. If the two points are adjacent on the curve a-b, it is apparent that the intersection will be
very close to the points and will, in fact, take the form of a slight crowding action between the particles. The result of this will be a slight deformation of the curve through which the particle travels. This will be just as prominent in a small charge as in a large one, although the results will be more apparent in the small charge.
It may also be shown that when the size of the charge exceeds 0.4 the volume of the mill, there will be a tendency for the particles near the center of the mass to crowd one another. This is, however, not at all serious and could probably never be detected in operation, but as previously stated, when the mill is filled beyond 0.64 of its volume, the interference becomes quite important and the mill probably could not be made to operate efficiently when more than 0.6 full.
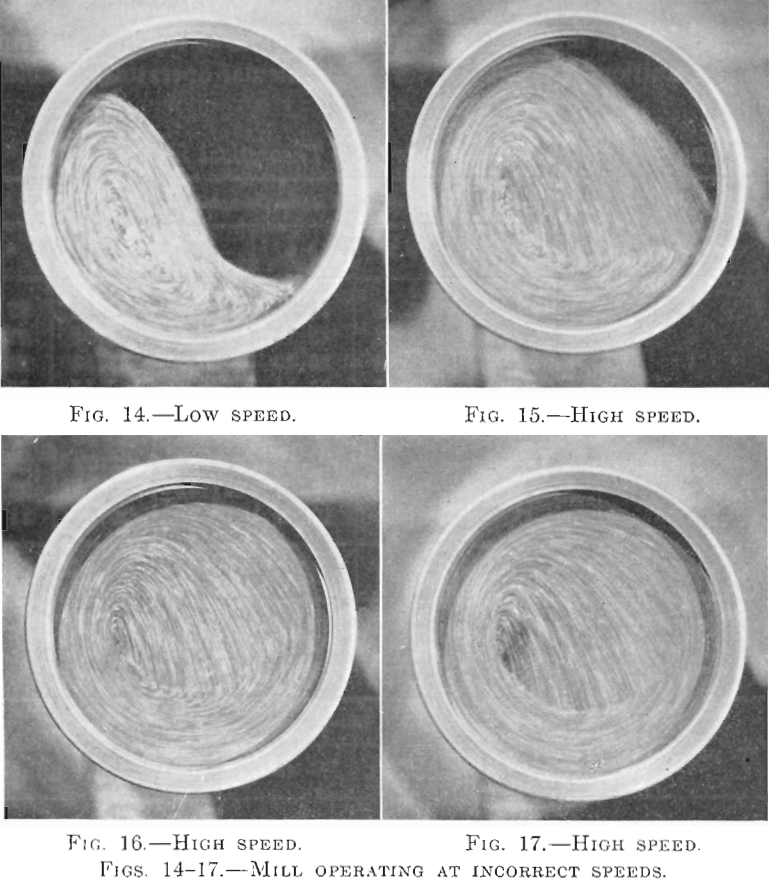
It appears from the photographs that there is a certain amount of movement between the particles at the end of the parabolic path which causes the actual parabolic path to end sooner than the theoretical path. This motion between the particles is due to the fact that each particle must change its direction of travel and move at about right angles to its original path. This change in direction requires time and reacting forces; if the force is small the time will be long and the agitation great. If the force is large the time will be small and the agitation small. Therefore, when the mill speed is low, this zone of agitation is wide, as shown in Fig. 14. In this agitation zone grinding is done by attrition, but above it, the crushing is done by impact.
While these photographs and drawings were made to illustrate the action of the particles in the charge of a 3-in. mill, they also show the action in mills of any size when operated at the most efficient speed, as given by formula (13). In Table 17, the speeds have been computed for various sizes of mills and charges. In each case, the illustration that shows the position of the charge for the particular operating condition is indicated
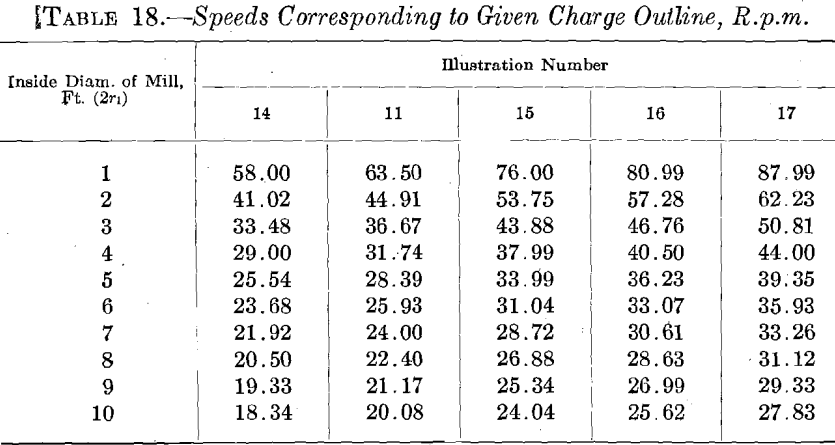
In Figs. 14, 15, 16 and 17, the effects of high and low speeds are shown. In all of these photographs the mill was 0.4 full, the operation at the proper speed being shown in Fig. 11. Table 18 shows the speed at which the charge in mills of various diameters would appear as illustrated.
- Data on Ball Charges
- Ball Mill Ball Wear Projection
- Recapitulation of Ball Wear Formulas
- Practical Application of Theoretical Conclusions
Ball Mill Operation
In this whole discussion, only the force of gravity and centrifugal force have been considered. In a mill containing water and ore as well as balls, the force of adhesion is to be considered. This force not only tends to hold the balls and ore together but also tends to hold them against the lining of the mill. Just how important this force may be under ordinary operating conditions is hard to say. It was shown, however, in the little model mill, that adhesion tended to hold the particles together in their parabolic paths and almost entirely eliminated the accidental particles that fall near the center of the mass. It is impossible to apply the results secured in a small mill to a large mill in this respect, however, as adhesion varies inversely with the size of the particles considered.
Adhesion also varies with the moisture, so the mill operator has a convenient means of controlling this force so as to produce the best results. The amount of moisture in the pulp for best efficiency will vary with the nature of the ore, the nature of the ball charge, and the nature of the mill. With a mill charge of large steel balls, adhesion will not affect the operating conditions to any considerable extent unless the pulp is made very thick. The tendency would then be for the balls to stick to the lining and revolve with it.
It is very important to prevent slipping between the charge and the lining of the mill; the tendency to slip is much smaller with large charges than with small ones. If the friction between the charge and the lining of the mill is not great enough to carry the particles up to the curve a-b, the efficiency of the mill will be very greatly reduced and the lining of the mill will be rapidly worn away. Flat sides will also appear on the balls and the cycle of the charge will be slow and irregular. In an open-trunnion discharge mill, the pulp will not flow from the mill regularly but will come in pulsations. Lifters or roughened liners are therefore desirable, as they insure a greater coefficient of friction.
The following conclusions may be stated:
- By use of formulas (20) and (13), the proper theoretical speed for the operation of the mill may be computed.
- This speed is correct only when there is no slipping between the charge and the lining of the mill, and when the pulp is not so thick as to produce strong adhesion between the particles.
- In actual practice it may be found that more effective crushing can be done at some other speed, but it would appear that the variations above or below this theoretical speed should be small.
- When operating at the speed shown by formula (13) the crushing is done largely by impact.
- At speeds lower than N (equation 13) the proportion of the crushing done by attrition is increased.
- At speeds higher than N (equation 13) the proportion of the crushing done by impact is increased.
- The amount of crushing done depends upon the number of blows struck and the work done at each blow.
- The number of blows struck can be increased by increasing the number and decreasing the size of the balls.
- The work done at each blow can be increased by increasing the weight of the ball and by increasing the diameter of the mill.
- From this it follows that mills of larger diameter should be charged with smaller balls and mills of smaller diameter with larger balls, when working on the same feed.
- The proper operating speeds of ball-mills vary inversely as the square-root of the diameters.
- The proper operating speed of a ball-mill increases as the size of the ball load increases.
- Due to interference between the balls, the volume of the charge should not be over 60 per cent, of the volume of the mill.
- Unless great care is exercised to prevent slippage, the volume of the ball charge should not be less than 20 per cent, of the volume of the mill.
- It would then seem that a ball charge that occupies between 25 and 50 per cent, of the volume of the mill will give the most satisfactory results.
- In an 8-ft. (2.4 m.) mill running at 22 r.p.m., with a 28,000-lb, (12,700 kg.) charge of 2-in. (50.8-mm.) balls, there will be an average of about 1,000,000 blows per minute; each of these blows will be equivalent to dropping a 2-in. ball 5 ft. (1.5 m.).
Discussion
A. L. Blomfield, Colorado Springs, Colo, (written discussion).— I congratulate the author on bringing out a paper of real service to the profession. His contention of uniform size in balls is borne out by my own experience; in coarse crushing at the Golden Cycle in 6 by 6-ft. (1.8 by 1.8-m.) ball-mills we unquestionably gain by screening out the small balls once or twice a month. The point of gaging the ball size to be used by the uniformity of screen sizing is of particular interest.
The necessity of sufficient return feed from classifier to the ball-mill is sound and clearly shown. In connection with this, I wish two further points had been gone into as thoroughly: (1) The effect of the quality of classification. In general, it is true that the smaller the per cent, of undersize in the feed the more effective is the mill’s work. This is true on a bucking board, in tube-mills, ball-mills, and grinding pans. Given the possibility of returning a full-feed load to any mill, it has been my experience that the effective work in the grinder is almost proportional to the quality of the return feed. (2) Again speaking generally, the shorter the tube-mill the greater is the quantity of return feed necessary to keep it loaded. The classification thus keeps the oversize in the mill more free from finished product and thus the crushing more efficient. It is very easy to overload any long mill with too much return feed. The author’s tests were made on an 8-ft. by 22-in. Hardinge. This type is capable of handling very large return feeds. I would like to hear Mr. Davis’ views on the best length of mill, given the diameter.
Dealing with feeds to fine grinders: At the mill of the Great Fingall Cons. M. Co., in 1906, we found that the 5-ft. grinding pan gave the greatest tonnage in closed circuit, grinding a feed — 8+20 mesh to — 20 mesh when the feed was slightly over twice the effective work done, and that the effective work was almost directly proportional to the efficiency of classification.
I note the large number of classifiers in his flow sheet and agree that it is clearly demonstrated that sufficient classifier capacity should be installed, as they cost very little to run. Two 6-ft. classifiers to the ball-mill could probably be replaced by one 12-ft. quadruplex machine, though possibly the only gain would be a saving in first cost.
H. A. White, P. O. Dersley, Transvaal (written discussion).— The fact that the author makes no reference to the work of others on the same subject, I think, must be attributed to the neglect of the usual distinction between ball and tube mills, which is founded upon the presence of special lifting devices in the ball mill. The paper really deals with tube-mill theory, upon which quite a lot of work has been done. The most accessible reference will probably be Richards “Ore Dressing,” (Vol. III, p. 1336), but I will specially refer to my own papers in the Journal of the Chemical, Metallurgical & Mining Society of South Africa (Vol. V, p. 290 and Vol. XV, p. 176), where very much the same ground is covered.
It may be interesting to compare the results obtained by an independent handling of the same problem. The critical speed obtained is very, slightly different owing to the value of g, which, of course, is not everywhere the same, author has omitted to note the fact that his “ diameter of mill” must be reduced by the average diameter of balls used in order to make the theoretical particle correspond with the actual balls and, of course, only the inside diameter of the lined tube is meant.
The directions for drawing the parabolic curve of flight might be very much simplified by using the relation between the angle of impact and the angle of departure, which I discovered in 1905 and the author has proved on p. 269. The author notes that the locus of points of departure is a semicircle but does not observe that the locus of points of impact is a trisectrix. The maximum of x¹, when only one layer of balls is considered (the outside layer), is obviously r and the angle of departure is 30° from the vertical.
In order to calculate the maximum value of the blow struck, the author uses the second order effects beside the principal one due to the height of fall of the balls from the vertex of the parabola. The author thus derives a value of 0.5775 for cos a, this value is identical with that found for the maximum height of fall, as might have been anticipated, but the derivation of the latter is very much simpler. He does not notice that the path in this case is through the center of the mill.
The author deviates from exact methods and uses the idea of center of gyration in place of summation of various layers of balls and no doubt the approximation is sufficiently close if K were independently known; but to ascertain K the assumption is made that the average of the whole charge passes through the same cycle as the particle at the radius of gyration, and as the inner layers have a much shorter cyclic time than the outer and there are also many fewer balls, this assumption is much less accurate. In fact, the author’s figure of average number of cycles per revolution (1.444) may vary from more than 1.5 to less than 1.2, in accordance with the speed and loading of the tube. However, if correction is made of tube diameter, as previously mentioned, the final results are not very far out.
Of importance is the question of maximum efficiency to be got out of any tube and the load for that efficiency; but though the author gives the best speed for any load he does not indicate which load and speed give maximum efficiency. A further important question in actual running plants is the maximum capacity that may be gotten out of any tube, and as the efficiency is not widely affected this latter maximum may be the most important. These points may be well illustrated from the Witwatersrand practice with standard tube mills 5 ft. 6 in. by 22 ft. The effective diameter inside linings, allowing 2 in. for pebbles used is put at 59 in. and the speed for maximum efficiency is 27.96 r.p.m. with a load about 45 per cent., while the maximum capacity is attained at 32.2 r.p.m. with a load 3 in. above the center.
These theoretical deductions and some others of interest were confirmed by observation of a working model of 7 ft. diameter, the full account of which will be found in the papers mentioned. I have to thank the author for the exceedingly clear manner in which his paper is arranged and for the able paragraphs on ball wear which should be of great practical use.
