
Table of Contents
Froth flotation of minerals is one of the dominant concentration processes available today. By this process, finely divided mineral particles, within a pulp, separate according to the hydrophobicity of their chemically modified surfaces. Hydrophobic mineral particles are collected and transported from the pulp by air bubbles into the froth, along with some hydrophylic particles, which are transported by entrainment. In the froth substantial rejection of unwanted minerals takes place, with an upgraded concentrate being removed from the top of the froth column.
The froth flotation process has been traditionally practiced in a rather empirical manner because of its complex chemistry and intricately related physical variables. Early flotation studies were usually concerned only with chemical or physical aspects, and seldom focussed on the kinetic phenomena.
Flotation Rate Approaches
Kinetic Models: The kinetic approach is certainly the oldest and most traditionally used. It postulates that the flotation rate follows a rate equation similar to those utilized to describe homogeneous kinetics. Its foundation is based on the well known analogy existing between bubble-particle and molecule-molecule collisions. Thus, there are measurable rate constants, which describe mineral recovery in the flotation process. The flotation rate was proportional to the particle-bubble collision frequency, and hence independent of the feed particle size distribution. Thus a first order model can be postulated and this may be represented as:
dC/dt = -k C………………………………………………………….(1)
where C is the instantaneous concentration of floatable component in the cell at time t, and k is the first order rate constant, sometimes called flotability, which is given in inverse time units. Since then, several modifications have been made to the model.
The maximum recovery concept and the integrated version of the classical first order model is then written as :
R = Rm (1 – e-kt)………………………………………………….(2)
where Rm is the maximum floatable fraction of value or maximum recovery, and R is the cumulative instantaneous recovery at time t.
Detailed is a first order kinetic equation, in which he assumed a mono-disperse feed with a rectangular flotability distribution. This modified first order model has been widely utilized & introduced the concept of the R/K trade-off. The mathematical expression of the integrated version of this model is :
R = Rm(l-(l-e -Kt)/Kt)…………………………………………………..(3)
where K represents the rectangular distribution of rate constants.
A second model, which was based on three parameters. He assumed that the feed had a rectangular particle size distribution, and that the flotability of the particles were linearly proportional to their size. The rate constants were associated with the minimum and maximum particle size, and the concentration of bubbles in the pulp. The integrated version of Huber’s three parameter model is :
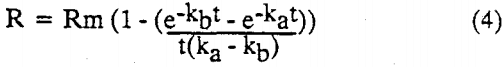
where ka and kb, are the maximum and minimum rate constants, respectively.
The above kinetic models consider only the presence of one phase in the flotation system, however since they were tested under conditions of froth accumulation, has stated that they should predict the overall flotation rate, including the froth removal kinetics, and not merely the actual flotation rate within the pulp.
Flotation Cell Modifications
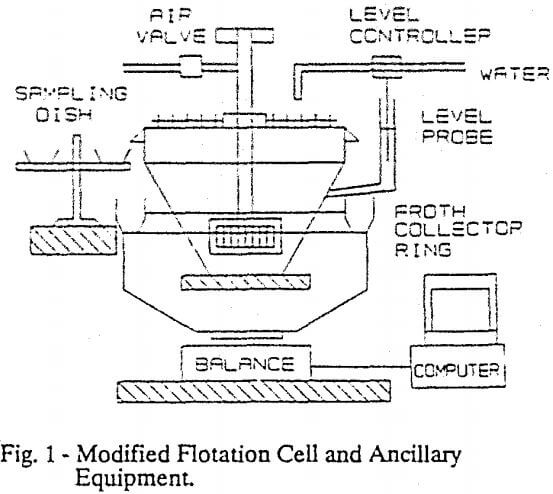
A circular Wemco Fargergren laboratory flotation machine was modified to permit froth to be discharged symmetrically over the cell circumference into an independently supported launder (Figure 1).
Two symmetrically opposed sets of parallel rakes were attached to the six liter capacity flotation cell. This froth removing rake, or scraper, minimized the tangential transport of froth, and permitted control of the froth residence time in the scraped zone. The average froth residence times in the scraped zone were estimated to be 1, 2 and 4 seconds for froth scraper rates of 50, 25 and 12 rpm respectively. Also the froth scraper position controlled the froth thickness, which would be allowed to form on the pulp. The froth launder was supported on a weighing mechanism to permit continuous monitoring of the froth weight throughout a test.
In addition to these modifications, a on-off pulp level controller, and a manually controlled sampling device were implemented. The aeration rate was controlled by a manually activated valve, and the flow rate was read from a rotameter. The cell stirring rate and pulp density were maintained constant. This ancillary equipment utilized in the research is also shown in Figure 1.
Experimental Procedure
A simple lead ore, from the Viburnum Trend of Missouri, was used as feed for the flotation experiments. Chemical analysis of the ore gave 6.5 – 7.8% Pb, 0.1 – 0.4% Zn, 0.5 -1.0% Fe, and 0.05 – 0.20% Cu. Preliminary and previous testing proved that the minor elements do not significantly accumulate in the concentrate, as their total concentration did not exceed 1.5% by weight. The lead is present in the ore as galena, and the total sulfur content of the ore was less than 2%. The major gangue mineral was dolomite.
Lead ore batches of 30 kg were mixed and crushed until all particles passed a 4.7 mm aperture screen. The ore was then mixed, coned and quartered, and split several times so that representative lots of 2 kg were separated. Each 2 kg sample was finally weighed and stored in a sealed plastic bag. When needed an ore sample was ground in a 20 cm by 20 cm ball mill, at a pulp density of 67% solids by weight for 10 minutes. This grind was followed by 15 minutes of simultaneous grinding and conditioning with 50 g of Aero 343 Xanthate, as collector, per tonne of ore. These grinding conditions gave a particle size distribution of 99% passing 300 microns, and 47% passing 75 microns.
Six drops of pine oil frother (50g/tonne) were added to the pulp, which was diluted in the flotation cell to give 27% by weight solids. During the flotation test, the froth discharged in to the continuously weighed launder, and 3 to 15 separate froth samples were continuously taken into small sampling dishes (see Figure 1). Water and solid contents of these samples were determined by drying, and the lead content was found by chemical analysis. Representative samples of the feed, tail and concentrate were taken and analyzed for each flotation, to permit the consistency of the test data to be determined. The experiments lasted from 3 to 15 minutes, giving hundreds of data points each.
The test work investigated the cell performance and the flotation kinetic parameters under the influence of the following cell operating variables:
- Froth Scraper Rate (FR) – the rate at which the cell scraper revolved and physically swept the froth over the lip of the cell into the collecting launder ring. [12, 25, 50 rpm]
- Air flow rate (AR) – the volume flow of air into the cell. [15, 20, 25 lpm]
- Froth thickness (FT) – the height of froth from the pulp/froth interface to the bottom of the froth scraper. [0.5, 1.0, 2.0 cm]
Kinetics of Flotation
The author maintains that selectivity in flotation depends in part on differences in rates of flotation. The rate of flotation should be directly proportional to the frequency of particle-bubble collisions. In this paper, it is suggested that floatable particles of the mineral must be distinguished from nonfloatable particles.
Review of Previous Theories
Before a particle enters the froth it must strike a bubble and adhere to it. Flotation rate will therefore depend on the number of particle-bubble collisions per unit time. Not all particle-bubble collisions result in capture of the particle by the bubble.
-dC/dt = KC………………………………………………………..(1)
where C = concentration of mineral in the pulp at time t, expressed in any convenient units; t = time; and K = rate constant.
ln C = -Kt + ln Co……………………………………………………….[2]
where Co = concentration of mineral when t = 0.
C = Co e-Kt…………………………………………………………..[3]
Development of Modified, First Order Equation
Any equation based on the assumption that flotation rate depends directly on the frequency of particle bubble collisions must be first order, that is, the rate of flotation must be proportional to the first power of the concentration of the mineral in the pulp. Furthermore, evidence that particle bubble collisions are necessary for flotation is overwhelming. Even if precipitation of gas from solution is a necessary preliminary step, normal flotation will not occur until the gas-filmed particle strikes and adheres to a bubble.
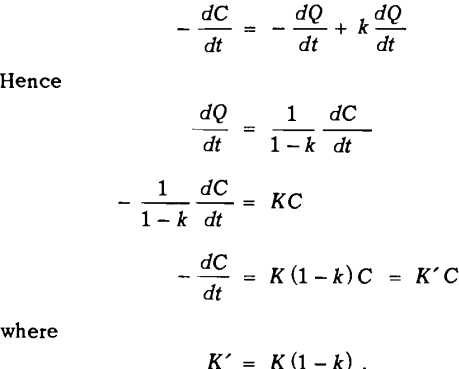
Once flotation starts, the concentration of mineral in the pulp decreases, very rapidly at first and then more and more slowly, eventually becoming asymptotic to the time axis. The height of the asymptote above zero concentration has been marked as CT
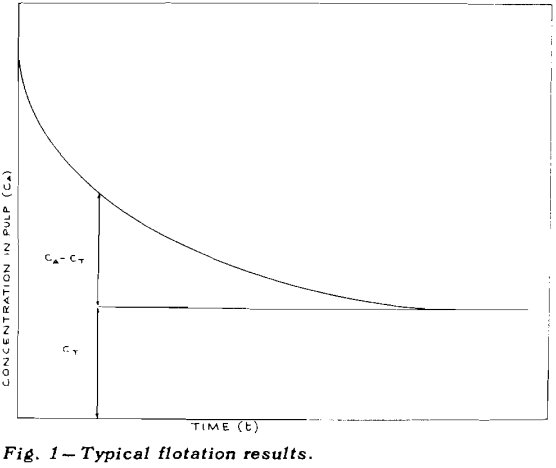
If the total concentration of mineral A is designated by CA and the tailings loss of the same mineral after prolonged flotation is designated by CT, then the concentration, C, of floatable mineral is given by CA – CT.
lnC = -Kt + ln C0
ln (CA – CT) = -Kt + ln (Ci – CT)
where Ci = value of CA at zero time, that is the concentration at the start of the float.
-dCA/dt = K(CA – CT)
and, in exponential form,
CA-CT = (Ci – CT) e-Kt
This approach is similar to that suggested by Morris, but Morris treated CT as an empirical constant, not a constant with the specific physical meaning assigned herein. The empirical equation may fit the data somewhat better but is not so easy to interpret. Jowett also used a quantity analogous to CT.
It is well known that differently sized particles of the same mineral appear to float at different rates. The possibility that each size fraction of each mineral will have to be regarded as a separate floatable species with a separate rate equation must be considered.
Let dQ/dt = rate at which mineral enters the froth on air bubbles from the pulp, and dP/dt= rate at which mineral returns to the pulp from the froth.
Then
-dC/dt = – dQ/dt + dP/dt
dQ/dt = KC
-dC/dt = KC
as assumed previously. However, when dP/dt is proportional to dQ/dt, that is when
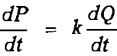
where k = constant of proportionality
This equation is of the same form as that assumed previously, and may be treated in the same way. The rate equation will hold only when the rate at which mineral drains from the froth into the pulp is proportional to the rate at which mineral enters the froth from the pulp.
Laboratory Experiments
The experiments were carried out in a Fagergren flotation machine with a glass bowl. The volume of pulp was 2400 ml. Two identical paddles were made such that each would fit snugly into the space between the bowl and the central shaft, and would dip into the froth to a fixed distance when the handle rested on the edge of the bowl. One paddle was held in each hand and the two were brought around from the back of the machine to the front to scoop froth into the collecting pan every 15 sec.
The air supply was passed through a flowmeter to ensure a constant rate, and the pulp level in the bowl was maintained as nearly constant as possible.
Although the procedure already described would be suitable for any ore, its use on normal ores would require numerous assays. For this reason exploratory tests were carried out on pure quartz. With this system, the weights of the floats gave all the information required; no assays were needed.
The collector used was Armac 10D, which is mostly n-decyl amine acetate. Since the primary purpose was to check theories of flotation kinetics, and not to measure the effect of collector composition, the commercial product was not purified.
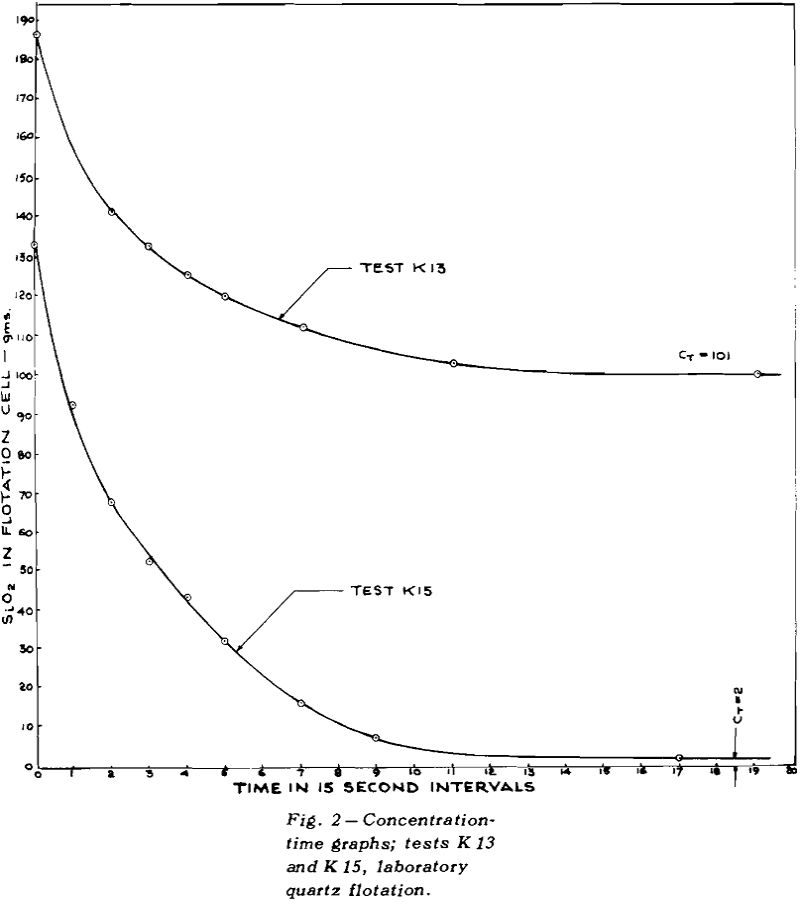
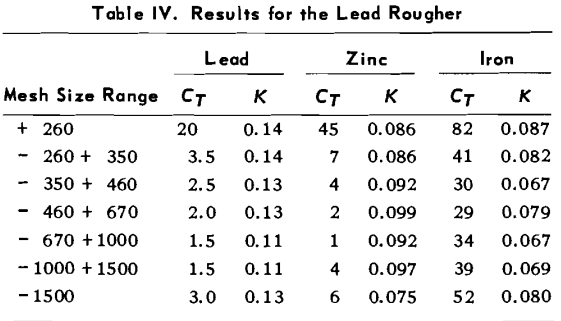
TEST K76 – In Test K 76 the plot of log (CA – CT)
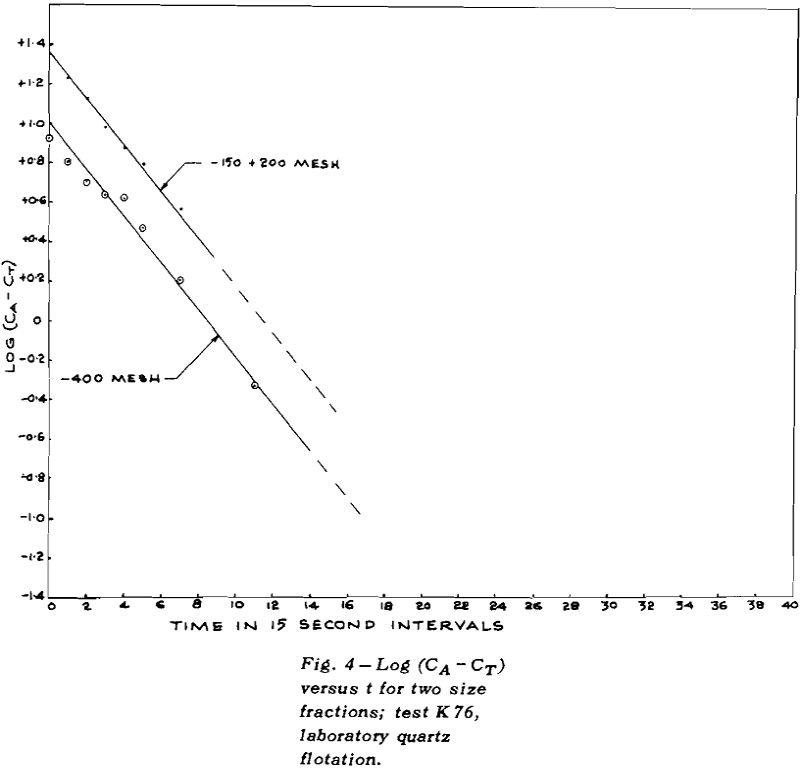
versus t gave a good straight line for the overall results (except for the last point where the error in log (CA – CT) could be large). The values of CT for each size fraction were obtained by plotting CA versus t for mineral of that size and then measuring the height of the asymptote.
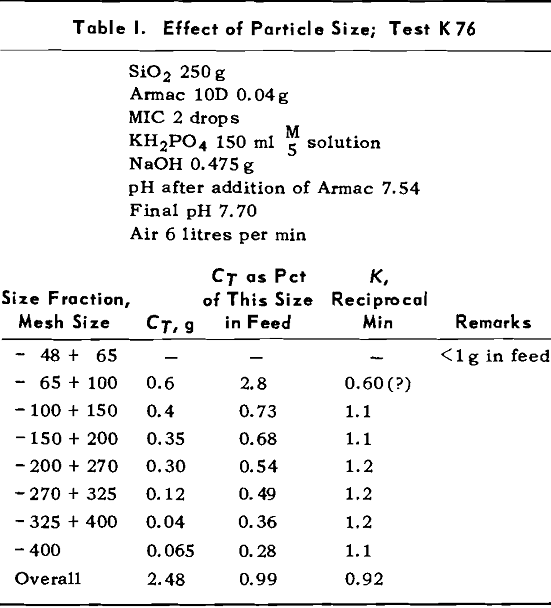
A number of tests were run to determine the effect of amount of Armac on the values of K and CT. During the first tests, no pH buffer was used so pH fell steadily during the tests. The changing pH was confounded with the changing rate of flotation so in later tests the solutions were buffered with KH2PO4 — NaOH mixtures. The amounts of KH2PO4 and NaOH were kept constant at 0.03 mols each.
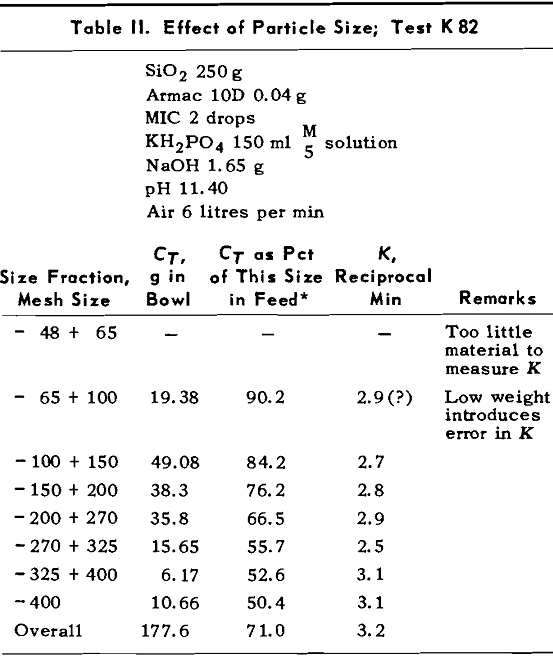
pH; above pH = 10 or 10.5, CT increases with increasing pH.
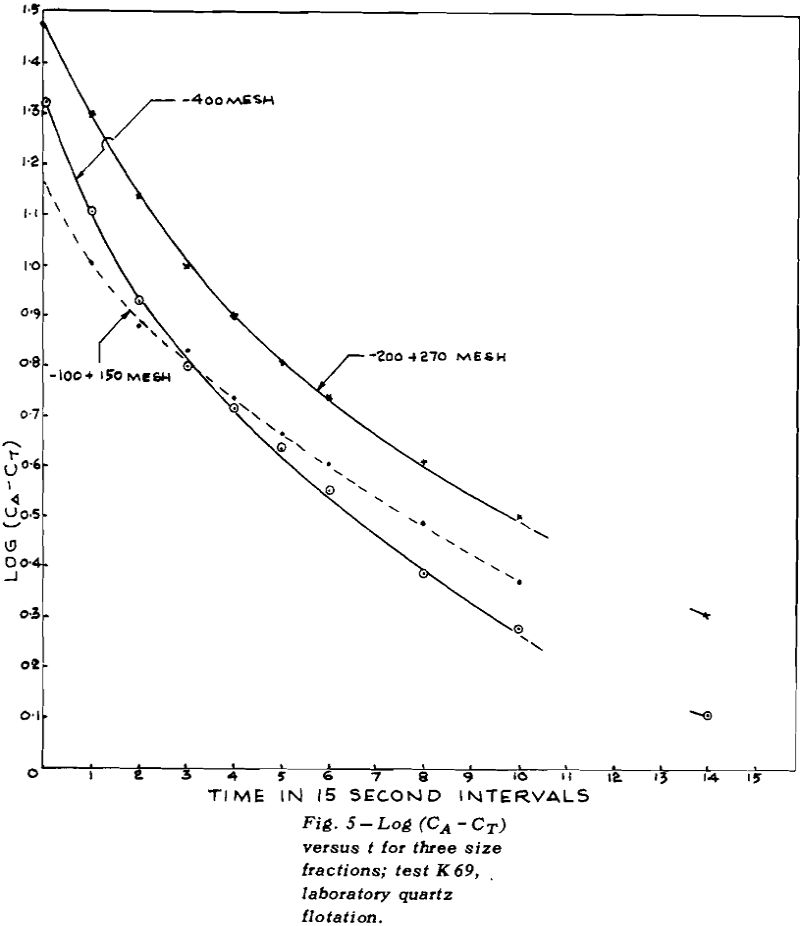
Above pH ≅ 10.5, K increases rapidly with increasing pH. Below pH ≅ 7, the kinetic equation fails as shown by curvature on the log (CA—CT) versus t graphs. The exact pH where failure begins is not easily determined as it is difficult to distinguish between slight curvature and no curvature. At the lowest pH’s, the curvature was very pronounced.
extrapolated for estimation of CT. This introduces some error in both CT and K. For this ore, CT would be affected by the presence of combined particles in addition to the factors which affect CT for pure minerals.