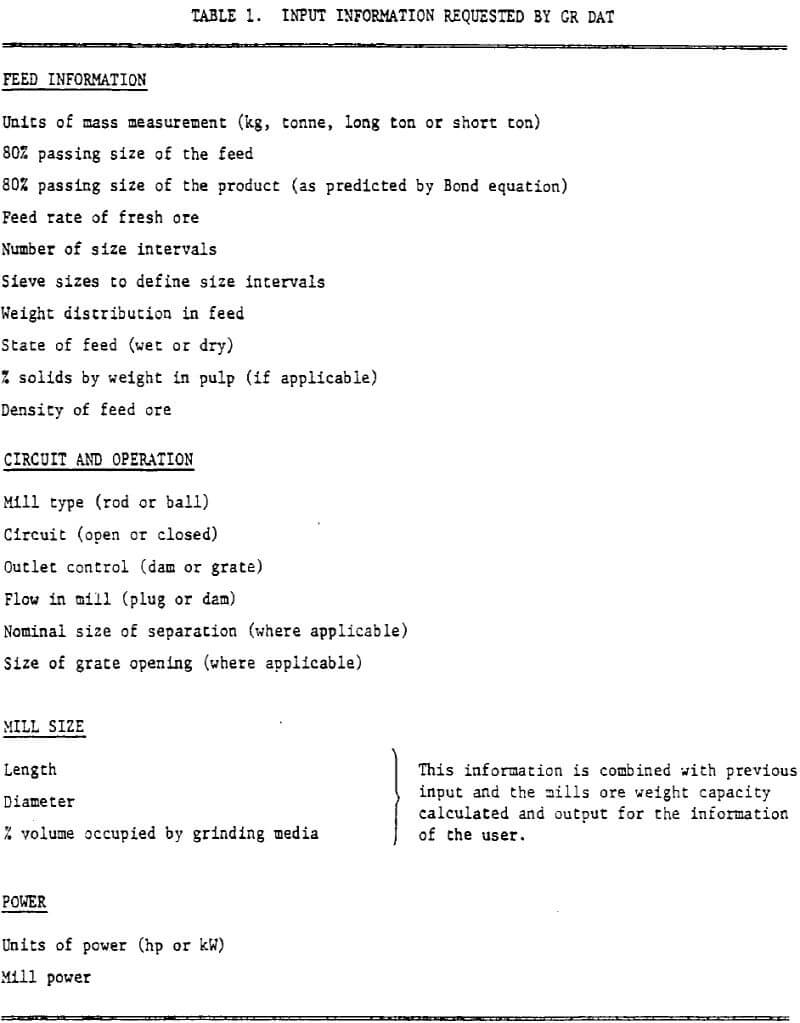
These programs and the simulation algorithms are discussed below. Note that in some Grinding Circuit Simulations, a residence time distribution model is used. In the MRRC simulation package, however, only the two extremes of well mixed and plug flow through the mill are considered. This approach reduces the amount of input information and computation required in the simulation. Predictions obtained from a simulation are for the mill product size distribution, that is the size distribution after grinding but before separation.
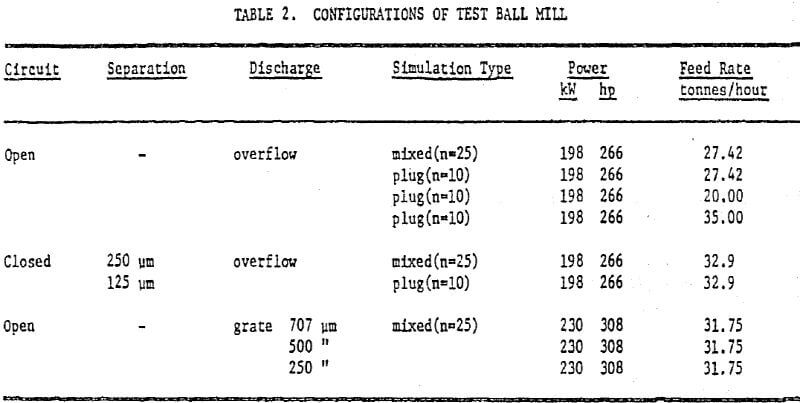
Before the MRRC package can be used, a Bond design exercise must be completed. A wet ball mill with 40% volumetric loading and 2.44 meters diameter inside liners was chosen as a test mill. This choice means that the only efficiency factor which is non-unity will be for the mill in open circuit and this factor is equal to 1.2 (Rowland and Kjos, 1978) . The size in micrometers that 80% of the weight of the feed and product passes, F80 and P80, were kept constant for each grinding simulation at 1200 and 175 micrometers respectively. The feed rate was varied in each simulation in order that the power predicted from equation 1 corresponded to the 2.44 meter diameter test ball mill. A number of simulations corresponding to differing operating conditions for the test ball mill have been carried out. These are summarized in Table 2. With the predicted results, the effect of the following operating conditions on the mill product size distribution can be tested:
- comparison of well mixed flow and plug flow
- comparison of different sizes of separation,
- effects of discharge grate size,
- effects of operating the mill under “non-design” conditions.
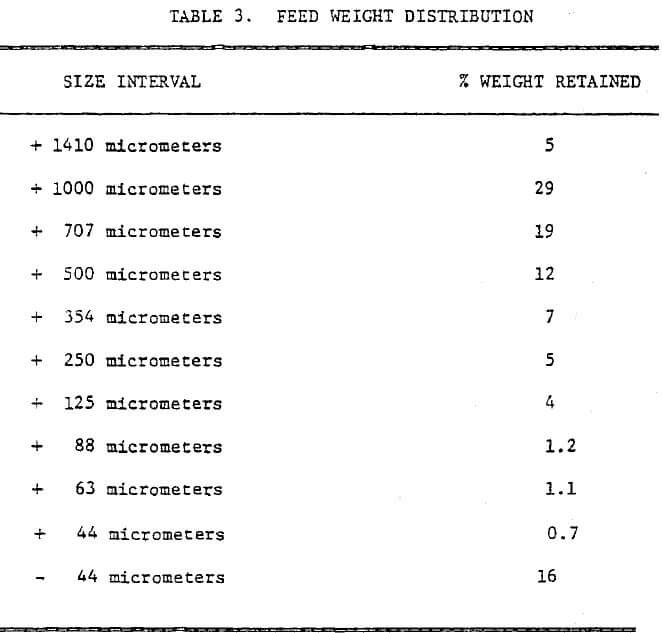
The weight distribution in the fresh feed to the mill, f0, is given in Table 3. This distribution has been chosen arbitrarily.
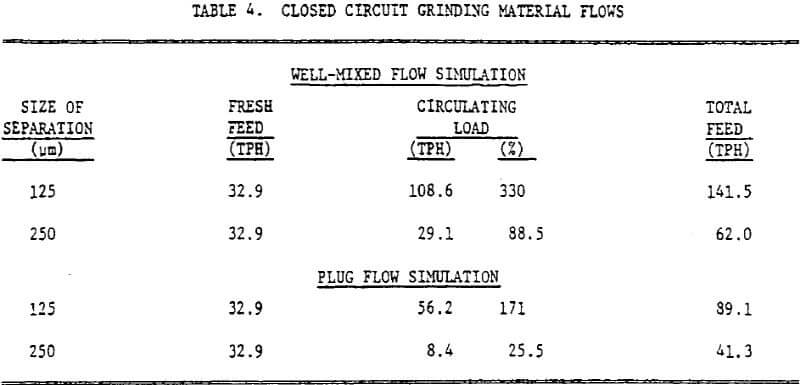
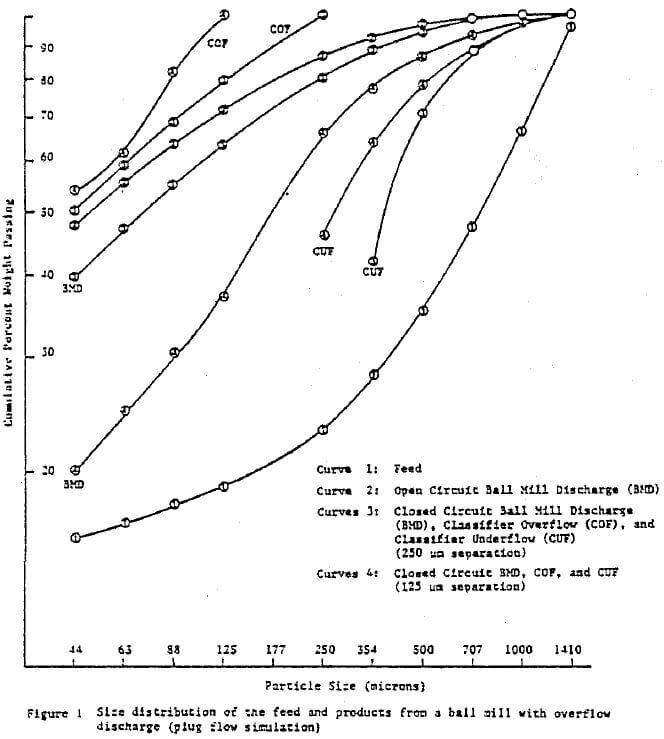
Study of the results predicted from the plug flow simulation of the test mill with overflow discharge illustrate the effectiveness of the MRRC grinding simulation package. Figure 1 shows size distribution data for the feed and for the products of three different configurations for the mill. Note that these size distributions are of the mill product before it is separated, and of the hydrocyclone products assuming 100% efficiency at the nominal size of separation. Curve 2 is the predicted size distribution when the mill is operated in an open circuit. This distribution gives a product with a 80% passing size of 177 micrometers, which provides confidence in the results of the MRRC grinding models. The effects of differing sizes of separation may be studied by comparing curves 3 and 4 in Figure 1 and the circulating load values in Table 4. First it may be noticed that the grind becomes coarser when the nominal size of separation is changed from 250 to 125 micrometers (80% passing size of 389 micrometers for a 125 micrometer separation as opposed to an 80% passing size of 250 micrometers with a 250 micrometer separation). This coarser grind might be expected because, with the smaller size of separation, the circulating load is larger, and hence, the residence time of the ore in the mill is shorter. In addition, with the 125 micrometer separation, the predicted weight distribution in the separator feed is less dispersed, (cf. the gradients in straight line parts of curves 3 and 4), which is a desired attribute if the next stage of processing is flotation.
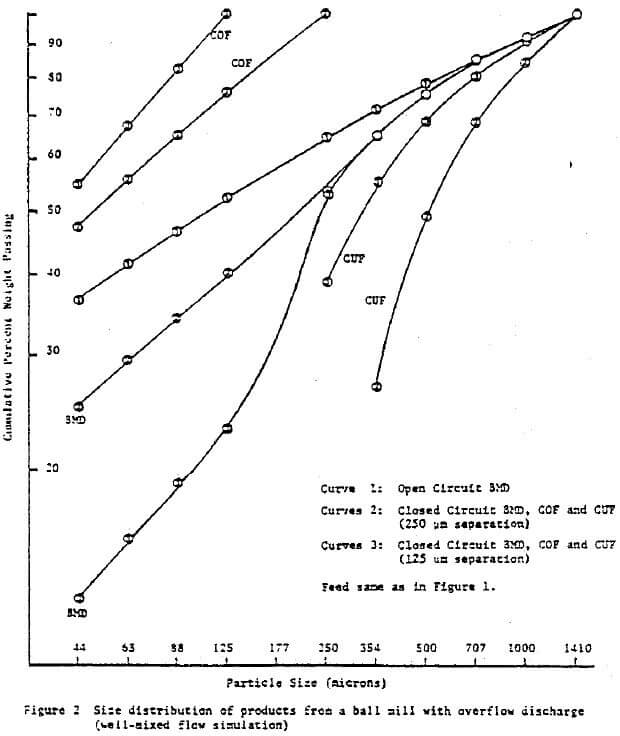
The size distribution plots and circulating loads for the same mill using the well-mixed, simulation are shown in Figure 2 and Table 4, respectively. The behavior of these plots indicate that with well mixed flow, changes in the mill operation have the same effects on the product weight distributions, as with plug flow. However, the predicted mill products are much coarser in open circuit, e.g., the 80% passing size is 550 micrometers compared to an 80% passing size of 177 micrometers in the product predicted using the plug flow simulation. The reason for this is in the nature of the well mixed flow assumption. If the flow through the mill is assumed well mixed, particles in the feed can exit from the mill instantaneously. Therefore, the reduction in the size of some of the feed particles may be minimal, thereby leading to a coarse product grind. On comparing the results in Figures 1 and 2, it appears, at least for the case of a ball mill with an overflow discharge, a plug flow approximation is closer to the true nature of flow through the mill. This is reasonable on studying residence time distribution data which often exhibit fairly sharp peaks.
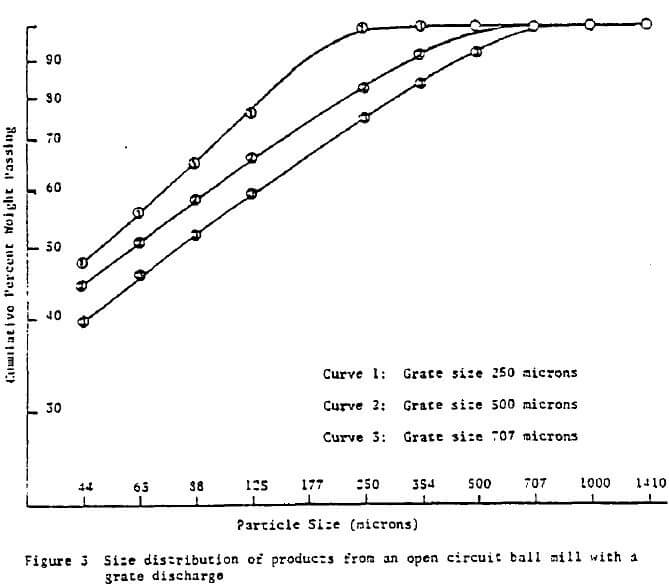
When a grate controls the discharge from the mill, although the assumption that the mill contents are perfectly mixed at all times can be applied, the product is not necessarily identical to the mill contents, since feed particles larger than the grate size cannot exit instantaneously. Hence, a grate discharge not only gives control over the mill product but it may also introduce a distribution of residence times into the simulation. The effect of changing the grate opening size on the product weight distributions from the test ball mill in open circuit may be observed in Figure 3 with the expected result that the smaller the grate size the finer the grind. In fact, the product of a mill with 250 micrometer grate is finer than the product from the same mill with an overflow discharge.
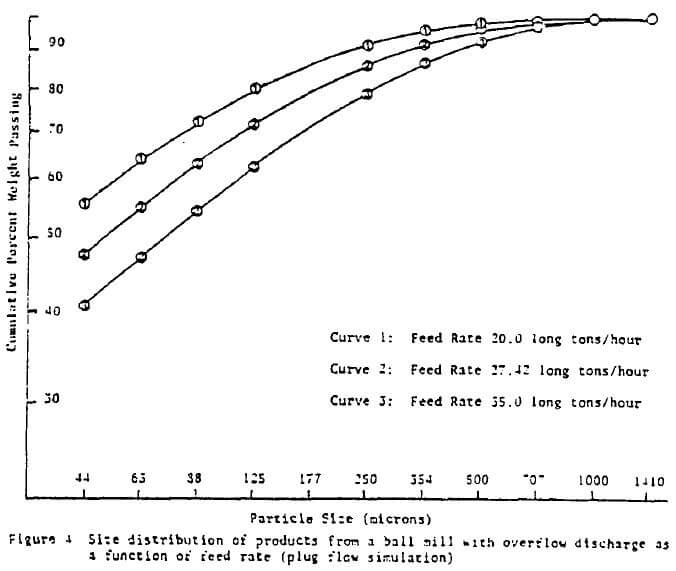
A useful feature of the MRRC grinding simulation package is that the effects of non-design operating conditions can be easily tested. When the test ball mill is run in open circuit the design feed rate is 27.42 tonnes/hour. Figure 4 compares the predicted size distributions from the open circuit ball mill with feed rates of 20.0, 27.62 and 35.0 tonnes/hour respectively. As might be expected, the larger the feed rate the coarser the grinding mill discharge product.
