Table of Contents
We determined the effect of common sulfide minerals on the corrosion rates of various types of ferrous alloy grinding media. Data obtained from this study will aid in determining the contribution of any electrochemical reactions between sulfide minerals and grinding media to the total grinding media consumption. Common sulfide minerals used in this study were chalcopyrite, galena, and sphalerite. In the presence of oxygen, chalcopyrite was found to increase the corrosion rate, galena was found to decrease the corrosion rate, and the effect of sphalerite was dependent upon the type of grinding media. Possible electrochemical reactions of these minerals in the presence of grinding media are suggested.
Grinding requires a large capital investment for the minerals processing industry and frequently is the area of maximum use of power and wear-resistant materials. A typical copper producer processing 27,000 st/d of ore, may spend $25,000 per day for replacement of grinding balls. A National Academy of Sciences report estimates that the domestic copper industry consumed 205,000 st of grinding balls in 1978.
Total wear of grinding media is due to corrosion, mechanical wear, and interaction between corrosion and wear. The contributions and interactions of these processes are poorly understood, and much disagreement exists in the technical literature because of the difficulty in measuring the separate components.
Moroz studied the synergistic effect between corrosion pitting and spalling through microscopic examination of grinding balls that had been used in production mills. He concluded that corrosion pitting increases the amount of spalling by weakening the structure of the ball.
Hoey, Dingley, and Freeman used weight loss techniques to measure total wear in a laboratory ball mill while grinding a nickel-copper sulfide ore. They showed that the use of corrosion inhibitors decreased the total wear rate up to 49 pct, and they attributed all of this decrease to reduction of corrosion. They further showed that the wear reduction due to inhibitors is dependent upon the type of ore.
The effect of adding chromium to steel to increase corrosion resistance is well documented. Payer and Staehle reported that stainless steel, upon exposure to air, forms an oxide film 10 to 20 A thick. The use of high- chromium, white cast iron grinding balls is rapidly increasing, and their corrosion resistance properties are often cited as a reason.
Wranglen investigated the effect of sulfide inclusions on the formation of corrosion pits on carbon and stainless steels. He determined that in carbon steel, corrosion starts in the matrix adjacent to the sulfide inclusion, while in stainless steel, it begins in the inclusion itself.
Pavlica and Iwasaki studied the open circuit potentials and short circuit currents of steel and pyrrhotite. They concluded that cathodic polarization of the pyrrhotite and anodic dissolution of the steel was occurring. They also determined that in a magnetite slurry, the pyrrhotite is rapidly coated with magnetite, thus affecting the floatability and electrochemical properties of the pyrrhotite.
Learmont and Iwasaki measured the open circuit potentials of galena and mild steel and concluded that galena would act as a cathode and the metals as an anode.
The Bureau investigated the effect of pyrite and magnetite on corrosion of carbon steel grinding media as a function of pH. Corrosion rate was found to have a strong inverse dependency upon pH. Pyrite was found to increase corrosion rate at all pH levels, while magnetite was found to increase the corrosion rate of carbon steel grinding media at acidic pH levels but to have no effect at basic pH levels.
In view of the economic importance of corrosion-related phenomena to the domestic mineral industry, the Bureau conducted further investigations of corrosion of grinding media to determine (1) the electrochemical factors that affect corrosion and (2) the role corrosion plays in the total loss of grinding media. This report details the effect of common sulfide ore minerals on corrosion rates of common grinding media.
Corrosion Rate Determinations by Laboratory Tests
Electrochemistry of Corrosion
Metallic corrosion reactions in aqueous solutions are electrochemical in nature. Corrosion reactions can be expressed as a sum of two half reactions; one representing a cathodic or reduction reaction, and one representing an anodic or oxidation reaction. When a metal specimen and the electrolyte in which it is immersed are electrically isolated from any external circuit, no net current will flow between the two media, and the currents associated with the anodic and cathodic half reactions must be equal in magnitude and opposite in direction. If the driving force for one reaction to occur is greater than that for the other at an electrically neutral surface, a charge will accumulate at the interface. This charged interface is known as the electrical double layer and acts to inhibit the first reaction and enhance the second so that the rates become equal. The electrical double layer is equivalent to a potential, known as the open circuit potential, applied to the specimen.
Information regarding the nature of the reaction occurring at the metal surface can be obtained by applying a potential different from the open circuit potential and measuring the resulting current. Through use of a potentiostat, the surface potential of the specimen can be varied by applying a potential between the specimen and a current-carrying inert electrode that is suspended in the same electrolyte as the specimen. When the potential of a metal specimen is forced to a value more positive than that of the open circuit potential, the anodic reaction rate is increased, giving it a positive current. A negative current results when the applied potential is less positive than the open circuit potential. The results are plotted as potential versus logarithm of current magnitude. Figure 1 is an idealized plot.
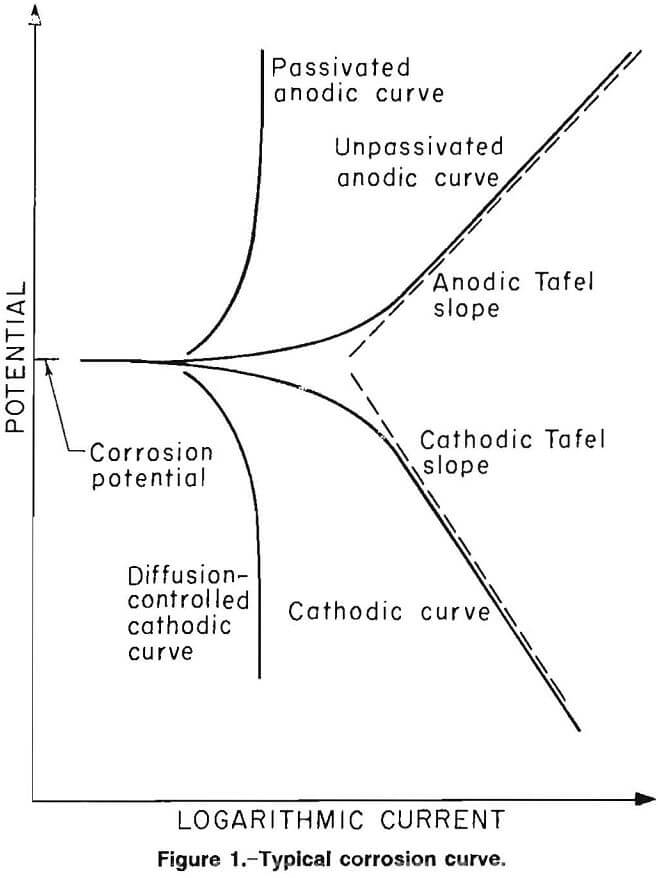
The slopes of the linear portions of the curves are known as the Tafel constants. The lower or cathodic portion of the curve represents the reduction reactions; for example, the reduction of elemental oxygen or hydrogen ions. A low slope and a linear relationship in this portion of the curve indicate surface activation or chemical reaction control of the cathodic reaction rate, whereas a high slope and nonlinear relationship indicate that the reduction reaction is being controlled and retarded by another type of phenomenon, usually diffusion.
The upper, or anodic, portion of the curve represents the oxidation reactions, primarily the dissolution of metal. A low slope in this portion of the curve indicates that the anodic reaction is activation controlled, whereas a vertical slope in this portion of the curve indicates that another phenomenon is controlling the anodic reaction rate, usually passivation or formation of a surface film or a diffusion-limited anodic dissolution.
The slope, near the corrosion potential, of a linear plot of the potential versus current is known as the polarization resistance. The polarization resistance is inversely proportional to the corrosion rate, if all other factors are held constant.
Test Materials and Procedure
Test Solution
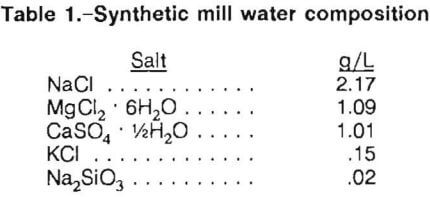
A test solution of the composition given in table 1 was prepared after analyzing thickener overflow water from various operating sulfide ore mills. The test solution had a conductivity of 5.1 mmho/cm.
Mineral Samples
The chalcopyrite used was a flotation concentrate from Cyprus Pima Mines Co. in Arizona. The galena was from a bulk sample taken in Kansas. The sphalerite was from a bulk sample taken in Oklahoma. The chemical analysis of the mineral samples used are given in table 2. All minerals were ground through 200 mesh and a screen analysis was performed to determine the size distribution. Mineral surface area was calculated based on the size distribution and the assumption that the particles were spherical.

Ferrous Alloy Specimens
Four types of grinding balls were obtained from various manufacturers. Their chemical composition was determined by X-ray fluorescence. The complete analyses are given in table 3.
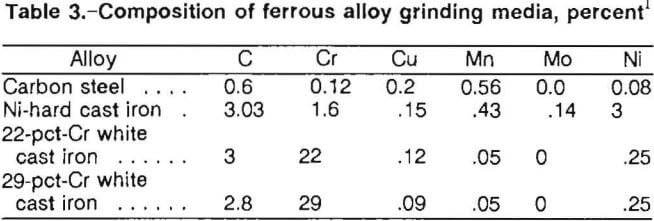
Type 1 was a 1-in-diam forged carbon steel ball containing 0.61 pct C and 0.56 pct Mn. It had an average Rockwell C hardness of 61. Type 2 was a cast 1-in-diam Ni-hard cast iron containing 3.03 pct C and 3.0 pct Ni. The average Rockwell C hardness was 60. Types 3 and 4 were 1-in-diam white cast iron balls containing 22 and 29 pct Cr and 3.0 and 2.8 pct C, respectively. The average Rockwell C hardness values for types 3 and 4 were 63 and 60, respectively.
Simulation of Abrasive Conditions
A laboratory test cell (fig. 2) was designed to simulate the chemical and mechanical conditions inside an operating mill. An ultrasonic probe was used to provide energy to actively abrade the metal surface by increasing the force of particle impact on the metal surface. Alumina powder, which is electrochemically inert, was added to the stirred ore slurry to provide additional abrasive action. The ultrasonic probe was chosen because it provides equal abrasive action over the surface of the test specimen and has no mechanical parts, which simplifies test operations. Testing in this cell showed an increase in corrosion rate as the ultrasonic power input was increased, indicating that a protective layer of corrosion product was being abraded away from the test specimen.
The test vessel was a 13-cm-high, 13-cm-diam plastic cylinder. The test specimen, mounted on a stainless steel rod, was inserted in the side of the vessel. The stainless steel rod was insulated from the test solution by a length of latex tubing. A tapered glass tube containing a salt
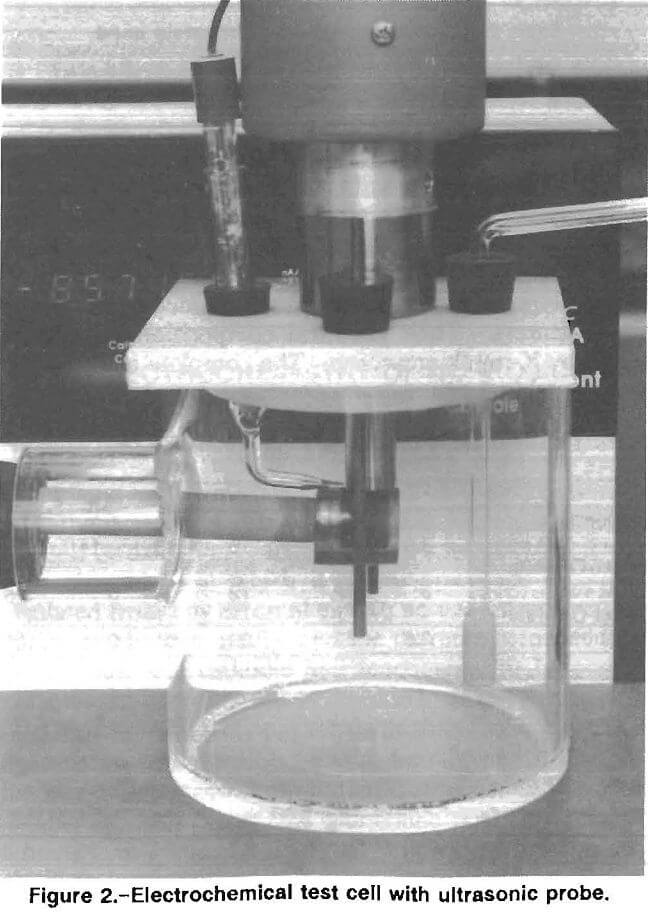
solution and the reference electrode was inserted through the top of the test vessel immediately above the specimen. A graphite counter electrode was inserted on either side of the specimen, and an air bubbler was placed immediately in front of it. A 300-W ultrasonic probe was mounted above the vessel with the tip of the probe above the specimen.
Experimental Design
Experiments were conducted on the four types of grinding media using each of the three minerals at pH 8. Because of anomalous behavior encountered using galena, additional testing was performed on carbon steel at pH 2 using galena. In each series of tests, the mineral-to-metal surface area ratio (SAR) was varied from 0 to 1,000. The slurry was buffered to pH 8 with CaCO3. Testing using a galena slurry was performed on carbon steel grinding media at both pH values using both air and argon as purge gases. Testing was performed on Ni-hard cast iron, 22- pct-Cr cast iron, and 29-pct-Cr cast iron at pH 8 using air as a purge gas. For tests at pH 2, the pH was adjusted with H2SO4 and NaOH at the beginning of the test; any test during which the final pH deviated more than one-half a pH unit from the initial pH was discarded (less than 5 pct of the tests). Five replicates were performed at each set of conditions.
Determination and Analysis of Potential-Current Data
Potential-current data were obtained in laboratory tests with the use of a Princeton Applied Research (PAR) model 350A corrosion measuring console, which is a microprocessor-controlled scanning potentiostat that was designed specifically for use in corrosion research. Other equipment used was an Apple II+ personal computer, software developed by the Bureau, and the three-electrode system described in the previous section. The potentiostat section of the PAR system applied a sequence of potential values between the metal specimen working electrode and the reference electrode. The section measured the voltage between those electrodes and also the resulting current flow between the working electrode and the graphite counter electrode. A voltmeter and ammeter are thus part of the potentiostat. The potential and current data were stored and processed by the personal computer.
Corrosion rates were determined using polarization resistance methods, commonly known as linear polarization. The polished specimen was mounted in the ultrasonic test vessel, 1,750 mL of test solution was added followed by alumina and mineral addition, and the pH was adjusted. Scans were conducted from 0.1 V below the open circuit potential to 0.1 V above it at a rate of 0.2 mV/s.
The corrosion current was calculated using the following equation:
Icorr = BaBc/2.3 Rp (Ba + Bc)………………………………………….(1)
where Ba = anodic Tafel constant,
Bc = cathodic Tafel constant,
and Rp = polarization resistance.
No correction was made for the potential drop between the reference and working electrodes due to the high conductivity of the test solution. Corrosion current was converted to corrosion rate using Faraday’s law. According to that relationship,
Q = nFW/M……………………………………………….(2)
where Q = coulombs,
n = number of electrons involved in the electrochemical reaction,
F = Faraday’s constant (96,487 C),
W = weight of electroactive species,
and M = molecular weight of electroactive species.
Because the equivalent weight (E.W.) is defined as M/n, and since coulombs is the product of the current and the length of time the current, i, was passed, equation 2 can be rearranged to read
W/t = i(E. W.)/F…………………………………………………….(3)
where W/t is the corrosion rate in weight per time. Because corrosion rates are traditionally expressed in mils per year, which provides an indication of penetration, equation 3 can be converted to appropriate units and simplified to the following:
Corrosion rate (mpy) = 0.13 Icorr (E. W.)/d…………………………………..(4)
where Icorr = corrosion current density, µA/cm²,
E.W. = equivalent weight of the corroding specie, g,
and d = density of the corroding species, g/cm³
Thus equation 4 is used to calculate the corrosion rate directly from the corrosion current density.
The data were analyzed using standard statistical methods. Simple linear regression was performed on all sets of data with the mineral-to-metal SAR as the independent variable. Analysis of variance was performed on the regression to determine the validity of the data. Statistical tests using F- and t-distributions were performed on the analysis of variance to determine if the dependent variable being examined changed with mineral addition. All statistical tests were performed at the 95-pct-confidence level. Tafel constants were determined from the portion of the curve, covering at least one order of magnitude of current, that was closest to the corrosion potential with a correlation coefficient of at least 0.95. Polarization resistances were determined by linear regressions and also had correlation coefficients of at least 0.95.
In addition to the experimental design outlined, cyclic voltammetry and potentiostatic testing were performed on a chalcopyrite electrode to determine the reaction mechanisms by which chalcopyrite affects the corrosion rates of ferrous alloys. The chalcopyrite sample was from the Mandy Mines in Saskatchewan, Canada. The chalcopyrite sample was examined for purity using optical microscopy. Silicate and pyrite inclusions were found. The voltammetry was performed in the same test cell as the other test work, but the ultrasonic probe was not used in order to preserve the surface for possible phase identification. The voltammetry scan was conducted from 100 mV below the open circuit potential to 1.2 VSCE, then the direction of the scan was reversed until the current again became cathodic. During the potentiostatic testing, the chalcopyrite electrode was held at 0.200 VSCE for 16 h, then examined under a metallographic microscope for reaction products.
Results and Discussion
Chalcopyrite
Effect on Corrosion Rates
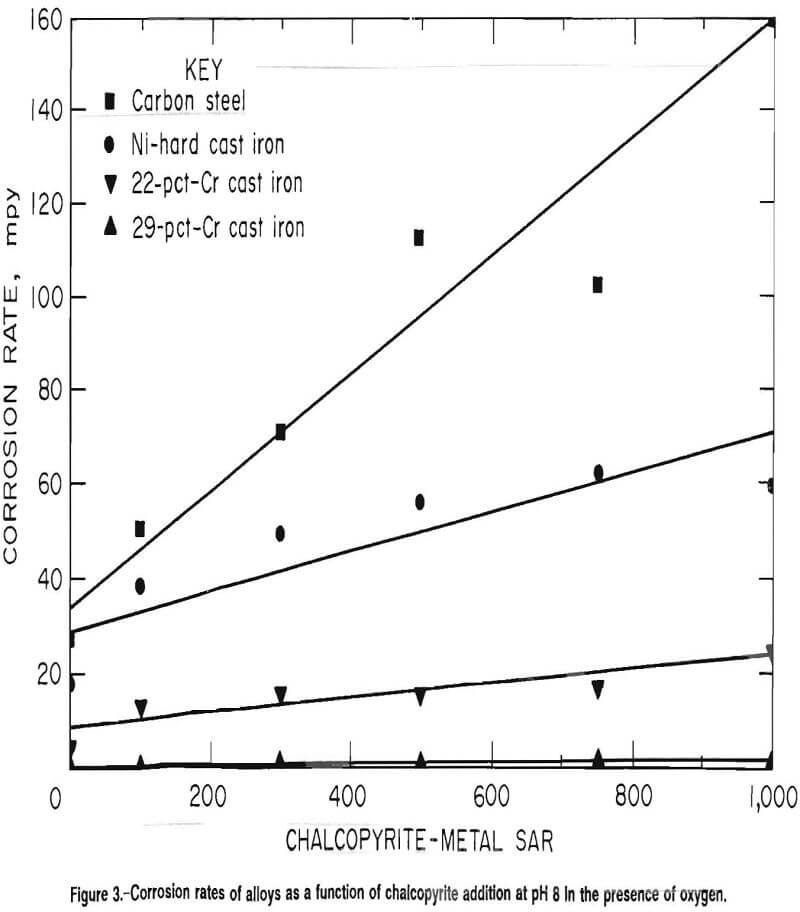
Chalcopyrite had the greatest positive effect on corrosion rates of the three minerals tested. Corrosion rates for the four types of grinding media studied are given in figure 3. Carbon steel had the highest rate, which increased from an average and standard deviation of 27 and 6.6 mpy, respectively, in the absence of minerals to an average and standard deviation of 162 and 48 mpy, respectively, at an SAR of 1,000. The data were fit by the linear model
Rate = 0.123(SAR) + 30.3 mpy………………………………………………….(5)
The Ni-hard cast iron had an average corrosion rate of 18 mpy in the absence of minerals, with a standard deviation of 6.6 mpy. The maximum corrosion rate of 62 mpy, with a standard deviation of 16 mpy, was encountered at an SAR of 750. At an SAR of 1,000, the corrosion rate dropped to 60 mpy with a standard deviation of 15 mpy. However, the data were fit by the linear model
Rate = 0.038(SAR) + 30.6 mpy…………………………………………………….(6)
The corrosion rate of the 22-pct-Cr white cast iron also increased linearly from an average corrosion rate and standard deviation of 4.0 and 1.1 mpy, respectively, in the absence of minerals to an average and standard deviation of 25 and 2.7 mpy, respectively, at an SAR of 1,000. The data were fit by the linear model
Rate = 0.016(SAR) + 8.1 mpy………………………………………………………..(7)
The corrosion rate of the 29-pct-Cr white cast iron was markedly less than the rates of the other three alloys tested. The average corrosion rate and standard deviation were 0.5 and 0.2 mpy, respectively, in the absence of minerals. The maximum average was 1.6 mpy with a standard deviation of 1.1 mpy at an SAR of 750. The average and standard deviation at an SAR of 1,000 were 1.1 and 0.7 mpy, respectively. The data were fit by the linear model
Rate = 6.0 x 10 -4(SAR) + 0.8 mpy…………………………………………(8)
The Tafel constants of the four types of grinding media tested are given in table 4 as a function of chalcopyrite addition. The cathodic Tafel constant was statistically independent of the chalcopyrite addition for the carbon steel and the 29-pct-Cr white cast iron, indicating that the addition of chalcopyrite had no significant effect on the rate of the cathodic reaction. With the Ni-hard cast iron and the 22-pct-Cr white cast iron, however, the cathodic Tafel constant increased with chalcopyrite addition, indicating a decreased rate of reaction.
The cathodic Tafel constant was consistently higher than the anodic Tafel constant for the carbon steel, Ni- hard cast iron, and the 22-pct-Cr white cast iron, indicating that the rate of the corrosion reaction was controlled by the cathodic half reaction. The cathodic and anodic Tafel constants for the 29-pct-Cr white cast iron were statistically equal at all chalcopyrite addition levels, indicating mixed control of the reaction kinetics.
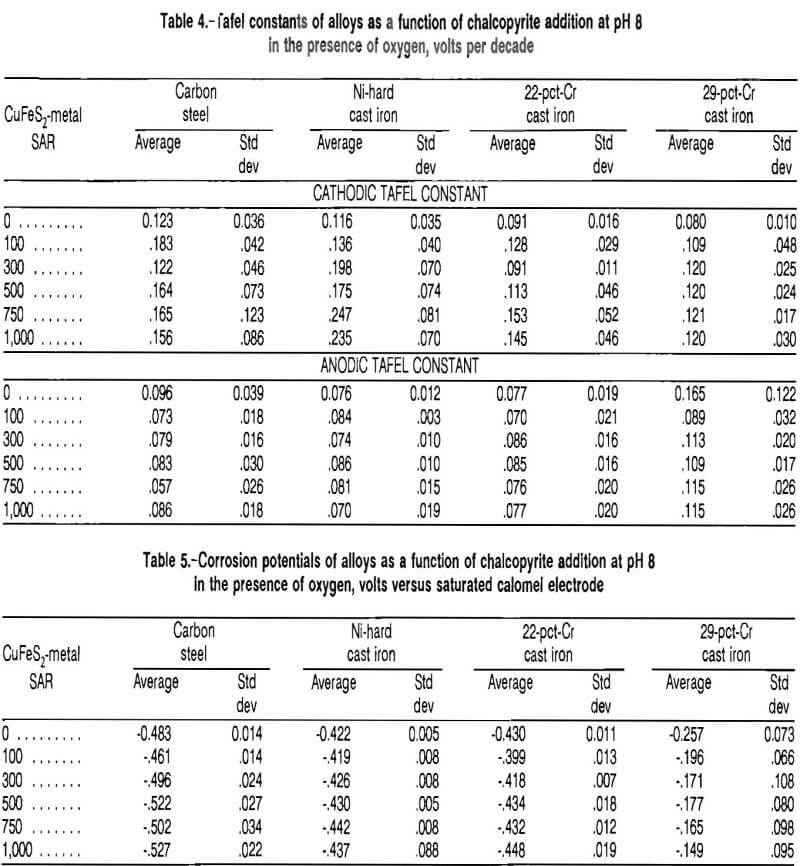
The corrosion potentials of the four types of grinding media studied are given in table 5 as a function of chalcopyrite addition. The corrosion potential of the carbon steel and the Ni-hard cast iron decreased with increasing chalcopyrite addition. The corrosion potential of the 22- pct-Cr white cast iron was statistically independent of the chalcopyrite addition, but did have a downward trend. The corrosion potential of the 29-pct-Cr white cast iron increased with increased chalcopyrite addition. The carbon steel had the most active corrosion potential, -0.527 VSCE with a standard deviation of 0.022 V at an SAR of 1,000 and the 29-pct-Cr cast iron had the most passive corrosion potential, -0.149 VSCE with a standard deviation of 0.095 V. The change in potential with the addition of chalcopyrite indicates that the chalcopyrite was taking part in an electrochemical reaction.
Electrochemical Reactions
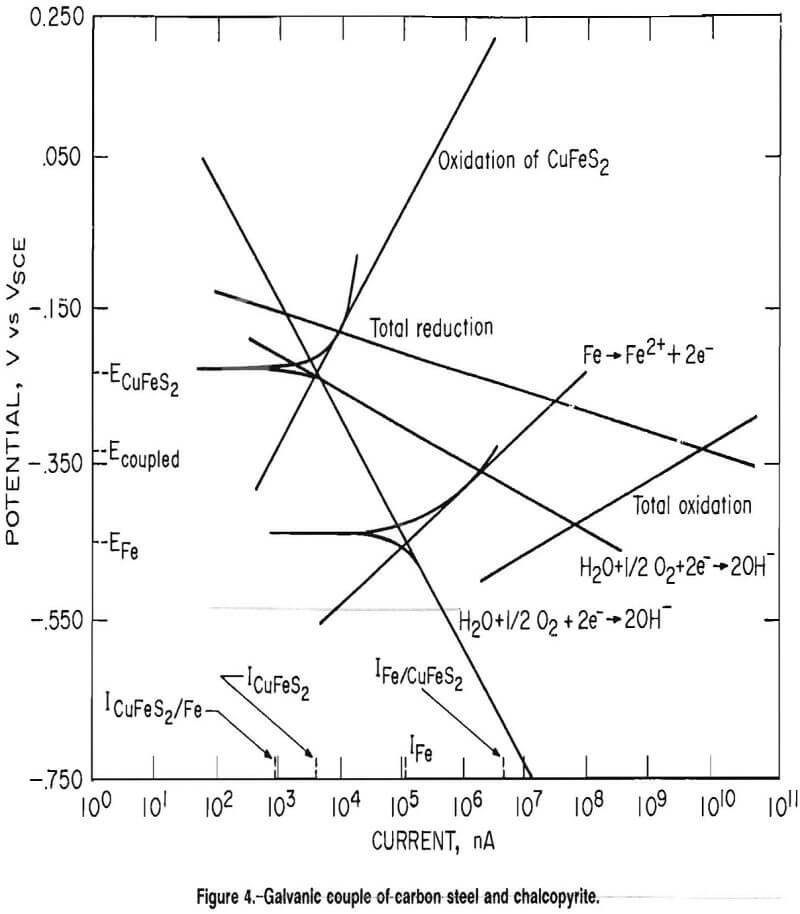
Figure 4 is an overlay of electrochemical scans of a carbon steel and a chalcopyrite electrode. Algebraically adding the cathodic Tafel slopes for the carbon steel and the chalcopyrite and the anodic Tafel slopes for the carbon steel and the chalcopyrite, yields lines representing the total reduction and oxidation, respectively, taking place in the system. The point of intersection of the lines representing the total oxidation and reduction of the system gives the potential of the coupled system. This potential raises the anodic current of the carbon steel from IFe to IFe/CuFeS2) increasing the corrosion rate of the steel, and lowers the anodic current of the chalcopyrite from IcuFes2 t0 IcuFeS2/Fe, decreasing the dissolution rate of the chalcopyrite. To identify the oxidation reaction of chalcopyrite, cyclic voltammetry was performed on the chalcopyrite electrode. Scans were conducted from 0.100 V below the open circuit potential to 1.2 VSCE, then reversed and continued until the current again became cathodic. Scans were conducted using both argon and air as purge gases.
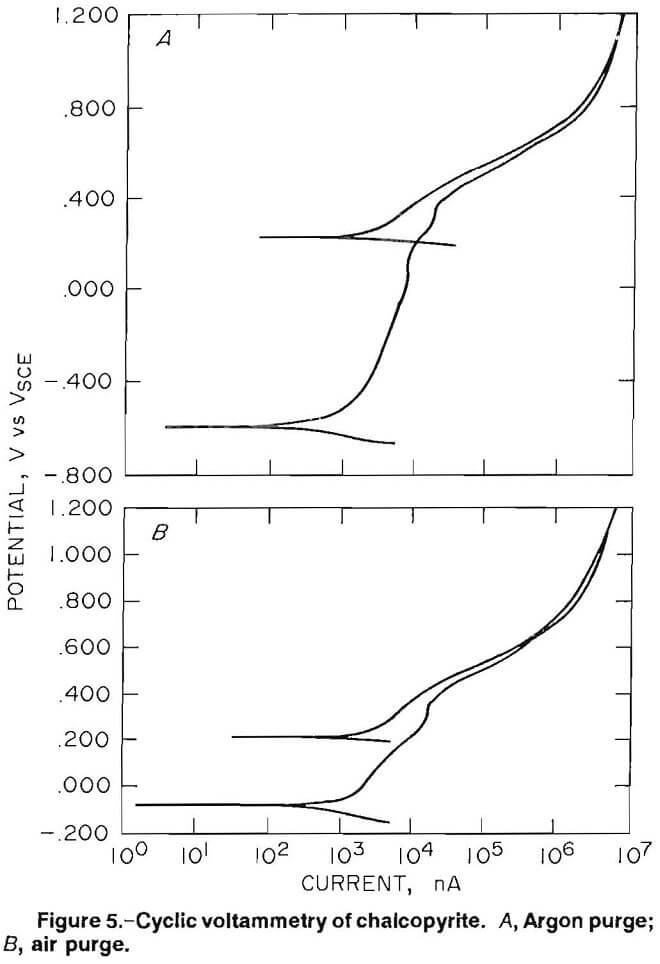
Figure 5A is a plot of the voltammetry scans using an argon purge. The corrosion potential was -0.592 VSCE. After the cathodic-anodic current switch, current became relatively independent of potential until approximately 0.200 Vsce; at this point, the current increased rapidly until the scan was reversed. Upon reversal of the scan, the current followed approximately the same path until 0.215 VSCE, when the current switched from anodic to cathodic. Figure 5B is a voltammetry scan of the chalcopyrite electrode using an air purge. The corrosion potential is -0.082 VSCE 0.510 V higher than using an argon purge.
The drop in corrosion potential, when oxygen was removed from the test cell, is explained by the Nernst equation:
E = E° – RT/zF 1n (K)……………………………………………….(9)
where E = reaction potential,
E° = standard-state reaction potential,
R = ideal gas constant,
T = temperature,
z = number of electrons transferred,
F = Faraday’s constant,
and K = ratio of the activities of the products to reactants raised to their respective stoichiometric coefficients.
Decreasing the oxygen content of the solution would cause the ratio of the products to the reactants to increase, thereby lowering the cell potential. Therefore, oxygen is a reactant and
H2O + ½O2 + 2e- →2OH-…………………………………………………………..(A)
is the predominant cathodic reaction. The remainder of the curve is similar to the scan using the argon purge. A rapid increase in current occurred at approximately 0.200 VSCE then a current reversal took place on the reverse scan at 0.207 VSCE. The sudden increase in current at approximately 0.200 VSCE and the current reversal on the
reverse scan indicates that another anodic reaction proceeds at voltages above 0.200 VSCE.
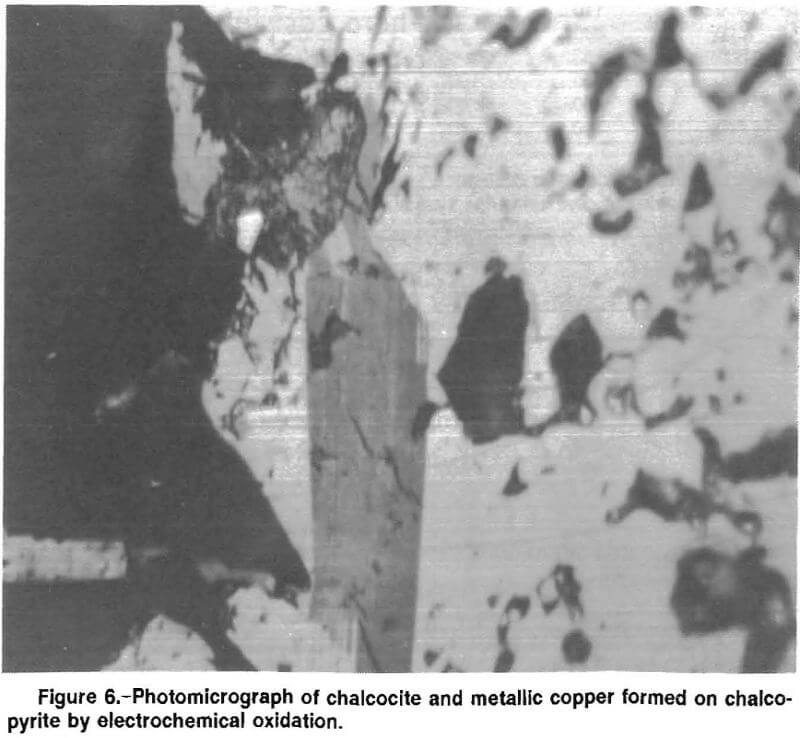
Based upon the results of the cyclic voltammetry work, the chalcopyrite was held at 0.200 V SCE for 16 h and then examined microscopically for reaction products. Figure 6 is a photomicrograph of the chalcopyrite electrode after electrochemical oxidation. The large dark mass at the left side of the picture is a silicate inclusion. The dark gray in the center of the picture is a thin layer of chalcocite formed on the surface of the chalcopyrite, and the circular phase above the chalcocite is elemental copper. The addition of chalcopyrite lowered the pH of the test solution, indicating the formation of acid. The chalcopyrite reacted by the anodic reaction
2CuFeS2 + 4H2O → Cu2S + 2Fe(OH)2 + 4H+ + 3S° + 4e-……………………………………….(B)
When this reaction is coupled with the cathodic reaction
2H2O + O2 + 4e- → 4OH-………………………………………………..(C)
and the reaction
4H+ + 4OH- → 4H2O………………………………………………….(D)
to consume the acid and hydroxide formed, the overall reaction is
2CuFeS2 + 2H2O + O2 → Cu2S + 2Fe(OH)2 + 3S°………………………………………..(E)
Reaction E has a standard-state Gibbs free energy of -47.16 kcal/mol, indicating that the reaction is favored thermodynamically.
Chalcocite forms elemental copper in basic solutions via the reaction
Cu2S + H+ + 2e- → 2Cu° + HS-………………………………………..(F)
At pH 8 and the potentials encountered, the bisulfide would form sulfate via the reaction
HS- + 4H2O → SO4²- + 9H+ + 8e-………………………………………………..(G)
Combining reactions C through G results in the overall reaction
2CuFeS2 + 3H2O + 5/2O2 → 2Cu° + 2Fe(OH)2 + 2H+ + 3S° + SO4²-……………………………….(H)
which has a Gibbs free energy of -147.21 kcal/mol. The elemental sulfur formed would also be oxidized to sulfate, but this is a slow reaction, often involving thiosulfate intermediates, and would, therefore, be of little importance.
Galena
Effect on Corrosion Rates
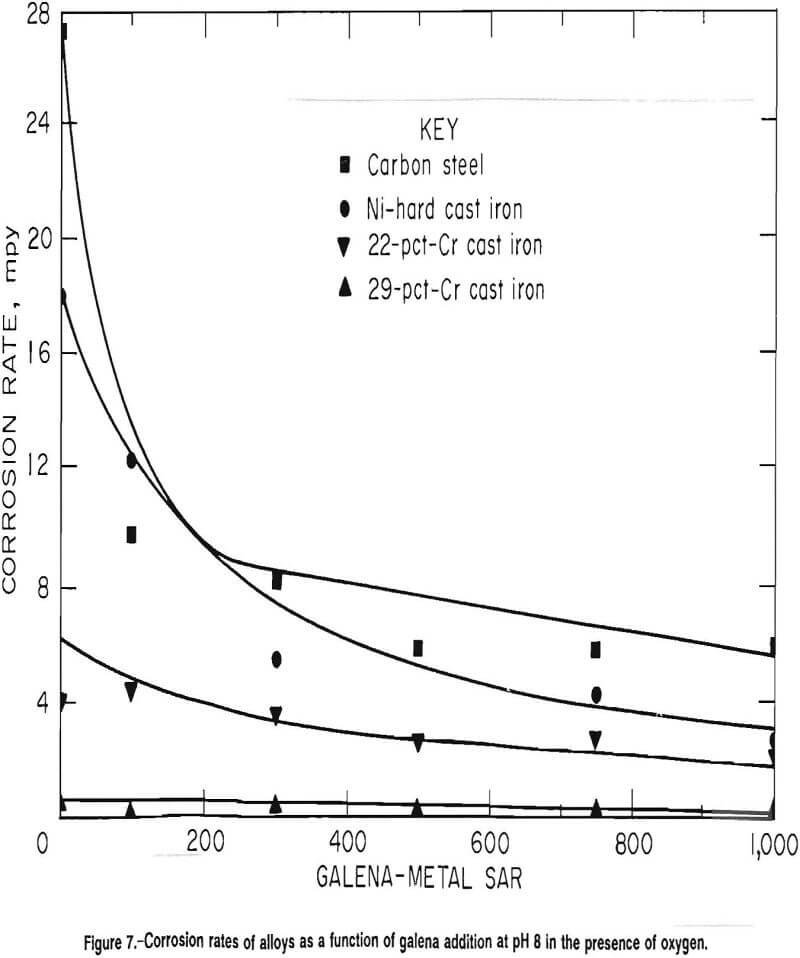
At pH 8 with air as the purge gas, the corrosion rates of carbon steel, Ni-hard cast iron, and 22-pct-Cr cast iron decreased with increased galena addition. The corrosion rate of 29-pct-Cr cast iron was statistically independent of the galena addition but did have a downward trend. The corrosion rate at specific galena additions thus decreased as the grinding media became more highly alloyed. The rates are given graphically in figure 7.
The average corrosion rate of the carbon steel was 27 mpy with a standard deviation of 6.7 mpy in the absence of galena. The average corrosion rate and standard deviation dropped to 9.8 and 5.2 mpy, respectively, at a galena-to-metal SAR of 100 and declined .to an average of 6.6 mpy with a standard deviation of 2.1 mpy at an SAR of 1,000. Attempts to fit first order, second order, and exponential regressions were unsuccessful. A linear model fits the data points with SAR 100 to 1,000:
Rate = -0.004(SAR) + 9.362 mpy………………………………………………….(10)
The average corrosion rate and standard deviation of the Ni-hard alloy were 18 and 6.6 mpy, respectively, in the absence of galena and 2.7 and 1.6 mpy, respectively, at an SAR of 1,000. Attempts to fit a exponential regression to the data were successful and resulted in
Rate = 13.9 exp[-1.88 x 10-³ (SAR)]…………………………………………………..(11)
The corrosion rate of the 22-pct-Cr white cast iron was 4.0 mpy in the absence of galena with a standard deviation of 1.1 mpy. At an SAR of 1,000, the average corrosion rate was 2.1 mpy with a standard deviation of 0.6 mpy. Both linear and exponential regressions fit the data; however, the exponential regression resulted in a better fit statistically than the linear regression. The exponential regression was
Rate = 4.03 exp[-7.20 x 10- 4 (SAR)]………………………………………………………..(12)
The corrosion rate of the 29-pct-Cr cast iron was independent of the galena addition with an average corrosion rate of 0.5 mpy and standard deviation of 0.2 mpy in the absence of minerals and an average corrosion rate of 0.3 mpy and standard deviation of 0.2 mpy at an SAR of 1,000. The overall corrosion rate was 0.3 mpy with a standard deviation of 0.2 mpy.
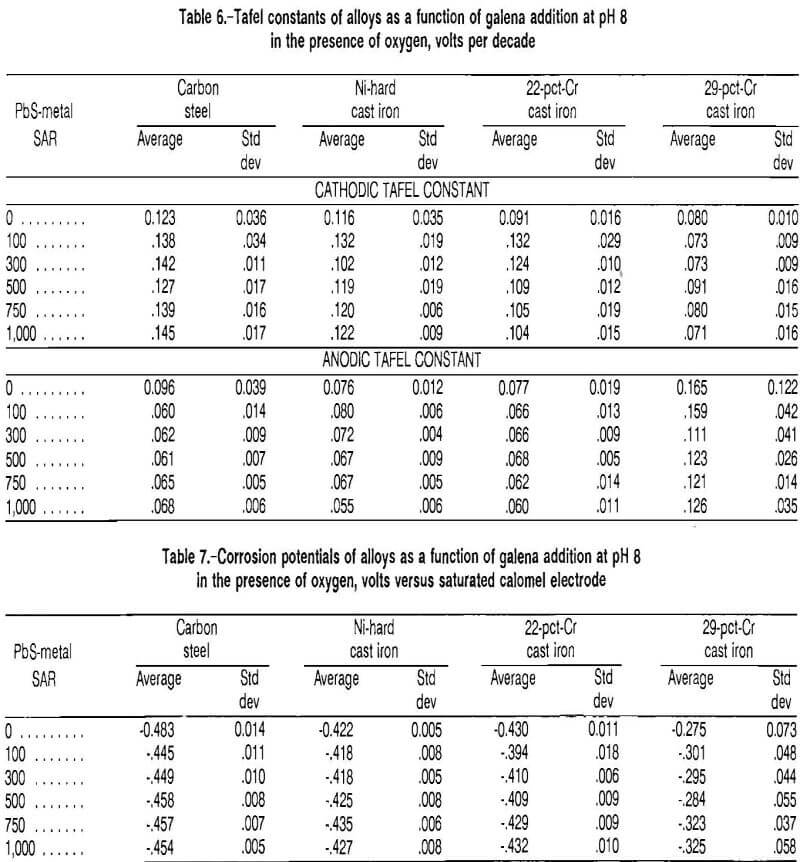
Tafel constants for the four types of grinding media in the presence of oxygen, i.e., using an air purge, are given in table 6. The cathodic Tafel constant was independent of the galena addition in all instances, indicating that the galena was not involved in a cathodic reaction. This would leave reaction A as the predominant cathodic reaction. The relatively high pH would preclude the reduction of acid as a possible cathodic reaction. The anodic Tafel constant of the carbon steel, Ni-hard cast iron, and 22-pct- Cr cast iron all decreased with increased galena addition, indicating that galena was participating in the anodic reaction. The anodic Tafel constant of the 29-pct-Cr cast iron was statistically independent of galena addition but did have a downward trend. The high anodic Tafel constant of the 29-pct-Cr cast iron indicates that it was passivated. Passivation was not observed in the other three alloys.
The corrosion potentials of the four types of grinding media at pH 8 with an air purge are given in table 7. The corrosion potential of the carbon steel had an average value and standard deviation of -0.483 VSCE and 0.014 V, respectively, in the absence of galena, increased to an average value and standard deviation of -0.445 VSCE and 0.014 V, respectively, at an SAR of 100, and was statistically invariant at higher galena additions. The corrosion potentials of the other three alloys were statistically independent of the galena addition, but similar upward trends did exist.
Synergistic Effects of Galena, Oxygen, and pH on Corrosion of Carbon Steel
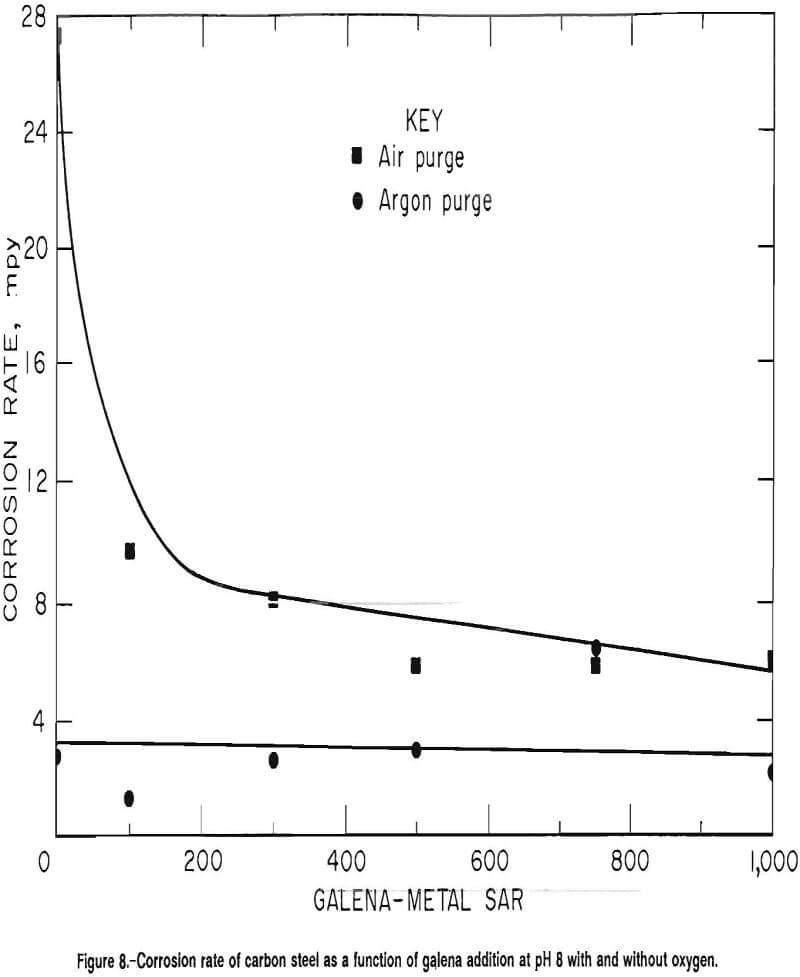
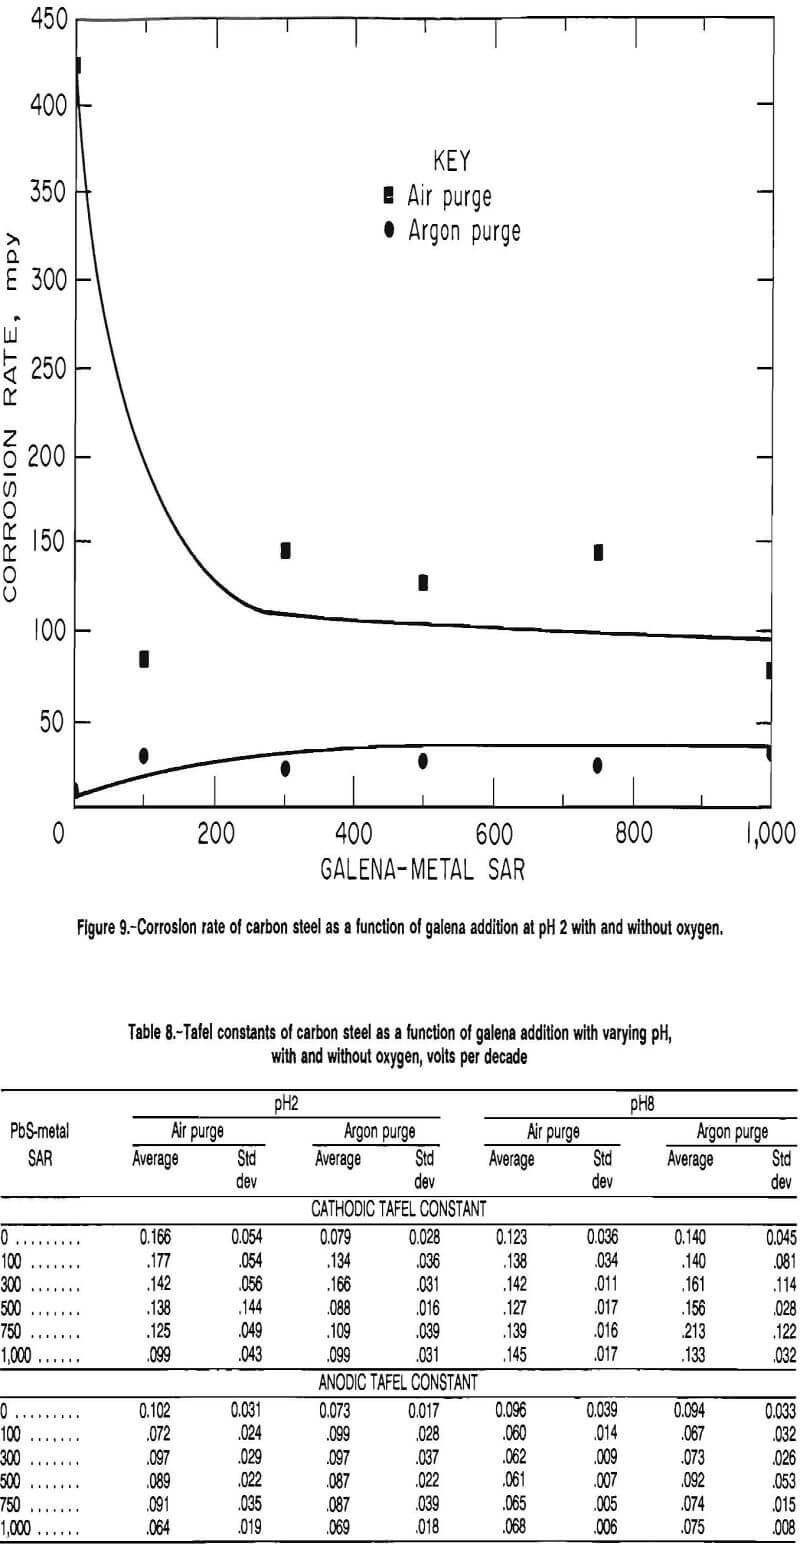
Corrosion rates of carbon steel at pH 8, with air and argon purges, are given as a function of galena addition in figure 8. Using air as the purge gas, the rate decreased from an average and standard deviation of 27 and 6.7 mpy, respectively, in the absence of galena to an average and standard deviation of 6.0 and 2.1, respectively, at an SAR of 1,000. In the absence of oxygen, i.e., using argon as the purge gas, the corrosion rate was statistically independent of galena addition. The rate had an average and standard deviation of 2.7 and 0.9 mpy, respectively, in the absence of galena and had an average and standard deviation of 2.1 and 1.0 mpy, respectively, at an SAR of 1,000.
The corrosion rates of carbon steel at pH 2 with air and with argon purges are given in figure 9. In the presence of oxygen, the corrosion rate had an average and standard deviation of 424 and 230 mpy, respectively, in the absence of galena and had an average and standard deviation of 84 and 32 mpy, respectively, at an SAR of 100. The corrosion rate was invariant at higher galena additions, with an average standard deviation of 77 and 39 mpy, respectively, at an SAR of 1,000.
In the absence of oxygen, the rate increased with the initial galena addition, but at the higher galena additions (SAR 100 to 1,000) was independent of galena addition. The corrosion rate had an average and standard deviation of 9.9 and 3.8 mpy, respectively, in the absence of galena, and increased to an average and standard deviation of 30.4 and 7.8 mpy, respectively, at an SAR of 100. The corrosion rate had an average and standard deviation of 25.9 and 8.8 mpy, respectively, at an SAR of 1,000.
The Tafel constants for carbon steel at pH 2 and 8 using both air and argon as purge gases are given in table 8. At pH 8, the cathodic Tafel constant was statistically independent of the galena addition, but there was an upward trend, which corresponds with the lowering of the corrosion rate. When the test solution was purged with argon, the cathodic Tafel constant was consistently higher than when the test solution was purged with air, indicating that diffusion of oxygen was more important as a rate controlling step than when using air as the purge gas. The anodic Tafel constant was independent of the purge gas used, indicating that the same anodic reaction was occurring under both conditions.
At pH 2, the cathodic Tafel constant was significantly higher in the presence of oxygen than in the absence of oxygen, showing that different cathodic reactions occurred, one of which was dependent on the presence of oxygen. In the presence of oxygen, the average value and standard deviation were 0.166 and 0.054 V/decade, respectively, as opposed to an average value and standard deviation of 0.079 and 0.028 V/decade in the absence of oxygen.
In the tests with SAR 100 to 1,000, the cathodic Tafel constant was statistically independent of galena addition and of the purge gas, indicating that the presence of galena was the controlling factor in the cathodic reaction. The anodic Tafel constant was again independent of the purge gas using in the test cell, indicating that the anodic reaction was not changed by removing oxygen from the test cell.
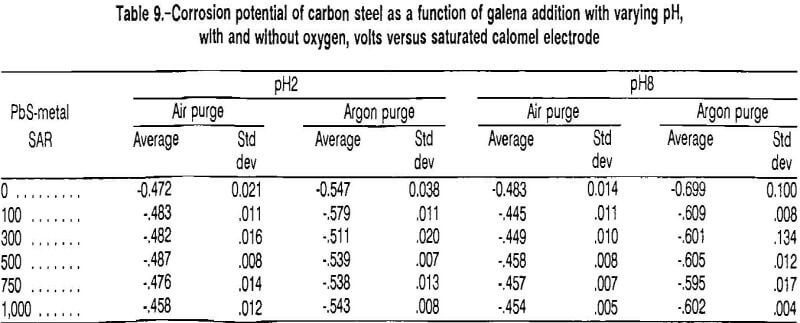
The corrosion potentials are given in table 9. At pH 8 and in the presence of oxygen, the corrosion potential was statistically invariant at SAR’s of 100 and higher. In the absence of oxygen, the corrosion potential increased from an average and standard deviation of -0.699 VSCE and 0.100 V, respectively, in the absence of galena to an average and standard deviation of -0.602 VSCE and 0.004 V, respectively, at an SAR of 1,000. At pH 2, the corrosion potential was statistically independent of the galena addition, both in the presence and in the absence of oxygen; it was significantly lower in the absence of oxygen.
The drop of corrosion potential with the removal of oxygen again indicates that oxygen was a reactant, which is explained by the Nernst equation. From figure 8, it is apparent that at basic pH values, where the predominant cathodic reaction is the reduction of oxygen, that oxygen must be present for galena to reduce the corrosion rate of ferrous materials. The galena, therefore, may be acting as an oxygen scavenger.
It has been shown that galena dissolves anodically in acidic solution via the reaction
PbS → Pb² + S° + 2e-………………………………………………..(I)
and in basic solution (17) via the reaction
PbS + 2H2O → Pb(OH)2 + S° + 2H+ + 2e-…………………………………………..(J)
When reactions I and J are coupled with the cathodic reactions of
2H+ + ½O2 + 2e- → H2O………………………………………………………….(K)
and reaction A, the respective overall reactions are
PbS + 2H+ + ½O2 → Pb2+ + S° + H2O……………………………………………(L)
at acidic pH values and
PbS + ½O2 + H2O → Pb(OH)2 + S°…………………………………………………..(M)
at basic pH values. Both of these reactions consume oxygen and therefore may act as oxygen scavengers.
The drop in corrosion rate with the removal of oxygen at pH 2 indicates the predominant cathodic reaction is reaction K while the reaction
2H++ 2e- → H2………………………………………………………..(N)
is also occurring, but at a much less rapid rate. Reduction in the corrosion rate of ferrous material by galena, when oxygen reduction is the predominant reaction at acidic pH values, is further confirmation that galena acts as an oxygen scavenger.
In the absence of oxygen, reaction N would be the predominant cathodic reaction at low pH levels. The absence of oxygen reduction would prevent galena from reducing the corrosion rate through an oxygen scavenger mechanism.
Standard-state oxidation potentials are 0.126 VNHE for lead and 0.441 VNHE for iron, indicating that lead is more noble than iron. This would cause the lead ion formed by reaction I to react with iron in the grinding media according to the reaction
Pb2+ + Fe° → Fe2+ + Pb°…………………………………………………………(O)
An examination of the metastable Pourbaix diagram for galena reveals that galena at pH 2 and at the potentials encountered forms lead and H2S. The H2S could be formed by the reaction
2H+ + S° + 2e- → H2S………………………………………………………………(P)
Reactions I, O, and P add to form the overall reaction
PbS + 2H+ + Fe° → Pb° + Fe2+ + H2S……………………………………………………(Q)
This reaction has a standard-state Gibbs free energy of -6.04 kcal/mol. Using the equation
ΔG = ΔG° + RT 1n (K)………………………………………………….(13)
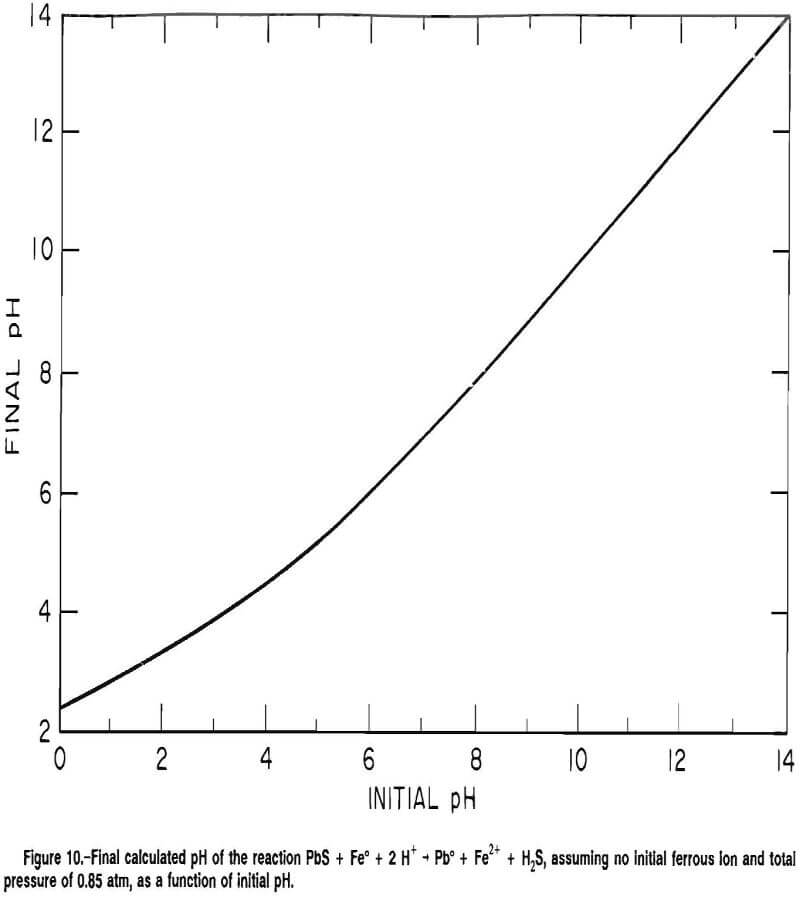
the equilibrium constant of reaction Q was determined to be 27,000. Using the equilibrium constant and the fact that reaction Q consumes two hydrogen ions for every ferrous iron produced, the final pH of a system in which this reaction is occurring was calculated as a function of the initial pH (fig. 10), assuming that there was no initial iron in solution and that the total pressure above the system was 0.85 atm. Above a pH of 6, the final and initial pH are virtually the same, indicating that the reaction does not proceed under this condition.
Sphalerite
Effect on Corrosion Rates
The effect of sphalerite varied with the type of grinding media. The corrosion rate of the carbon steel, Ni-hard cast iron, and 22-pct-Cr white cast iron increased with increased sphalerite addition, while the corrosion rate of the 29-pct-Cr white cast iron decreased with the addition of sphalerite.
The corrosion rates are given in figure 11. The corrosion rate of the carbon steel had an average and standard deviation of 27 and 6.6 mpy, respectively, in the absence of sphalerite and an average and standard deviation of 63 and 30 mpy, respectively, at a sphalerite- to-metal SAR of 1,000. The data were fit by the linear model
Rate = 0.03(SAR) + 26.8 mpy……………………………………………..(14)
The corrosion rate of the Ni-hard cast iron increased from an average and standard deviation of 18 and 6.9 mpy, respectively, in the absence of sphalerite to an average and standard deviation of 21 and 5.4 mpy, respectively, at an SAR of 1,000. The linear regression
Rate = 4.3 x 10-³(SAR) + 15.1 mpy………………………………………………….(15)
fits the data at the 95-pct-confidence level.
The corrosion rate of the 22-pct-Cr white cast iron increased from an average and standard deviation of 4.0 and 1.1 mpy, respectively, in the absence of sphalerite to an average and standard deviation of 7.1 and 3.4 mpy, respectively, at an SAR of 1,000. The data were fit by the model
Rate = 2.8 x 10-³(SAR) + 3.3 mpy………………………………………………………….(16)
The corrosion rate of the 29-pct-Cr white cast iron decreased with the addition of sphalerite. The corrosion rate had an average and standard deviation of 0.5 and 0.2 mpy, respectively, in the absence of sphalerite and decreased to an average and standard deviation of 0.3 and 0.2 mpy, respectively, at an SAR of 1,000. The linear regression
Rate = -1.0 x 10- 4 (SAR) + 0.4 mpy…………………………………………………………(17)
fits the data at the 95-pct-confidence level.
Tafel constants as a function of sphalerite addition are given in table 10. The cathodic Tafel constant of carbon
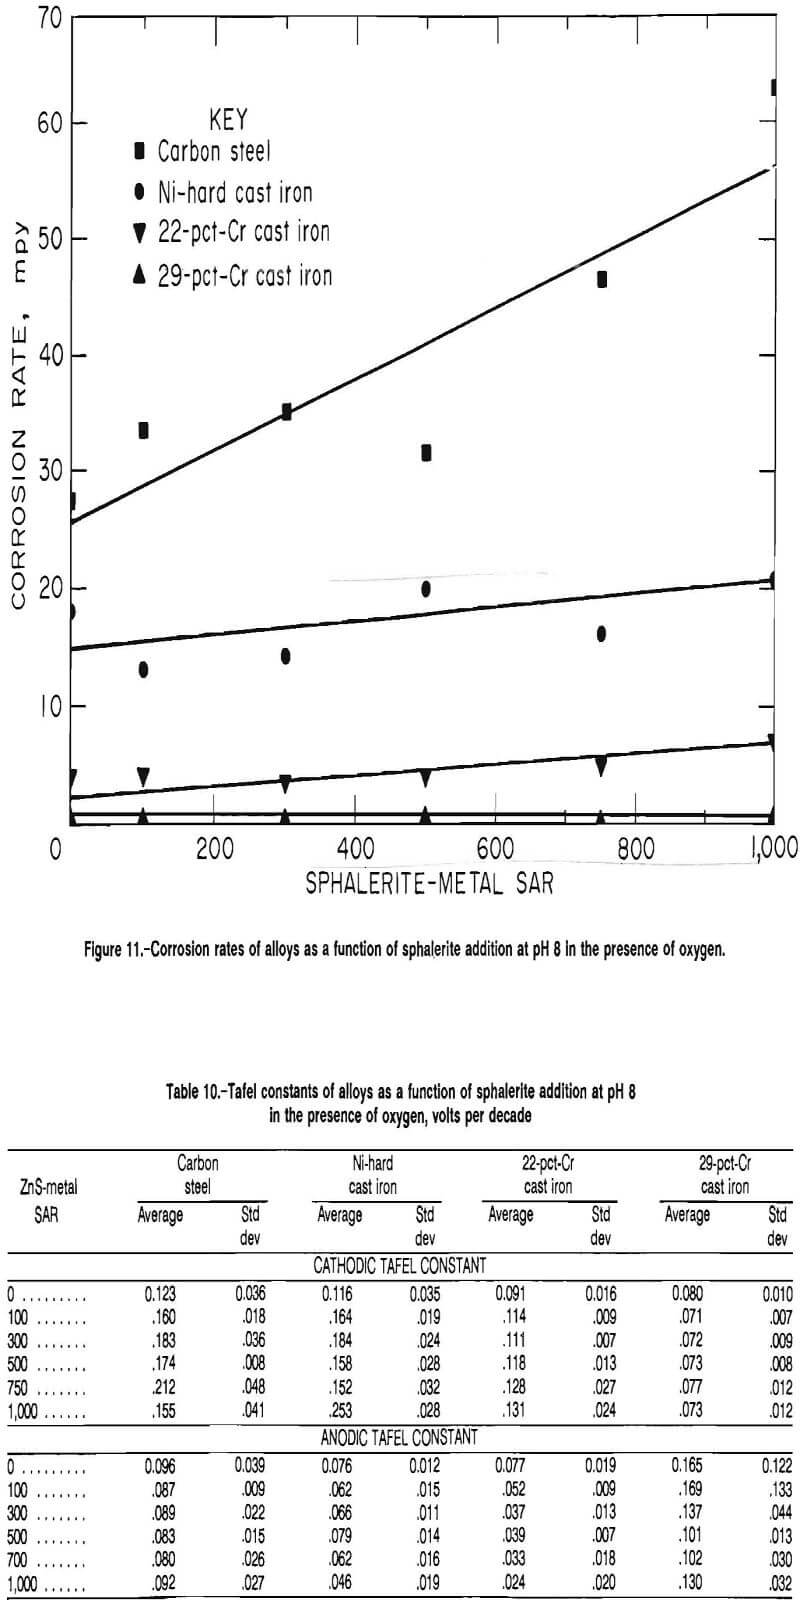
steel, Ni-hard cast iron, and 22-pct-Cr cast iron all increased with the addition of sphalerite, indicating that the rate of the cathodic reaction was decreased by the addition of sphalerite. The cathodic Tafel constant of the 29-pct-Cr white cast iron was statistically independent of sphalerite addition. The anodic Tafel constant of the carbon steel was statistically independent of sphalerite addition, while the anodic Tafel constants of the Ni-hard cast iron and the 22-pct-Cr white cast iron decreased with increased sphalerite addition. The anodic Tafel constant of the 29-pct-Cr white cast iron was statistically indepen¬dent of the sphalerite addition but did have a downward trend.
The cathodic Tafel constant, being greater than the anodic Tafel constant for the carbon steel, Ni-hard cast iron, and the 22-pct-Cr white cast iron, indicates that the corrosion reaction was controlled by the cathodic half reaction. The anodic Tafel constant for the 29-pct-Cr white cast iron was greater than the cathodic Tafel constant, indicating that the corrosion reaction of the 29-pct-Cr cast iron was controlled by the anodic half reaction.
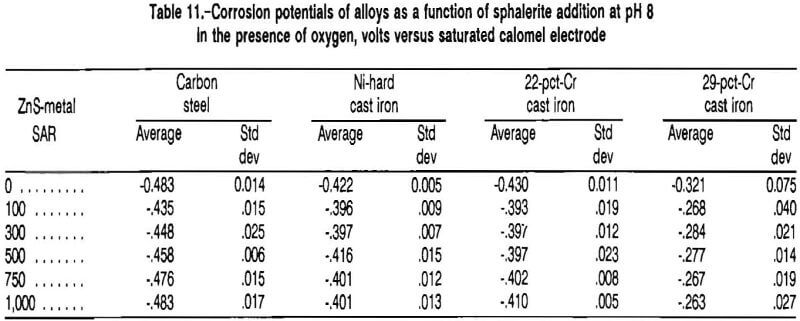
The corrosion potentials of the four alloys are given in table 11 as a function of sphalerite addition. Generally, the corrosion potential of the metal increased with the initial sphalerite addition and was independent of the sphalerite addition when the SAR was greater than 100. The change in corrosion potential with sphalerite addition indicates that the sphalerite was participating in an electrochemical reaction.
Electrochemical Reactions
Sphalerite is a nonconductor, making it impossible to perform electrochemical testing on sphalerite. From theoretical thermodynamics, it has been determined that the predominant species formed by sphalerite in aqueous systems is Zn(OH)2 at basic pH values, and that Zn²+ is predominant at acidic pH values.
One possible reaction of sphalerite in basic solutions is the anodic reaction
ZnS + 2H2O → Zn(OH)2 + 2H+ + S° + 2e-……………………………………………………..(R)
When coupled with the cathodic reaction (reaction A) and reaction D, which consumes the acid and hydroxide formed, the overall reaction is
ZnS + H2O + ½O2 → Zn(OH)2 + S°………………………………………….(S)
Reaction S has a standard-state Gibbs free energy of -29.54 kcal/mol, indicating that it is favored thermodynamically.
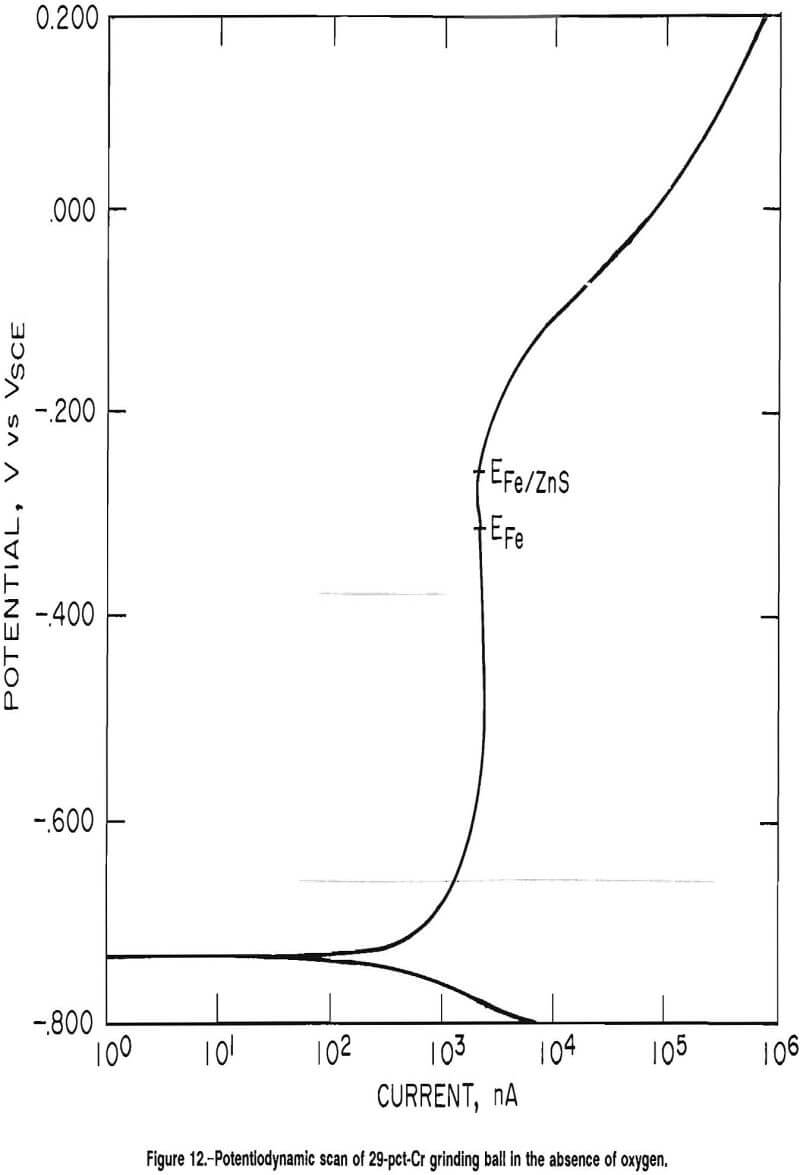
The decrease in the corrosion rate of the 29-pct-Cr white cast iron grinding media is explained by the active-passive behavior of the high-chromium white cast iron. Figure 12 is a potentiodynamic scan of a 29-pct-Cr white cast iron grinding ball using an argon purge at pH 8. At basic pH values, the predominant cathodic reaction is reaction A.
The potential of reaction A is determined by the Nernst equation. Because oxygen is a reactant, lowering its concentration would lower the voltage of the cathodic reaction, exposing more of the curve characteristic of the anodic reaction. The corrosion potential of the 29-pct-Cr white cast iron in oxygenated solution had an average value of -0.321 VSCE in the absence of minerals, corresponding to point EFe, on figure 12. At an SAR of 1,000, the corrosion potential of the 29-pct-Cr white cast iron had an average value of -0.263 VSCE, which corresponds to point EFe/ZnS in figure 12. From figure 12, it is evident that the anodic current is less at EFe/ZnS than at EFe, explaining the decrease in corrosion rate as sphalerite is added to the test cell.
Conclusions
The presence of chalcopyrite increases the corrosion rate of ferrous alloys through a galvanic couple. The chalcopyrite reacts via an anodic reaction to produce chalcocite and ferrous hydroxide; the chalcocite then further reacts to form elemental copper.
The presence of galena lowers the corrosion rate of ferrous alloys through an oxygen scavenger mechanism when the predominant cathodic reaction is oxygen reduction. When the predominant cathodic reaction is reduction of hydrogen ions, the presence of galena increases the corrosion rate of carbon steel because lead ions leached out of the galena react via a cementation reaction with the ferrous material.
Sphalerite increases the corrosion rate of carbon steel, Ni-hard cast iron, and 22-pct-Cr cast iron through a galvanic couple. Sphalerite decreases the corrosion rate of 29-pct-Cr cast iron because of a galvanic couple that alters the potential of the metal to a region of lesser anodic current, which results from the active-passive nature of the metal.
