Table of Contents
We will discuss the fundamental elements of cutoff grade optimization and demonstrate how cutoff grade optimization may improve NPV of a given operation under different scenarios. The first case study is a description of cutoff grade optimization for a gold deposit to be mined in a single push-back with a small mill capacity. The second case study is a large copper deposit with multiple push-backs with the option to stockpile. The third case study is description of cutoff grade optimization for a large copper gold deposit to be mined in multiple push-backs with the option to stockpile.
Cutoff Grade Optimization for a Gold Deposit
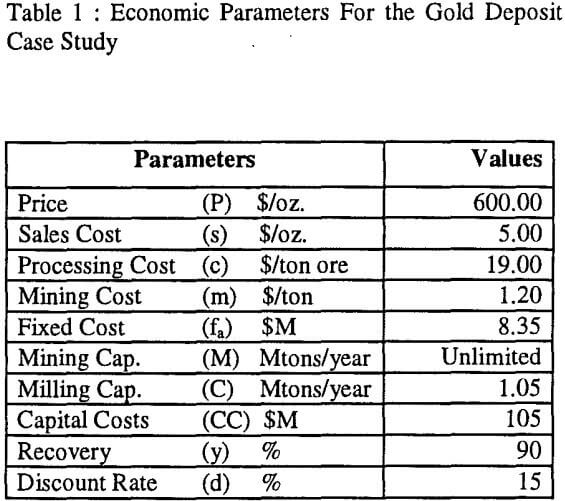
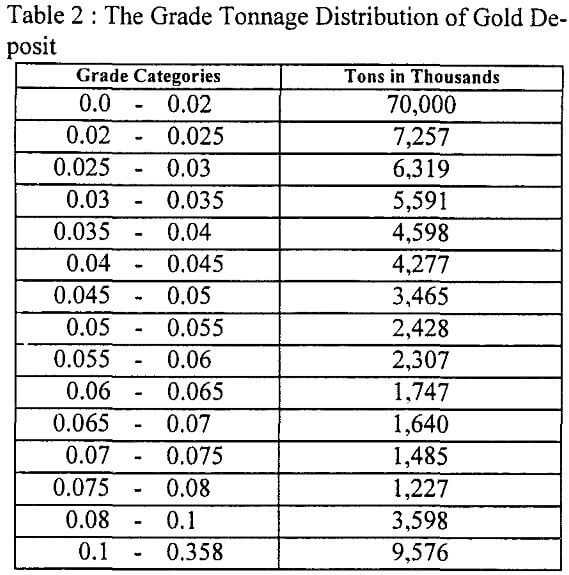
Consider a hypothetical case study where an epithermal gold deposit will be mined by an open pit. Table 1 gives assumed capacities and accepted costs to mine this deposit at 3000 tons/day milling rate. Table 2 gives the grade distribution of the material within the ultimate pit limits.
Operating Cash Flow Analysis for Break-even Cutoff Grades
The break-even cutoff grade that maximizes the un-discounted profit function in a given year is:
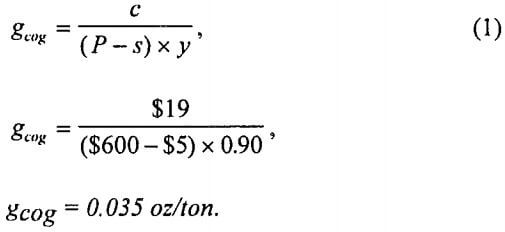
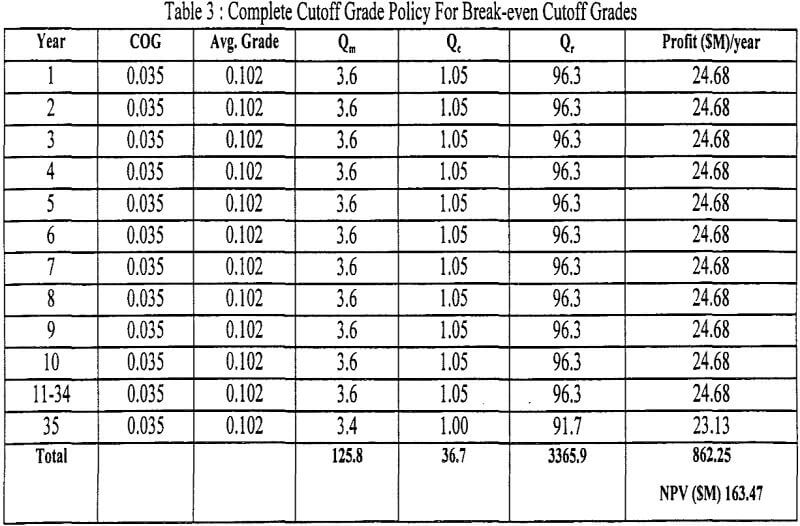
At a 0.035 oz/ton cutoff, assuming that the tons that will be mined in a given time will be a mixed blend of grade distribution given in Table 1, there is a total of 36.7M tons of ore at an average grade of 0.102 oz/ton and 88.8 tons of waste (SR = 2.42 : 1 ). Mining the deposit with traditional break-even cutoff grade of 0.035 oz/ton at 1.05M tons of milling capacity results in a 35 year exploitation and cash flow schedule which is given in Table 3.
In Table 3, Qm is the amount of total material (ore + waste) mined in millions of tons in a given year; Qc represents the ore tonnage (in millions) processed by the mill; Qr represents the recovered ounces (in thousands) produced in a given year. The annual cash flows are given as profits in millions of dollars, and they are determined by using the following equation:
Profit = (P – s) x Qr – c x Qc – m x Qm – fa………………………………………….(2)
Operating Cash Flow Analysis for Optimum Cutoff Grades
The cutoff grade equation that maximizes the NPV of the cash flows coming from the deposit when the mill capacity is limited is given as ( See Lane 1964 and Dagdelen 1992 for the basis of this equation):
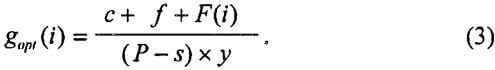
Where i = l, N ( mine life), and gopt (i) is the cutoff grade to be used in year i; F(i) is the opportunity cost per ton of material milled in year i and it is defined as:
F (i) = d x NPV(i)/C…………………………………………………..(4)
where NPV (i) is NPV of future cash flows of
the years i through the end of mine life N; d is the discount rate ; and C is the total milling capacity in year i.
The f is the fixed costs per ton ore milled in a year and it is defined as :
f = fa/C…………………………………………………………………..(5)
where fa is the annual fixed costs.
For example, according to above equations 3, 4, and 5 the optimum cutoff grade for year 1 can be calculated as follows :
F(l) = 0.15 x $413.8/1.05
F (l) = $58.56/ton of ore milled,
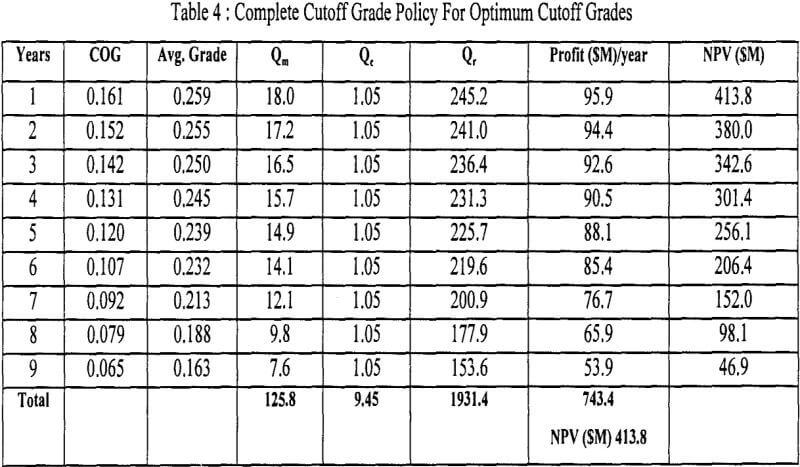
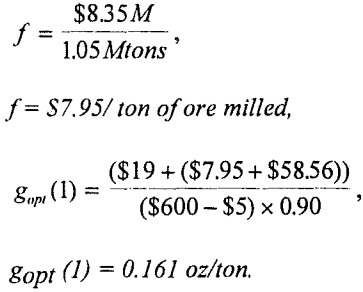
Table 4 gives yearly tons and grade schedules resulting from optimum cutoff grades calculated for each year similar to year 1. The increased NPV of the cash flows from $163.47 in Table 3 to $413.8 in Table 4 is quite noticeable. The cash flows determined by the optimum cutoff grade strategy result in 153% higher NPV and 13.8% lower un-discounted profits than the traditional constant break-even approach.
The underlying philosophy in inclusion of the opportunity cost F (i) in the cutoff grade equation is that every deposit has a given net present value (NPV) associated with it at a given point in time and that every ton of material processed by the mill in a given year should pay for the cost of not receiving the future cash flows by one year sooner. Put another way, the opportunity cost F(i) should be viewed as the cost of processing the low grade now when higher grades are still available.
Determination of the NPV of the mining operation at a given point in time is an iterative one. The first cutoff grades to be applied during the life of mine are determined by assuming zero NPV. This results in initial cash flows and a resulting NPV for each year. During the second iteration, the cutoff grades are determined again by using these declining NPVs for each individual year resulting in a new cash flow schedule and NPV for each year. Iterations continue until the cutoff grade strategy and the resulting cash flows converge and stay constant.
The iterative steps of optimization are calculation intensive and time consuming; thus we have developed a computer program called “CSM-optiNPV Cut-off” to handle them. The optimization algorithm that is used in this program is given in Dagdelen (1992) and Dagdelen (1993).
The effect of cutoff grade optimization on the processed tons is significant. Even though the total tons mined within the ultimate pit are same for the break-even strategy given in Table 3 and the optimum cutoff grade strategy given in Table 4, the amount of material milled is significantly lower both in tons (i.e. 36.7M tons versus 9.45M tons) and in ounces recovered ( i.e. 3.37M ounces versus 1.93M ounces). The effect of the optimization strategy on the mine life is also significant; shortening of the mine life from 35 years in Table 3 to less than 10 years in Table 4 is the tradeoff between the optimum NPV approach versus the traditional break-even approach. It should be pointed out again that site conditions may not allow the stockpiling of intermediate ore whose grade is between the break-even and the higher optimum cutoff grades. If the stockpiling was allowed, then the stockpiled material has to be worked into the mining schedule given in Table 4 or processed at the end of the mine life. The cutoff grade optimization with the stockpiling policy further enhances the NPV of a given mining project and this will be discussed in the following section.