This paper presents a development of thickening theory which provides a reliable and easy-to-use method for determining the size of continuous thickeners from batch settling tests. It also offers a description of thickener operation performance based upon the proposed method.
Thickener Operation
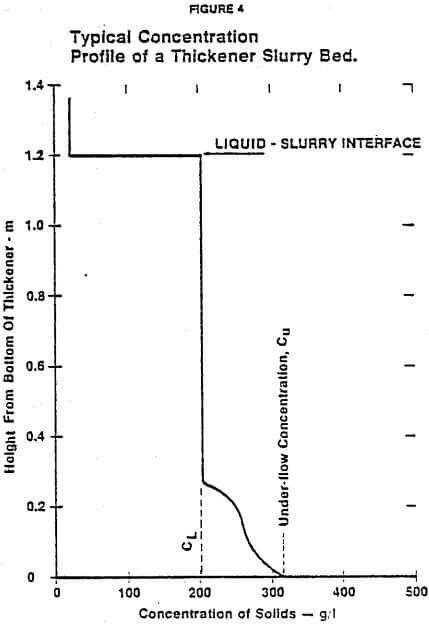
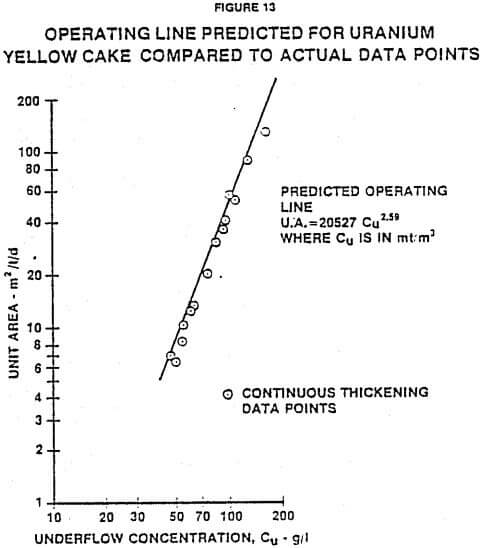
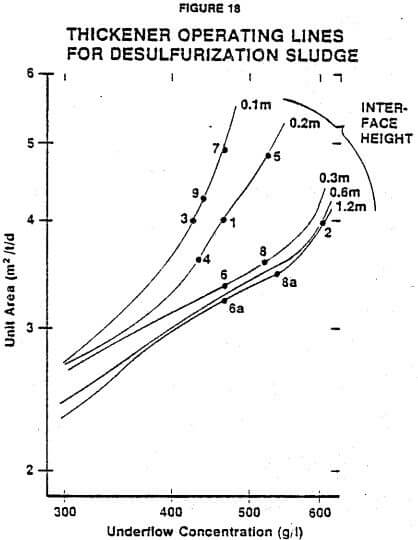
Figure 13 shows a log-log relationship between underflow concentration and unit area at various interface heights for a desulfurization sludge. This graph was made from the data gathered in the continuous tests, considering the interface height recorded for each run instead of the inventory of solids in the thickener.
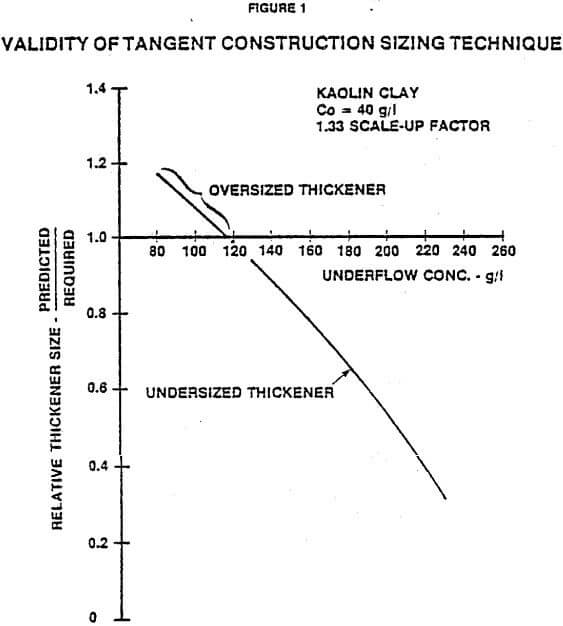
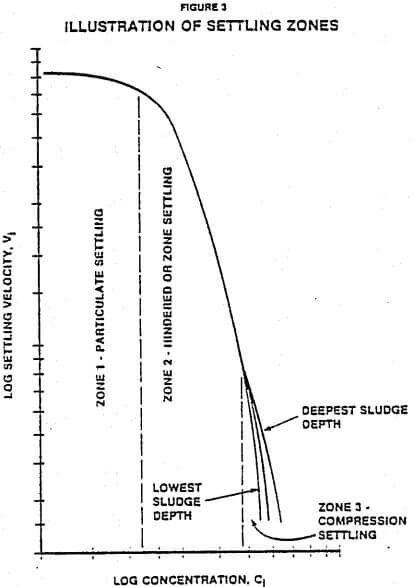
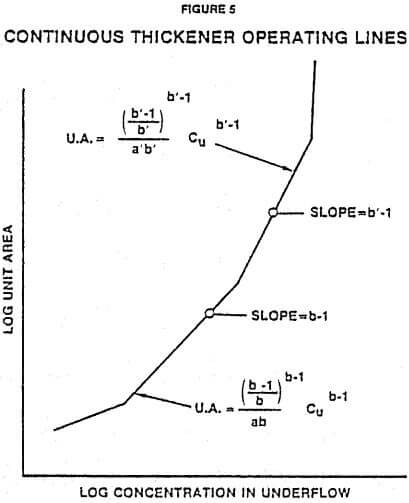
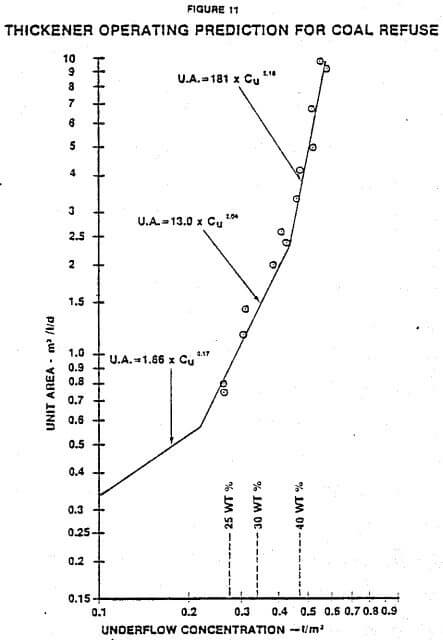
There has been some discussion on whether or not only one underflow concentration can exist at a certain unit area. One side of the discussion reasons that at a particular feed rate, there is only one underflow concentration and underflow pumping rate that will give a stable bed level. This is approximately correct when relatively low underflow concentrations are expected, because there is little or no compression taking place in the thickener. Thickening proceeds in the hindered settling zone described earlier in this paper. In this settling zone, the settling rats of a particular concentration layer is not effected by the existence of solids above it. Therefore, a particular underflow concentration corresponds to only one unit area. However, as shown in Figure 18, when there is an effect of compression force, there can be many different operating lines. Depending upon how the thickener is operated, different underflow densities can be obtained at the same unit area.
As shown in Figure 18, below concentrations of approximately 400 g/l, the operating lines tend to come together. In this range of operation, the thickener is more sensitive to changes in feed solids rate, and is relatively insensitive to changes in bed depth. Therefore, changes in bed depth will not alter thickener performance significantly. Changes in feed rates will have more drastic effects on solids inventories unless the underflow pumping rate is adjusted to compensate. If the feed solids rate is increased and the underflow rate is not adjusted, the interface height will gradually increase until it overflows the thickener. Also, if the feed rate decreases, the interface height will drop until eventually there is no clear slurry-liquid interface.
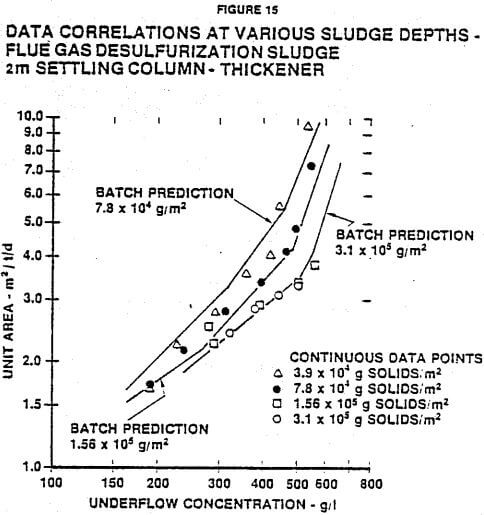
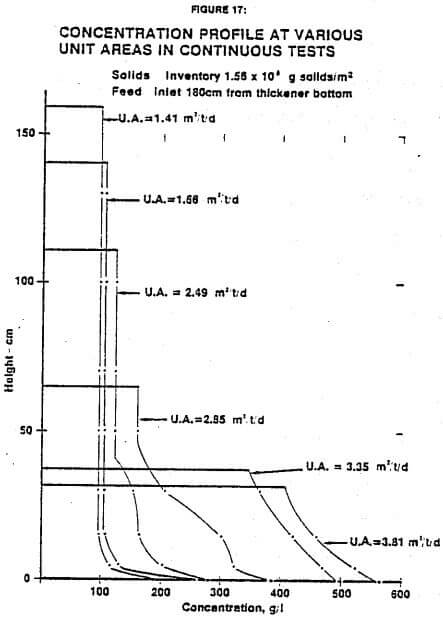
At the higher underflow concentrations shown in Figure 17, there is an increased effect of compression force on the solids, and the operating lines diverge at the various interface heights. However, above a slurry depth of 0.3 meters, the effect of compression force begins to decrease so that the operating lines come closer together.
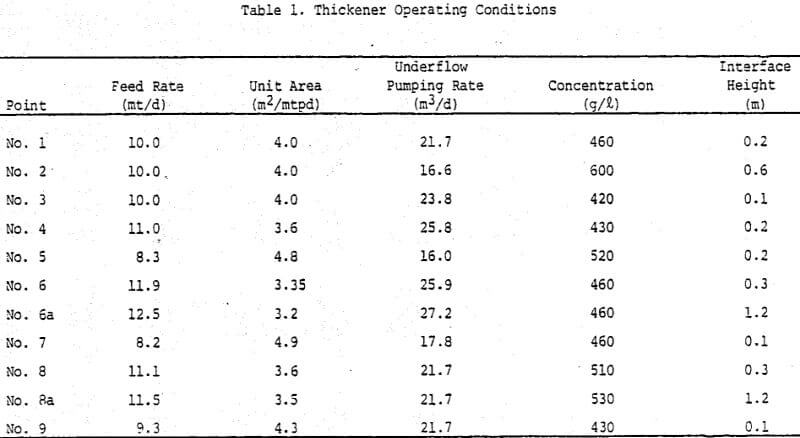
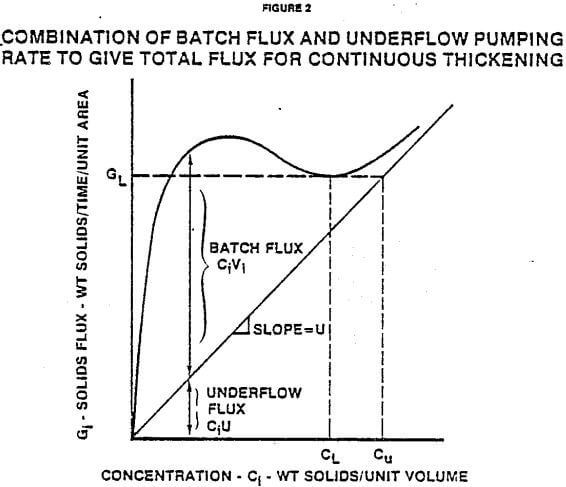
Various operating points are shown in Figure 18 to illustrate concepts of operation of the thickener. Table 1 is a summary of the operating conditions at each of the points illustrated. For this example, the following relationships apply:
Feed rate x unit area = 40 m²
Underflow rate x underflow conc./1000 = feed rate
As a starting point, it is assumed that the thickener, which has a thickening area of 40 m², is operating at steady-state at point no. 1. If the underflow pumping rate is then dropped from 21.7 to 16.6 m³/day without changing the feed solids rate, a new steady-state condition will be established at point no. 2. The interface height will increase from 0.2 to 0.6 m at the greater depth, and the underflow concentration will increase from 460 to 600 g/l. At point no. 3 the underflow pumping rate is increased and the resulting change is opposite to point no. 2.
These cases illustrate that the underflow concentration can be controlled by the underflow rate even though the feed rate remains constant.
Thickeners are often operated to keep the interface height constant using a level control device or manual measurements of the sludge level. In this case, if the feed solids rate is increased from 10.0 to 11.1 metric tons/day, the operating point at steady-state will move from point no. 1 to point no. 4. The underflow pumping rate will have to increase from 21.7 to 25.8 m³/day to remove the higher feed solids rate. The resulting lower unit area decreases the underflow concentration to 430 g/l. Operating point no. 5 is the case in which the feed solids rate is decreased and the change of conditions is opposite to point no. 4. Operating points no. 4 and 5 show that keeping the interface level constant causes a significant change in underflow concentration due to varying feed rates.
Many thickeners are operated to give a constant underflow concentration using an underflow density gauge to control the underflow pumping rate. In this case, if the feed solids rate is increased from 10.0 to 11.9 metric tons/day, the operating point at steady-state moves from no. 1 to no. 6. The underflow pumping rate will have to increase from 21.7 to 25.9 m³/day to keep the underflow concentration from increasing due to the higher compression force at the deeper sludge depth. If the feed solids rate is again increased by approximately 5% to 12.5 metric tons/day, the interface height will increase to 1.2 meters as shown in operating point 6a. If the feed solids rate increases by more than approximately 25%, the sludge interface would increase to overflow the thickener. Operating point no. 7 is the opposite condition where the feed solids rate decreases. In this case, the bed depth decreases and the underflow pumping rate must decrease in order to keep the underflow solids concentration constant.
Most thickeners are operated at a fixed pumping rate without any control device such as level control or underflow concentration control. In this case, if the feed solids rate is increased from 10.0 to 11.1 metric tons/day, the operating point at steady-state moves from point no. 1 to point no. 8 with a slope of -1.0, because the unit area times the underflow concentration is constant at constant underflow pumping rate. The interface height will increase until it produces enough compression force to compensate for the increase in feed solids rate. The interface height and underflow concentration increase from 0.2 to 0.3 meters and from 460 to 510 g/l, respectively. Point no. 8a shows that another increase of feed solids rate causes a drastic increase of the interface height from 0.2 to 1.2 m because the underflow concentration does not change significantly at the higher compression force. An increase in feed solids rate of more than 15% from point no. 1 will cause the interface to overflow the thickener. Operating point no. 9 is the opposite case in which the feed solids rate is decreased. Again the interface height and underflow concentration drop.
It should be noted that with these influences of bed depth it is possible for the unit area to increase and yet have the underflow concentration drop if a lower bed depth is established in the thickener. This is contrary to the normal situation in which higher unit areas produce higher underflow concentrations at constant bed depth.
Operating point no’s. 8 and 9 show that to a certain extent the thickener is self-adjusting to the changes in the feed solids rate. Over a certain restricted range of feed solids rates, the thickener will operate without any control adjustments to give a certain range of underflow concentrations. As long as these variations in underflow concentrations can be tolerated, no operating changes need to be made.
The above operating examples indicate that it is impossible to keep both interface height and underflow concentration constant at the same time when the feed solids rate is changed. In thickeners where flocculants are added to aid settling, the operation becomes more complex since the polymer dosage can be adjusted to offset other changes that may occur. In these cases, the polymer dosage can be the main control variable to adjust for fluctuations in feed or settling characteristics of the material to keep both interface height and underflow concentration constant.
Conclusions
The model presented allows continuous thickeners to be sized from a single batch settling test. The model is verified by continuous thickening data on several types of slurries.
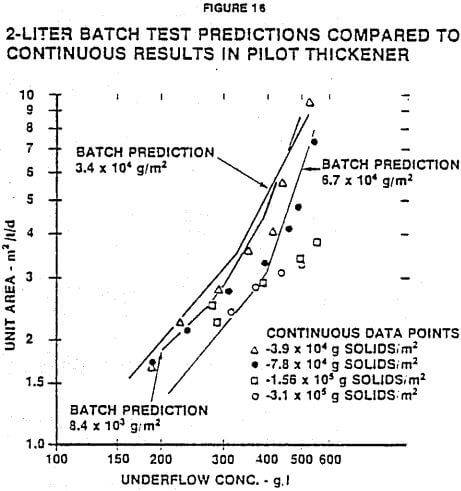
When batch tests are run and analyzed correctly, excellent agreement is achieved between predicted and observed results unless the effect of compression forces becomes too great. When compression forces are significant, the model comes close to predicting the continuous results if the batch tests are made in deep cylinders.
The model shows that there is an intimate relationship between batch and continuous thickening. The underflow concentration in continuous thickening corresponds to the average concentration under the interface in the batch tests, and the limiting concentration in the continuous thickening corresponds to the concentration just under the interface in batch settling. The expression derived for determining the unit area for continuous thickening (Equation (12) is equivalent to that determined for batch tests (Equation (25).
Analytical techniques presented here allow for prediction of thickener operation and control under variations in feed rats, slurry depth and underflow pumping rates. Various control philosophies have different effects on the degree of fluctuation in underflow concentration with normal feed variations. This information is useful in establishing thickener control strategies and for proper thickener operation.