
Table of Contents
In a previous article preliminary experiments were described, indicating the possibilities of a quantitative spectroscopic method for the determination of small amounts of lead in copper, which would be accurate and rapid, and could be carried out in the refining plant by one not skilled in chemical analysis. The present paper deals with the development of the method in the factory, giving the details of apparatus and its standardization, and presenting a comparison of the accuracy of the method with that of the standard electrolytic determination. (For variations and other applications of the method, the reader is referred to the first article.)
Outline of Method
A carefully weighed sample (0.4 gm.) of the copper to be tested is placed in a cavity in a graphite positive electrode. An arc capable of regulation is struck, and maintained under constant conditions between the copper sample and a rotating upper carbon electrode. A spectroscope is so adjusted as to observe the lead line (405.8 µµ), as shown in Fig. 1.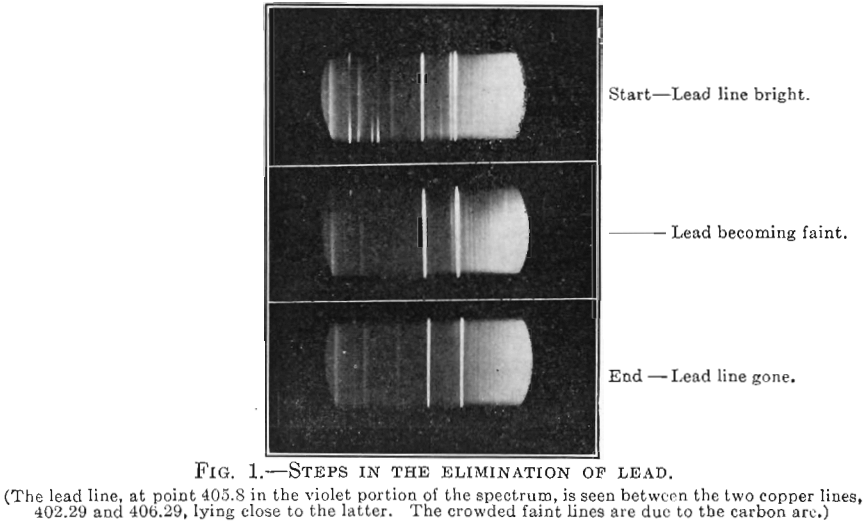
With a stop-watch, the time is determined between the melting of the copper sample and the disappearance of the lead line from the spectrum. This time is proportional to the lead content of the sample, the exact values depending upon the apparatus employed. The apparatus
is calibrated with samples of known lead content and a time-lead curve is established for the apparatus. Where minimum values alone are required, the time of disappearance of lead from a sample of satisfactory copper is taken as a standard, and the refining process is continued until furnace samples show a time equal to or less than the standard.
Apparatus
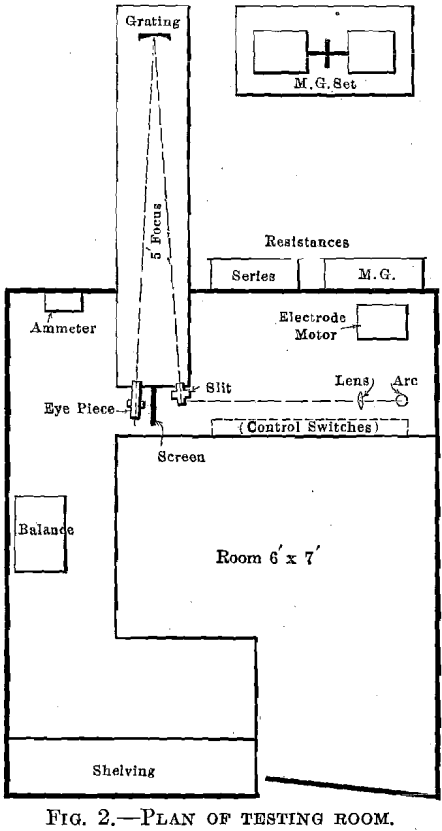
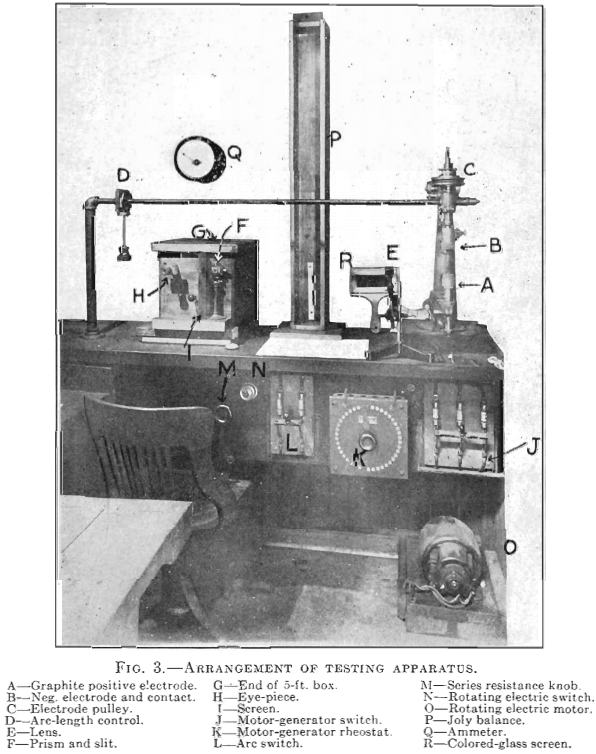
The apparatus and its arrangement as finally installed are shown diagrammatically in Fig. 2 and in the photograph Fig. 3. A full description of the various parts of the apparatus will be found in Appendix 1. On account of conditions due to the war, we were unable to purchase a spectroscope suitable for the work, and were forced to use a grating, which required more space.
Standardization of Apparatus
Our first two attempts to standardize the apparatus were not successful. However, we shall give some of the details regarding them, since they throw some light on the relative accuracies of the spectroscopic and electrolytic methods for small quantities of lead. The three methods of calibration were: (1) checking routine analyses; (2) comparative analyses of large samples; (3) comparative analyses of synthetic samples.
Checking Routine Analysis
For a period of several weeks, the spectroscope was used in comparison with regular routine analyses by the electrolytic method. (Description of method will be found in Appendix 2). The results seemed to check the work of some of the chemists quite accurately, but at best the uncertainty was too great to establish a calibration.
Analysis of Large Samples
Five large samples of copper shot were made by selection from regular furnace runs on the basis of the routine test. These were submitted to three chemists for chemical determination of lead, and were examined in the spectroscope. We were still unable to check the chemical method, and consequently returned the samples for repeat analysis, including repeat samples on regular routine tests. The values obtained are given in Table 1. The analyses on the special samples were made by three chemists, two of them using a 10-gm. sample and one a 25-gm. sample, working independently.
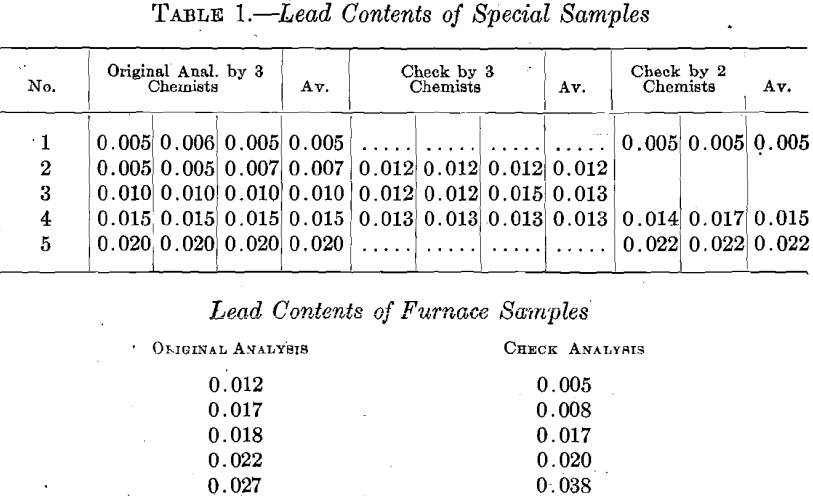
As might be expected, the routine analyses, which are often rushed, do not show the accuracy of the special analyses. From the results given, and from an extended investigation of the electrolytic method in our analytical laboratory by others, it appears that the possible error in the electrolytic method is of the order of 0.003 per cent, for careful work, and 0.005 per cent, for rapid routine tests.
The readings, in seconds, by the spectroscopic method for the special samples are given in Table 2. These are averages of ten readings by two observers, A and B. For comparison, the percentage of lead is cal-
culated from the time and the time-lead curve, after this had been established with synthetic samples. The errors expressed are the average deviation from the mean, and would probably represent the order of the possible error.
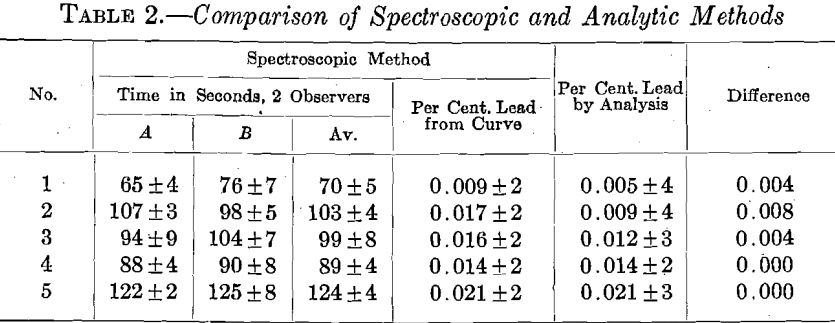
It is to be noted that we have been dealing with the accidental errors of the two methods, and that we have not attempted to express the probable error. The figures indicated the existence of systematic errors, since the determinations by the two methods differ by more than the possible error of each. These differences are the greatest with samples of small lead content, the electrolytic method being uniformly lower than the spectroscopic. It is known that the electrolytic precipitation of the oxidized lead is not complete under certain conditions, and the systematic error would tend to give low results. If we select the highest individual chemical analysis we have a much better agreement between the two methods. Since the spectroscopic method is standardized under the conditions of operation, any systematic errors in the method will be included in the standardization, and we are therefore concerned only with the accidental errors.
Synthetic Samples
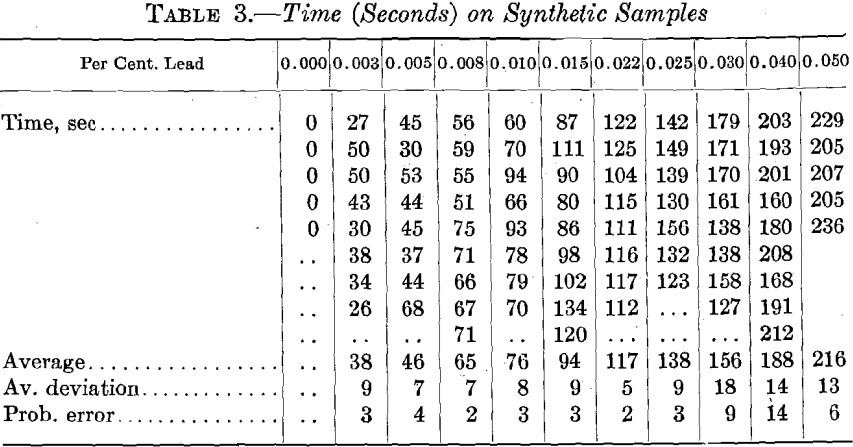
Synthetic samples were made in the laboratory by adding a carefully weighed amount of pure lead to the required amount of molten pure copper (Cu 99.963 per cent.) in new fire-clay crucibles under charcoal cover, mixing thoroughly and pouring into fine shot.
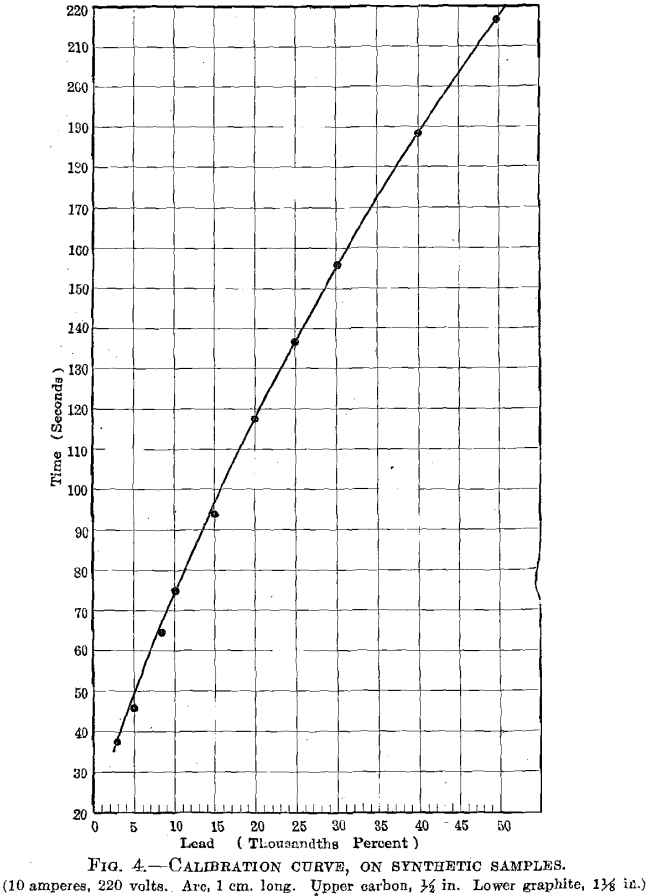
The spectroscopic readings were made by the furnace foreman who will use the method in control of the refining furnace. It should be noted that this observer is not experienced in the use of the spectroscope and his training has been in factory production rather than in investigative work. The readings were taken at random, so the observer could have no indication of the lead content of the sample under test. The individual readings are given in Table 3, and from these the averages and errors are calculated. The time-lead curve arising from these readings is shown in Fig. 4. (In regular factory operation the known samples will be run at regular intervals so that any incorrect adjustments will be detected.) This is clearly the best method for standardizing the apparatus.
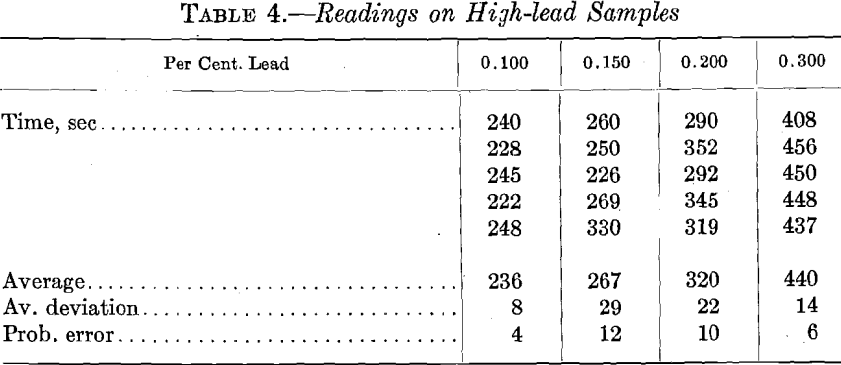
High-lead Samples.—For the sake of completeness, a few tests were run on samples with lead content much above that usually determined in copper refining; results are given in Table 4. On account of the smaller number of observations, the probable error is greater than in the samples of small lead content.
Doubt may naturally arise as to possible loss of lead in making the syhthetic samples. John Johnston gives the vapor pressure of lead at 1176° C., according to Greenwood’s experiments, as 0.022 atmosphere, or 16.7 mm. Hg. Using the equation by Johnston for calculating the vapor pressure, we obtain 15.2 mm. for the same temperature. It is certain that our samples were not heated so high as this and as they were made rapidly it is obvious that the loss of lead must have been slight. The vapor pressure of lead dissolved in molten copper would be less than that of lead alone, at the same temperatures. The close agreement of the analyses by the two methods on special samples No. 4 and 5 would indicate no loss of lead in preparing the samples for standardization.
Variations in Conditions
The variables which might affect the accuracy of the method are:
- Size of sample.
- Uniformity of sample.
- Current variations.
- Variations in optical apparatus.
- Arc length.
- Drafts around electrode.
- Speed of rotation of electrode.
- Personal factor.
1-2. Size and Uniformity of Sample.—It is obvious that the size of the sample is so small that the method cannot be used with material which is not homogeneous. Enlarging the sample to 1 gm. would hardly make the method applicable to this kind of material. If the furnace sample is properly taken, and is stirred before pouring into shot, we find no evidence of segregation of lead with the low-lead samples which we have been using.
Error is possible in weighing out the sample. Where analytic balances of the usual type are used it is an easy matter to weigh rapidly to 0.001 gm. From the experiments with samples of different weights discussed in our previous paper, it is seen that the time of disappearance of a given unit of lead is not proportional to the weight of the sample. These experiments indicate that an error in weighing of 0.01 gm. would be necessary before the resulting determination of lead would be changed 0.001 per cent.
However, to be certain in this matter, samples having different weights were run, using one sample of low-lead content (0.005 per cent.), and one in which it is quite high (0.050 per cent.). Results are given in Table 5.
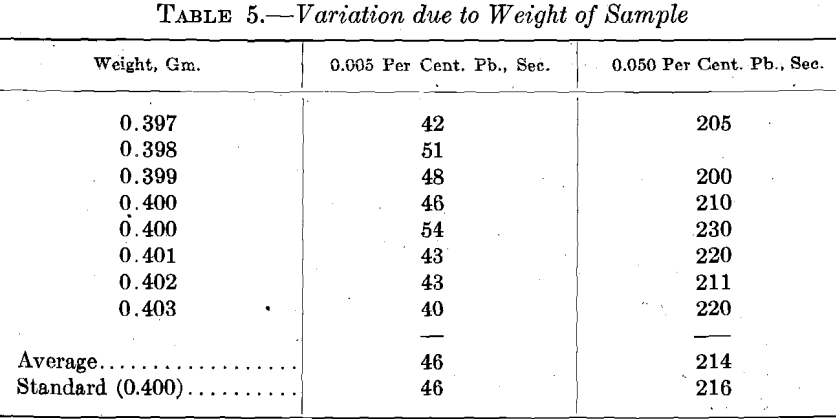
It is obvious that the small errors in weighing do not affect the lead determination. A systematic error in weighing would affect the standard samples with which the apparatus is checked from time to time, and would soon be detected.
Using the Joly balance, the 0.4-gm. point of which was 45.0 on the scale, the following times were obtained with a sample containing 0.010 per cent, lead, the standard time of which was 75 sec.
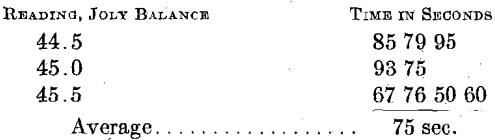
The Joly balance can be read within 0.05; hence the error in weighing with the balance will not influence the results.
3. Current Variations.—The arc is somewhat unstable, but if sufficient series resistance is included on a high-voltage line, the variations in the arc, when set, are not sufficient to affect the determination. The current should be large enough to melt the sample readily and to keep the globule of copper at a uniform temperature. With low amperages, part of the bead is cold and erratic results are obtained. High amperage increases sputtering but gives better light. While our apparatus is standardized for 10 amp. at 220 volts, good results were obtained with 11 amp. With our apparatus the amperage fluctuates regularly from 9.75 to 10.25, and gives a good average of 10 amp., as shown in Table 6.
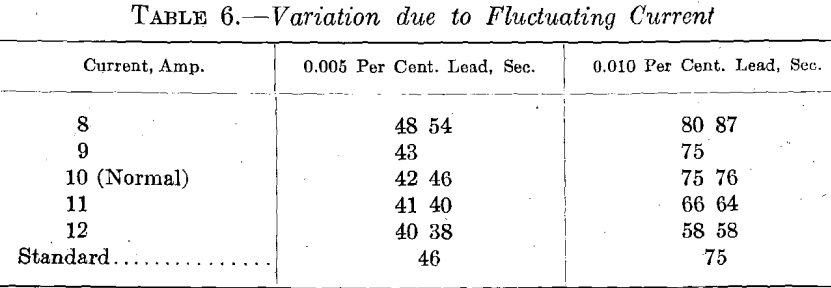
It would appear that the current variation gives rise to an error of the first magnitude. However, with proper arrangement, the variation can be reduced to a range that will give accurate results.
4. Variation in Optical Apparatus.—There can be no disarrangement of the optical apparatus which can affect its accuracy unless the operator attempts to observe the disappearance of small amounts of lead with an apparatus so poorly adjusted that the end is not distinct. One becomes accustomed to the proper setting and immediately notices any change in adjustment.
5. Arc Length.—While it is an easy matter to maintain a constant arc length, it is to be remembered that this will not affect the current.
6. Drafts.—The arc should not be subjected to drafts of air, since these make the arc unsteady and cool the bead. While we have never attempted to shield the arc, it is quite possible that a properly devised shield would promote even greater accuracy.
7. Speed of Electrode.—The speed of rotation of the electrode should be such as to center the arc and keep it from wandering. Too great a speed tends to drafts and sputtering of the arc. In our apparatus the rate is 1000 revolutions per minute.
8. Personal Factor.—There appears to be a personal factor in using the method, but it is usually small and constant. One observer may read a certain number of seconds longer than another on the same sample; this is probably due to difference in the sensitivity of the eye. With experienced observers, and even with those who are new to the work, it has been possible for two observers to check each other months apart. Where there is more than one operator it would be safest for each to establish his own calibration curve, using the same standard samples.
Advantages and Limitations
It is obvious that the method can be used only on copper in which the lead is uniformly distributed throughout the samples. If care is taken in preparing the shot-from the ladle, we have found no evidence of segregation. The occasional readings which vary widely from the average are, in all probability, due to arc wandering or unsteadiness, affecting the temperature of the molten copper. It is our experience that these exceptional readings are almost always high, and we have usually been able to associate such readings with irregularities in the arc. There is a tendency for small particles of the sample to be thrown out from the molten bead; this can be lessened by rotating the upper electrode more slowly and by cutting down the arc current. When reduced to a minimum it does not interfere with the test, but is accounted for in the calibration of the apparatus.
The advantages of the method are facility and accuracy. The analyses can be made in the refining plant by the foreman or by some one who has at least a High School education. The process of refining can be followed rapidly, without holding the furnace for a chemical analysis. Even the last analysis, just before pouring, which requires the greatest accuracy, can be made in a few minutes, and the accuracy of the method at this point is greater than that of the chemical method.
We are indebted to Messrs. Hineline and Nuzum for the spectroscopic tests on the special and synthetic samples, and to Messrs. Gwaltney and Demler for the chemical analyses.
Appendices
List of Materials
Arc Apparatus:
Motor-generator set.
Westinghouse 3-hp. ind. motor, 220-volt, 3-phase, style 170,906.
Westinghouse 3-hp. d. c. generator, 230-volt, style 212,677.
Rheostat on motor-generator set, Westinghouse field rheostat, 30 ohms.
Rheostat in series with arc, Westinghouse field rheostat, 200 ohms. 250-volt style.
¼-hp. motor, or smaller, for rotating electrode.
3-pole, single-throw, switch for motor-generator set.
2-pole, single-throw, switch for arc and motor.
1 snap switch for motor on rotating electrode.
Ammeter, d.-c., 0 to 15 amp., switchboard type.
Arc adjusting outfit.
Graphite cups and upper carbon electrodes.
Remodeled drill press for rotating upper electrode.
Optical Apparatus:
Spectroscope or grating, with lens to focus arc image on slit.
Accessories:
Scale, or Joly balance.
Screen for observing arc (colored glass).
Stop-watch.
Standard weight.
Method of Chemical Analysis for Lead in Copper
A 10-gm. sample is dissolved in 45 c.c. nitric acid (s.g. 1.40). The solution is boiled until evolution of nitric oxide fumes ceases, and it is then neutralized with ammonia. The precipitate is dissolved in nitric acid and 5 c.c. cone, acid is added in excess. The solution is then diluted to 125 c.c. and electrolyzed 30 min. with a current of 1 amp. at 25 volts. The electrode is a platinum gauze cylinder 2 in. high, 7/8 in. diameter, with 10-mil wire, 50 to the inch, giving an anodic area of approximately 15 sq. in. or 100 sq. cm. The electrode is washed in alcohol and dried at 180° C.
Test of Joly Balance
Instead of the regular analytic balance, it has been proposed to use a Joly balance, which may be calibrated from time to time with a standard weight (0.4 gm.) equal to the copper sample to be used. For testing our Joly balance, the weights were 0.4000 + 5 gm., and the readings (scale in centimeters) were:
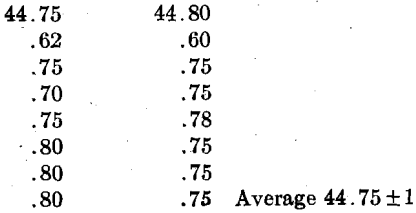
Repeated readings with the standard weight on the Joly balance gave the same values (44.75 ± 1). The Joly balance can be made equal if not superior in accuracy to the analytical balance over a given range, and is more rapid. Probably the accurate types of torsion balance, such as made by the Roller Smith Co., Bethlehem, Pa., and used for weighing lamp filaments, might be used in this work, but they are rather expensive.
Related: Best Drill Press for Metal in 2022