Table of Contents
The Bureau of Mines surveyed waste disposal sites at 18 metal and non-metal mines and conducted laboratory and full-scale field tests to determine the effects of tailings deposition techniques on physical properties of tailings pond beaches. Survey data included measurements of beach slopes, descriptions of deposition techniques, and measurements of beach physical properties taken at various distances from the point of discharge. Laboratory tests involved depositing two types of tailings, each with different grain-size distributions, into a settling trough and determining the resultant physical properties of settled materials along the length of the beach. Side confinement and the closeness of the water pool to the point of deposition caused the laboratory results to be inconclusive. Full-scale field deposition tests conducted at the tailings pond of a cooperating mine showed that there were similarities in relationships between exit velocities of tailings slurry and physical properties of the settled tailings on the beach.
Mill tailings usually are considered a useless byproduct of mining and milling processes. However, mining and milling methods have changed as more low-grade ores are now being mined. As a result, the quantity and quality of mill tailings have also changed. Tailings are ground more finely as ore dressing procedures pick up microscopic particles of minerals, and the ratio of recoverable minerals to waste tailings is decreasing because more lower grade ore is being processed.
In an effort to promote safety-oriented technologies for mine waste disposal, the Bureau of Mines has conducted an investigation to determine the effects of deposition techniques on the structural stability of tailings embankments. If the physical characteristics of impounded tailings could be altered without extraordinary costs, a more stable and/or useful form of mine waste may be produced. For example, deposited tailings could be used as a source of backfill material. Presently, particle separators, such as cyclones, are used to gather the sand fraction of tailings for use as hydraulically transported, underground backfill. This practice, however, leaves the fine fraction to be deposited on the surface. If the total tailings could be used as backfill, the need for a large surface disposal area would be minimized.
By using mechanical dewaterers or by naturally dewatering the tailings via evaporation and percolation, mill tailings could become a useful source of backfill aggregate. This would be especially true if tailings settling could be controlled at deposition to produce an optimally segregated material that could be reclaimed with a minimum of effort.
It might also be possible to determine a relationship between the exit velocity of the tailings slurry and the factor of safety of tailings embankments. This correlation would help personnel to quantify any changes in the embankment factor of safety due to proposed changes in tailings deposition rates. The information produced in this study would be useful also in developing better deposited tailings for use as embankment material.
This investigation consisted of three phases. Phase I was a survey of the tailings impoundments of 18 metal and nonmetal mines. The results were evaluated for correlations between deposition and embankment characteristics. Phase II included laboratory model tests where tailings slurry was deposited into a long, narrow settling trough and the physical properties of the resultant beach were measured. Phase III consisted of full-scale field tests at a cooperating mine site where an auxiliary pipeline was installed to control tailings deposition flow rates. The beach formed by each controlled deposition was then analyzed, and its physical properties were measured. The measured physical properties, in conjunction with the relationship between each exit velocity of the discharged tailings slurry and stability of the resulting beach slope, were used to perform an iterative analysis of the factors of safety for an idealized embankment.
Mine Survey Procedure
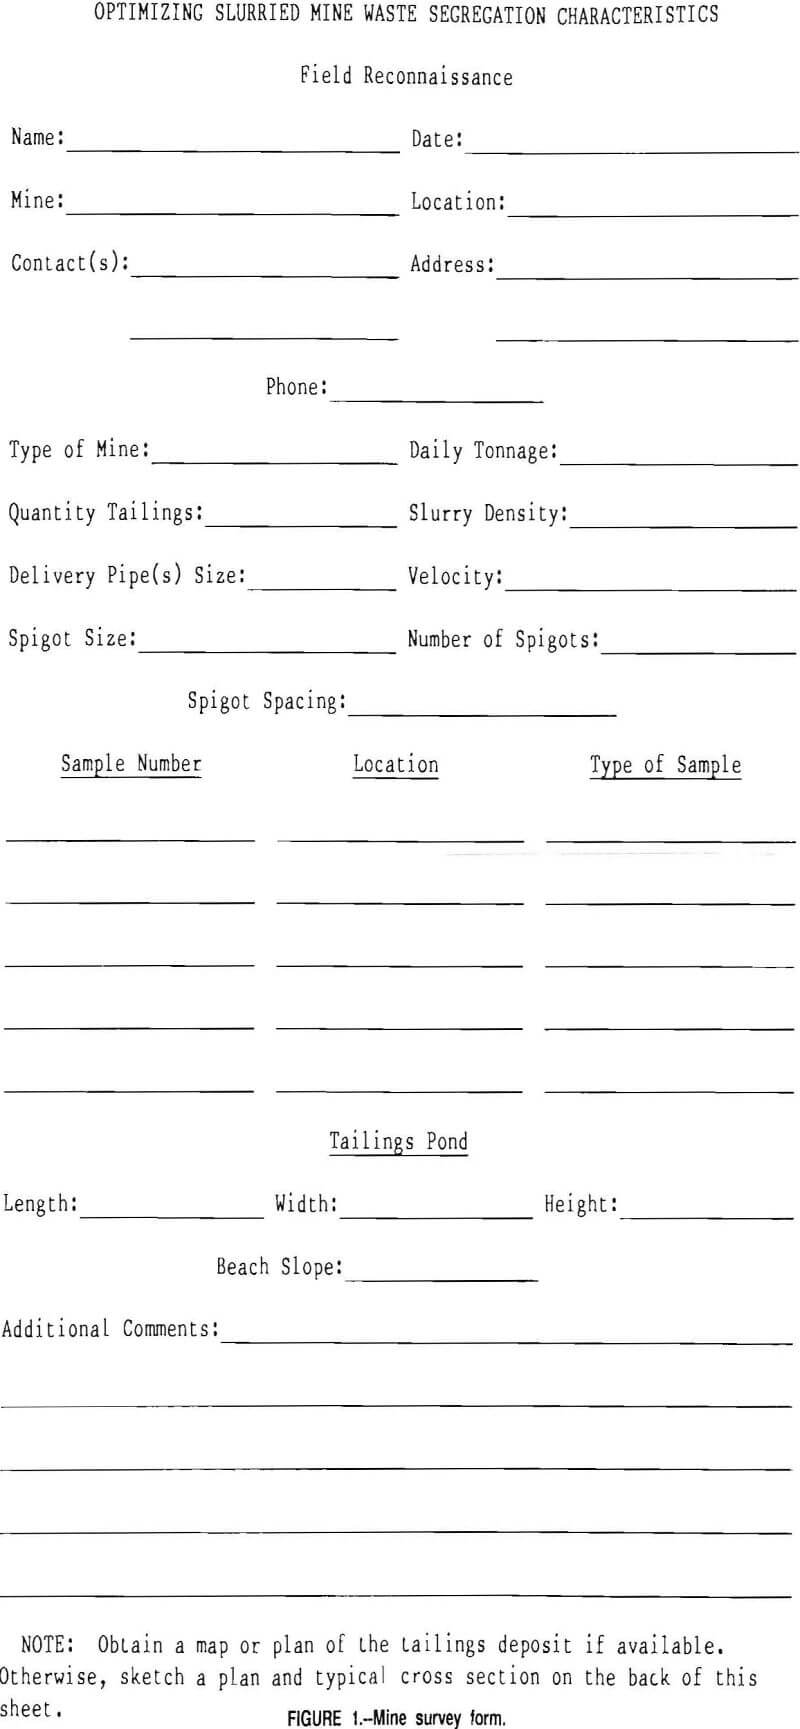
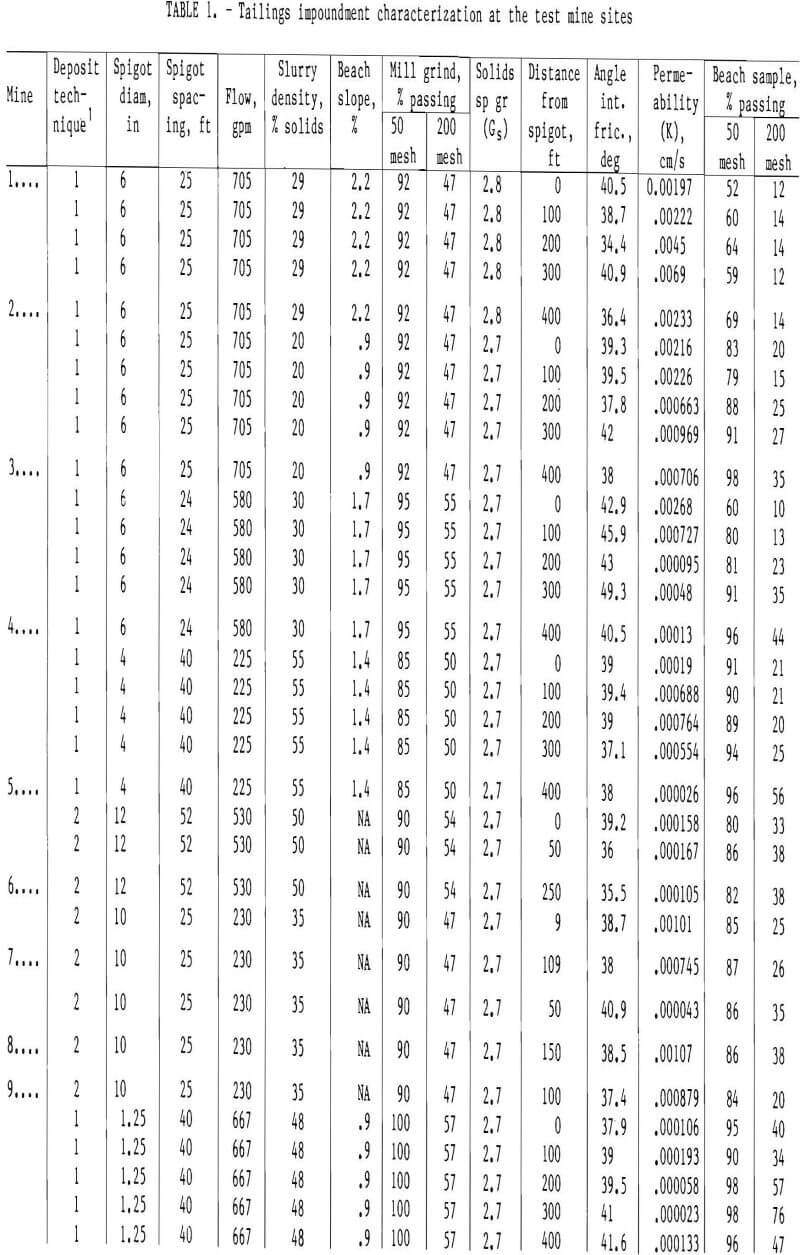
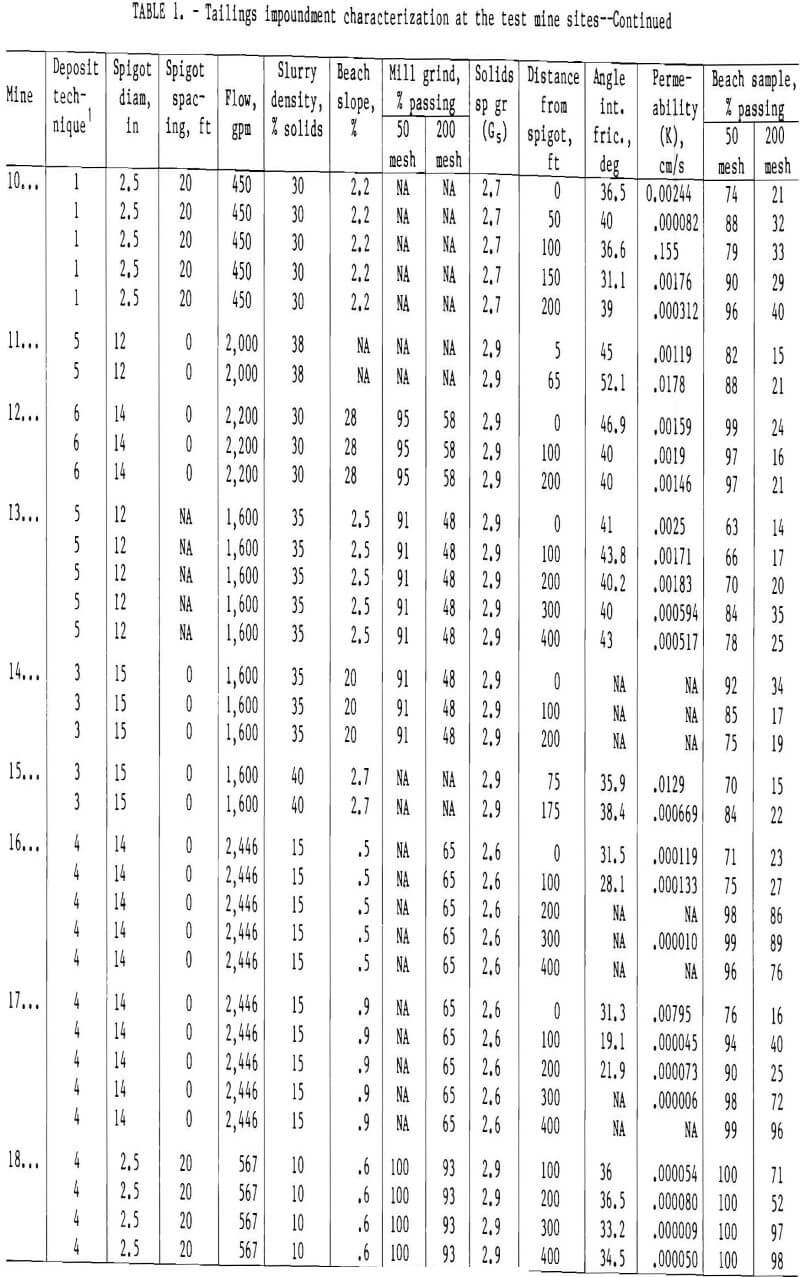
Surveys of waste disposal sites were conducted at 18 metal and nonmetal mines. A few of the deposition techniques used at the mines included upstream spigoting (type 1), centerline cycloning (type 2), and borrow dike with spigoting (type 3). Information was collected on each mine’s operating procedure (fig. 1). Elevation surveys were conducted to determine beach slope, and distances were measured between sample locations where surface Shelby tube samples were taken perpendicular to the embankment crest. This measurement and sampling pattern produced a cross section of physical properties with respect to distance from the point of discharge. The samples were tested at the Bureau’s Spokane (WA) Research Center for internal shear strength, permeability, and grain-size distribution. Table 1 summarizes the tailings impoundment characteristics at the 18 mine sites.
Test Results
The results of the field surveys were statistically analyzed to determine if there were any simple mathematical relationships among the predictive variables (spigot diameter, velocity, slurry density, and/or permeability), which could be used to predict the embankment’s grain-size gradation away from the point of discharge. A stepwise regression analysis was used to pick the most highly correlated variables in descending order of correlation, thereby builing a linear mathematical model of the selected input variables. A set of products and squared terms were also candidates for the model. An important constraint was that the model be linear and additive. Therefore, many other candidate functions were not investigated, for example, exponential curves.
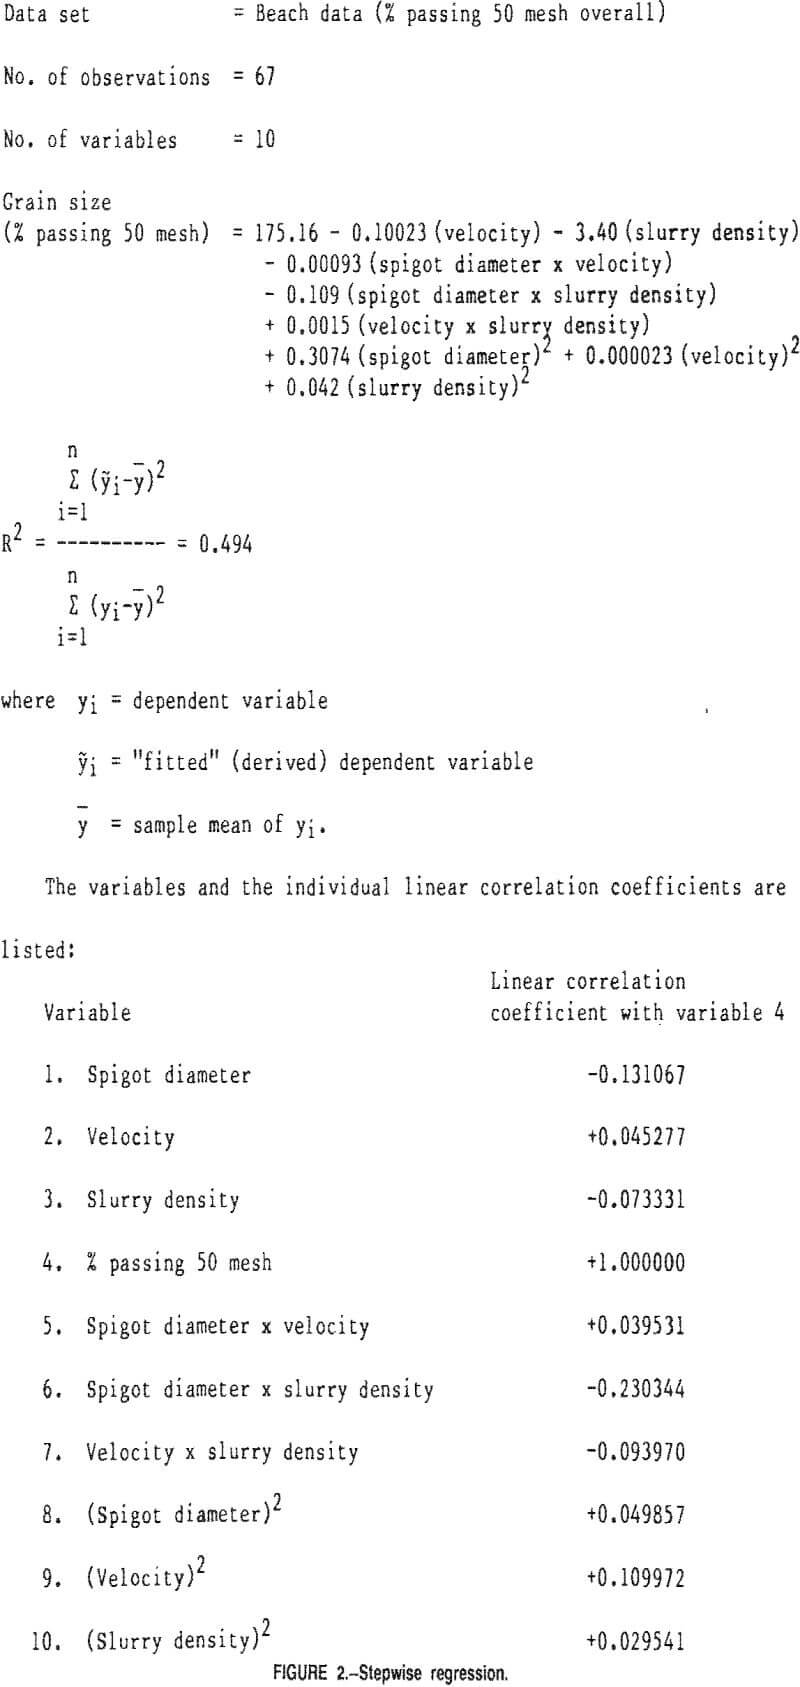
Figure 2 shows a tabulation of one stepwise regression analysis. In this case, variables 1 to 3, the multiples of variables 1 to 3, and the squares of variables 1 to 3 were used to predict the grain-size distribution of the beach (i.e., the percentage of particles finer than 50 mesh).
As figure 2 indicates, there is a poor linear correlation between any one of the predictive variables and the grain-size values. This usually indicates that a highly correlated result will not be obtained even if many of the variables are included in the final mathematical equation. This stepwise regression run did provide a multiple correlation value R² = 0.494, where R² is a measure of how well the multidimensional plane described by the equation fits the data. Although this value of R² is statistically significant, it certainly is not outstanding. (R² = 1.0 is a perfect correlation value.)
Four groups of statistical analyses were performed. Table 2 provides descriptions of the analyses and summarizes the results. The results indicate that the data from the 18 mine sites are far too heterogeneous to be treated as a single data set. Attention should be focused on the fourth column in table 2, the R² values. The only good regression run was for code C (table 2), using only data obtained from type 1 depositional methods where embankments were built by upstream spigoting.
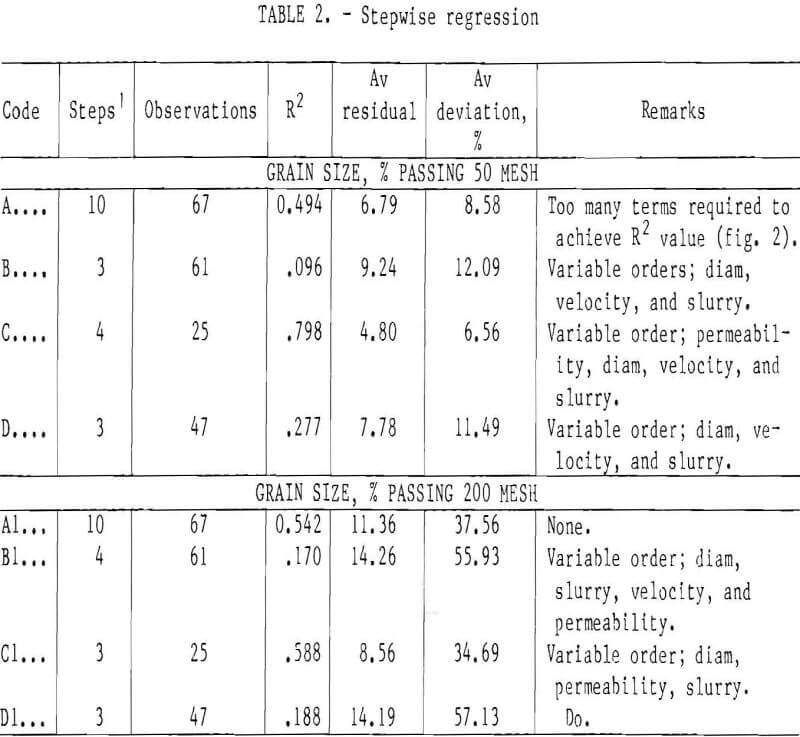
Note.—R² is a measure of how well the resulting multidimensional plane fits the data.
Laboratory Test Procedure
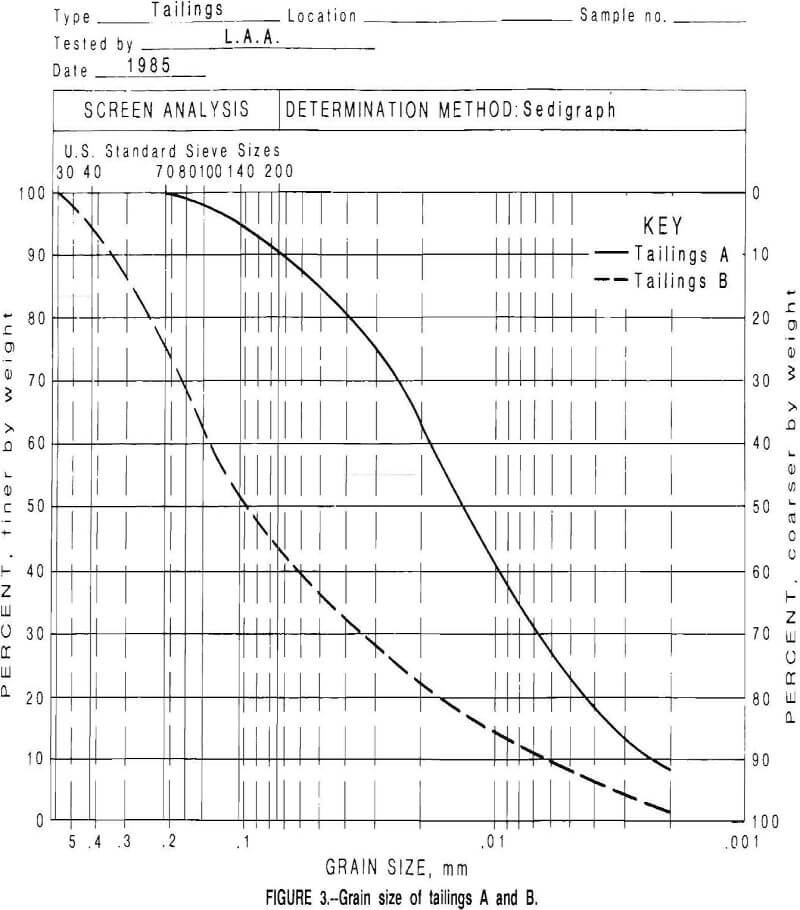
After bulk tailings samples were obtained from two mine sites, laboratory testing commenced. The tailings were diluted with water to a specific slurry density, mixed in a large, 1,675-gal tank, and then pumped at a specified flow rate for discharge into a settling trough. Tailings A consisted of fine mill waste from a copper-silver mine.
Tailings B was from a silver-lead-zinc mine and contained coarser particles. The grain-size distributions are plotted in figure 3.
It was hypothesized that depositional variables such as flow rate, slurry density, and beach physical properties, as well as relationships among variables, could be ranked according to their relative importance before full-scale field tests were undertaken.
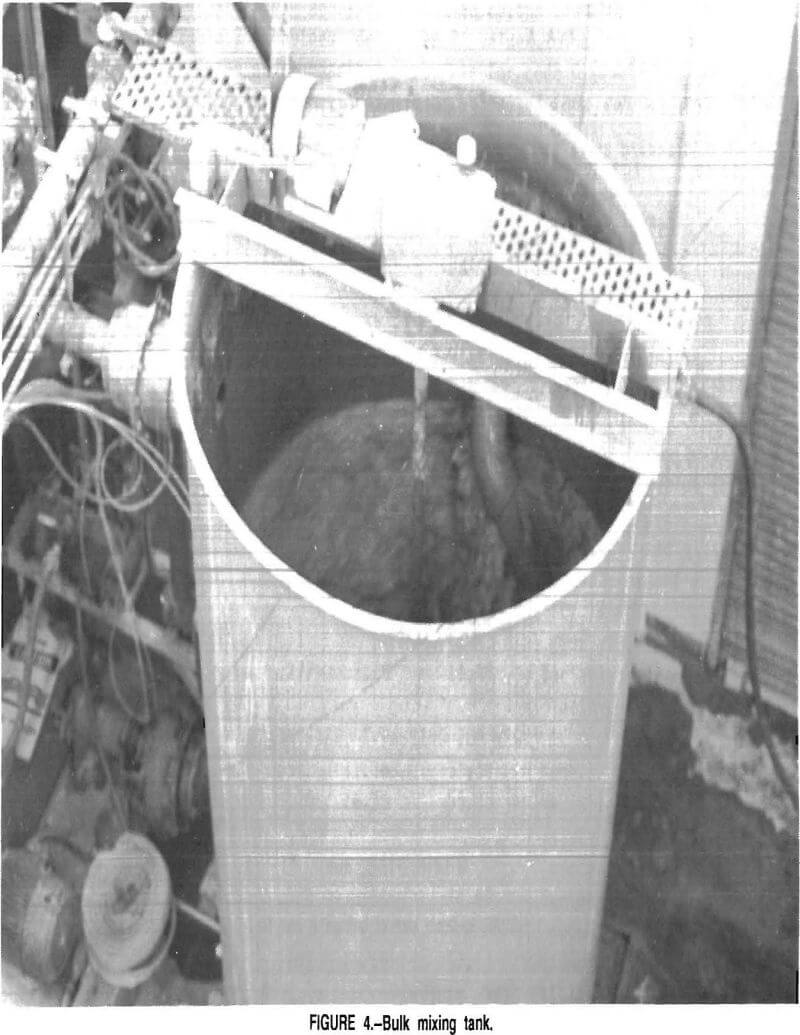
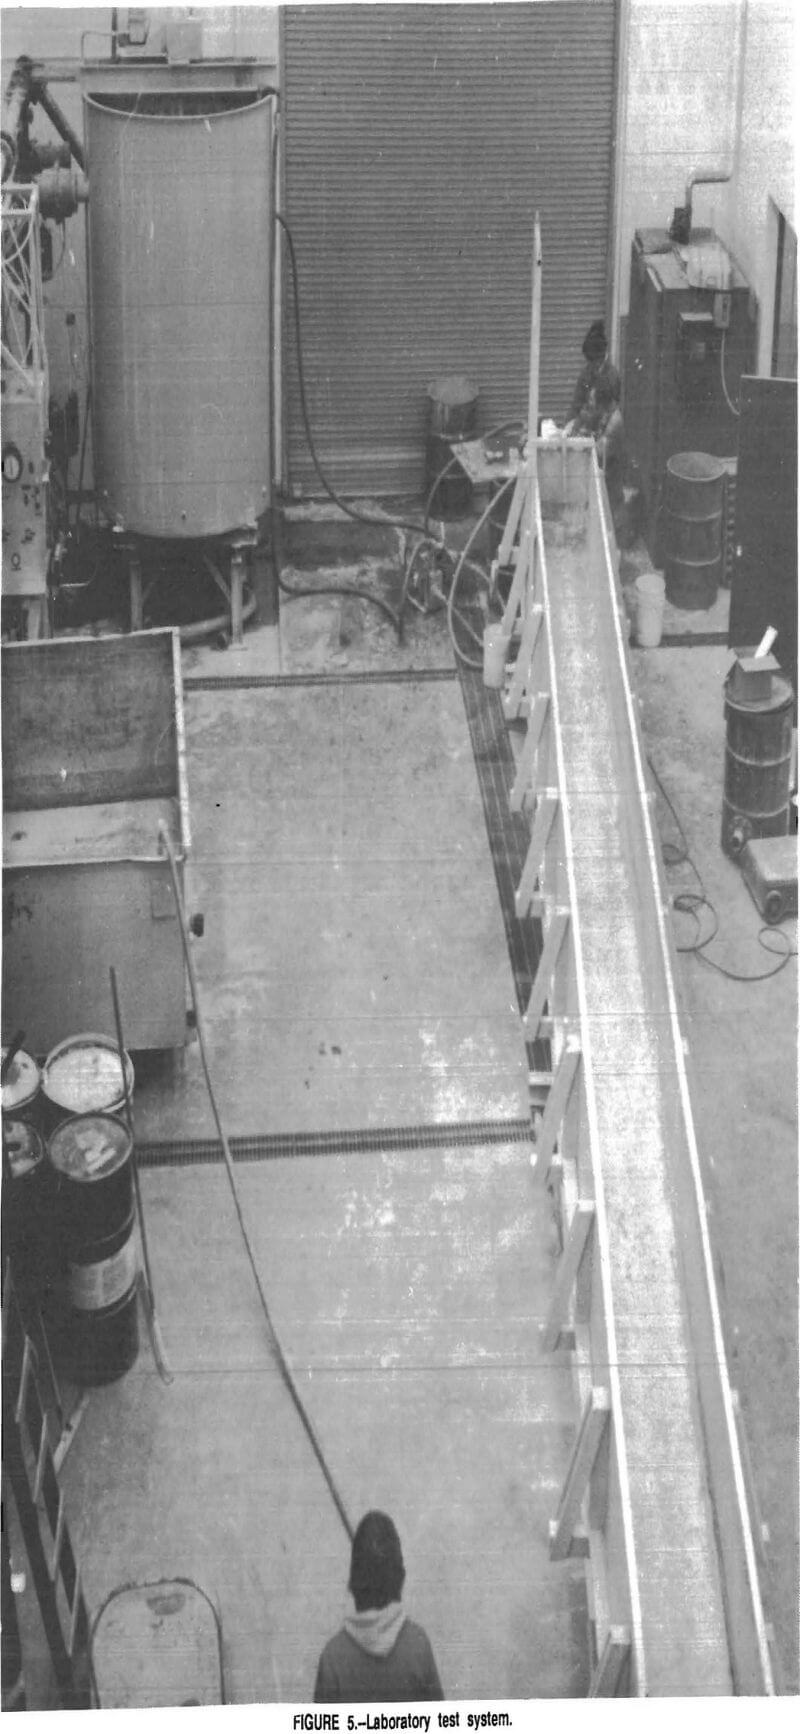
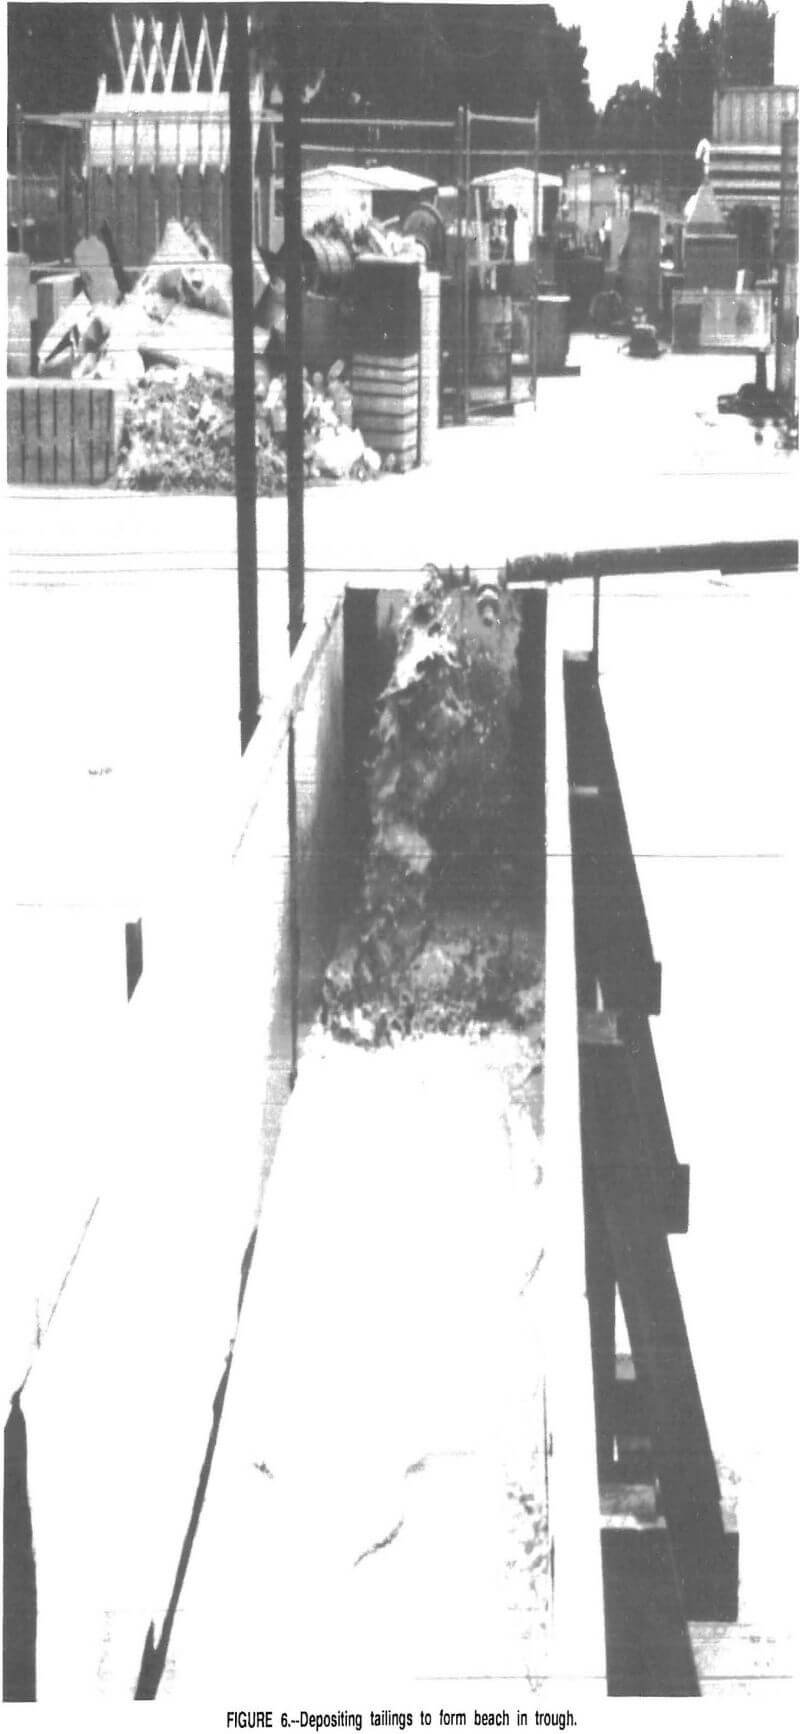
For each tailings sample, the slurry density was altered by changing the percentage of solids. The slurry was then pumped at controlled flow rates through a 1¼-in pipe opening. The tailings were deposited in a 2-ft~wide by 40-ft- long wooden trough. A burlap bulkhead at the far end permitted the water to drain. After the solids were sufficiently dewatered, Shelby tube samples were taken at designated distances along the length of the deposited tailings. The samples were then analyzed for permeability, internal shear strength, and grain size. Figures 4 through 6 show the bulk mixing tank, slurry loop system, and deposition of the tailings to form the beach.
Test Results
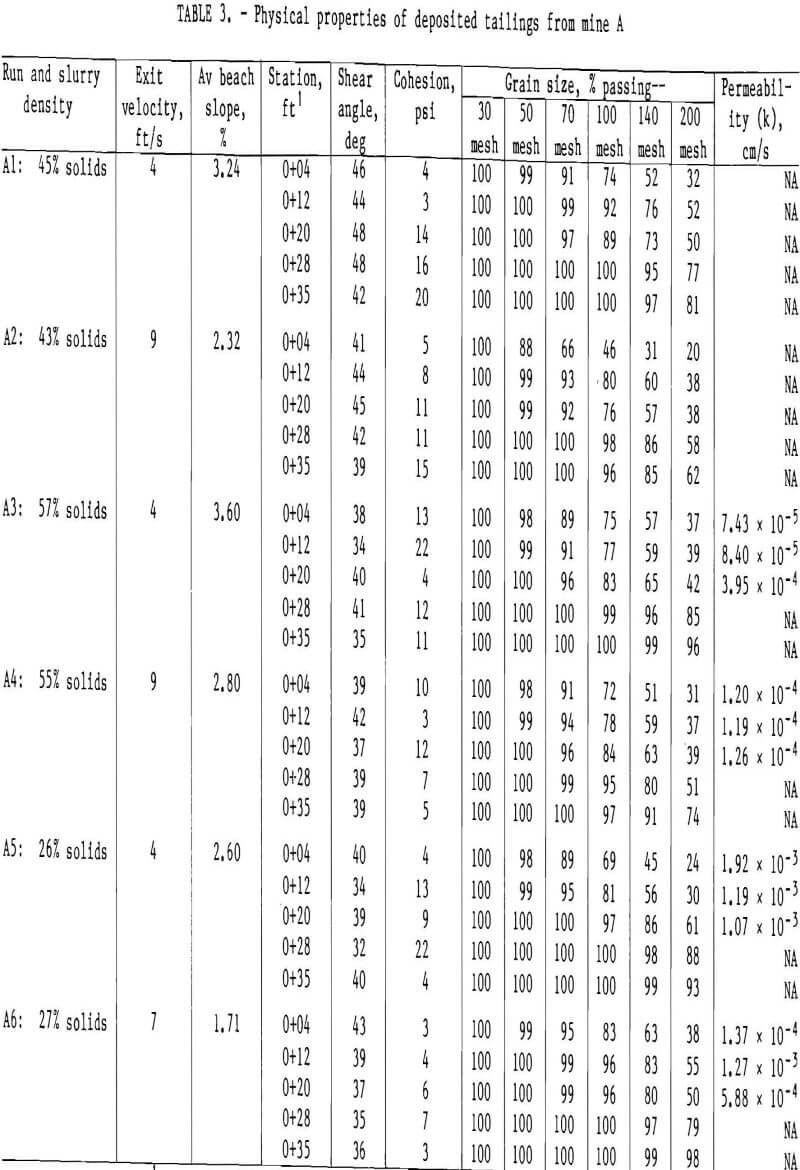
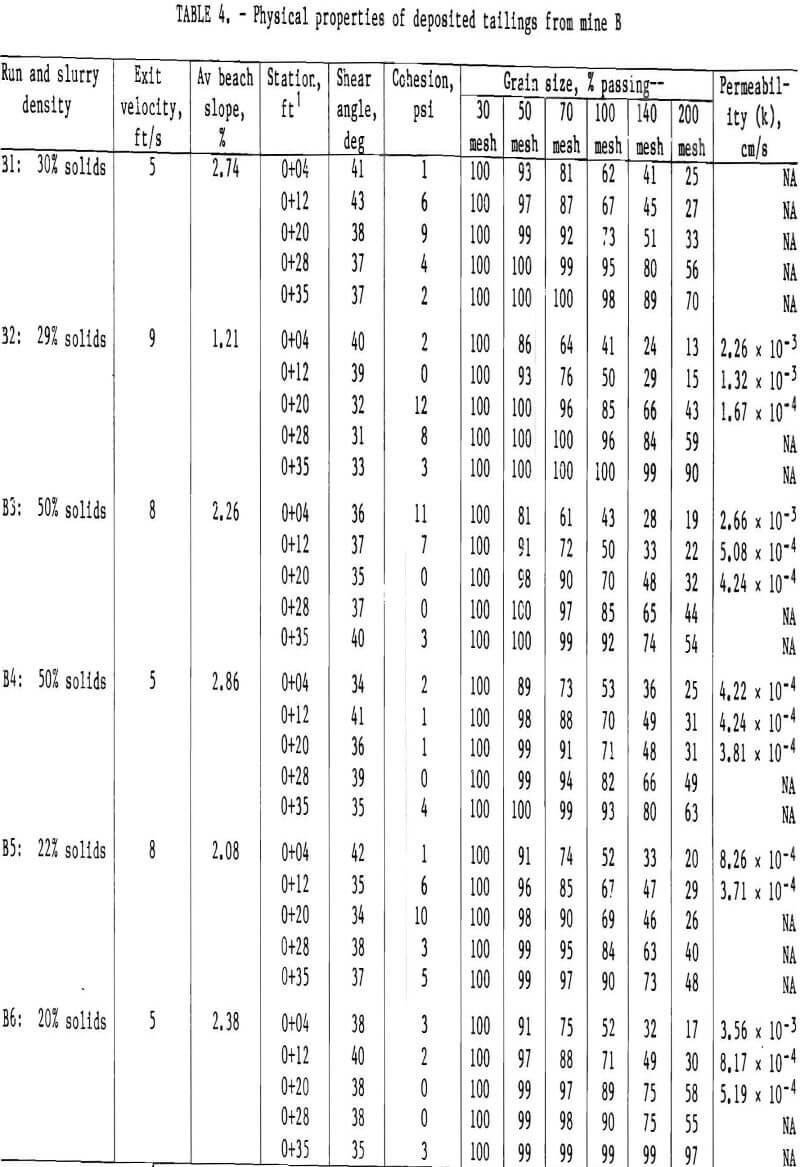
Tables 3 and 4 summarize the physical properties of the deposited tailings from mines A and B. The data in these tables indicate that the following relationships among the variables are valid:
- For both mine tailings type g, the steepest beaches, reflecting the quickest settlement of the coarse particles, resulted from low flow rates (3-5 ft/s) in combination with high slurry densities (50%-57% solids).
- The next steepest beaches resulted from low flow rates (3-5 ft/s) in combination with medium slurry densities (30%- 45% solids).
- The third steepest beaches were produced either by high flow rates (8-9 ft/s) and high densities (50%-55% solids) or by low flow rates (3-5 ft/s) and low densities (22%-26% solids).
- The flattest beaches (least amount of particle segregation) were produced by high flow rates (8-9 ft/s) and medium to low slurry densities (22%-43% solids).
- When the slurry density of the mine A tailings sample was increased by 28% (from 43% to 55% solids), the beach slope increased 21% (from 2.32% to 2.80%) under high flow rates.
- Increasing the slurry density of the mine B tailings sample by 127% (from 22% to 50% solids) increased the beach slope by 9% (from 2.08% to 2.26%) under high flow rates. The relatively small change in beach slope after the change in slurry density in comparison with that of the mine. A sample can be attributed to the higher specific gravity of the mine B tailings sample (2.84), which is higher than the specific gravity of mine A (2.68).
Although the two completed tests verified generalized relationships, no quantitative correlations could be seen. Apparently, the confined dimensions of the trough influenced the depositional trials. Side eddies and the closeness of the pond water to the point of discharge obscured any attempt to correlate tailings deposition conditions to resultant beach characteristics. Therefore, it was necessary to conduct full-scale field tests without the benefit of quantitative laboratory results.
Full-Scale Field Testing Procedure
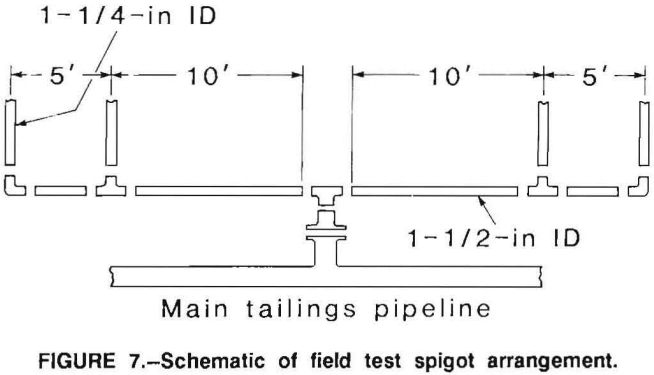
A memorandum of agreement was formalized with the copper-silver mine from which the mine A tailings sample was obtained. The mine provided access to its tailings, a site at its pond on which to build an auxiliary tailings discharge spigot (fig. 7), and the use of its labor and equipment to set up and tend the test site. Once the test pipeline was installed, tailings were deposited at regulated exit flow velocities of 7, 13, and 26 ft/s, and at 13 ft/s with a spray plate attachment. The mine’s standard deposits, made at 92 ft/s, were also sampled. All regulated flow deposits were made through a 1¼-in orifice so that exit velocities could be more readily compared with those of previous laboratory tests.
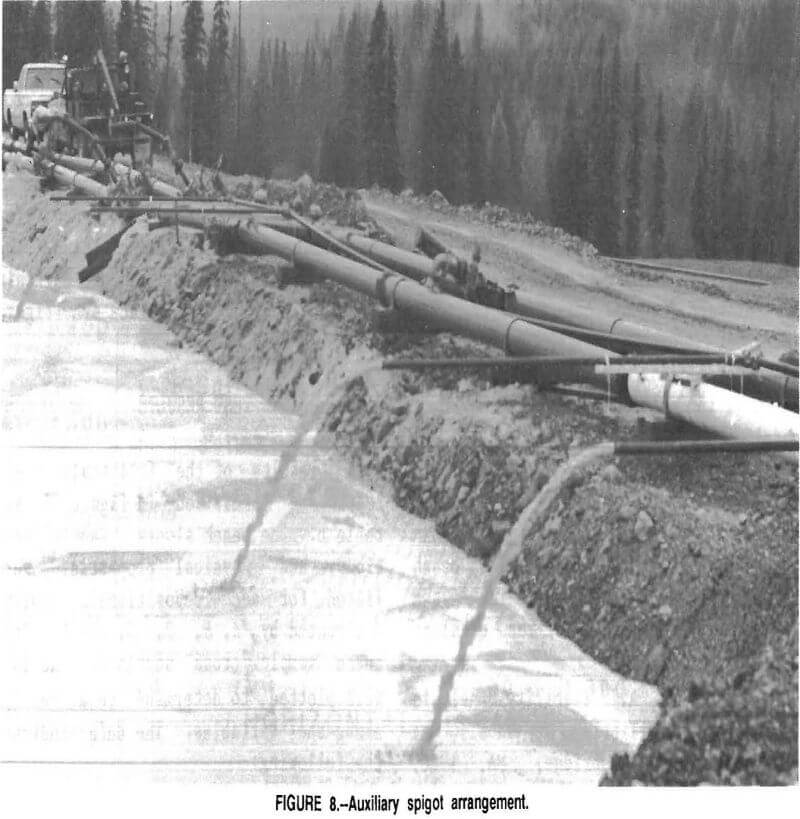
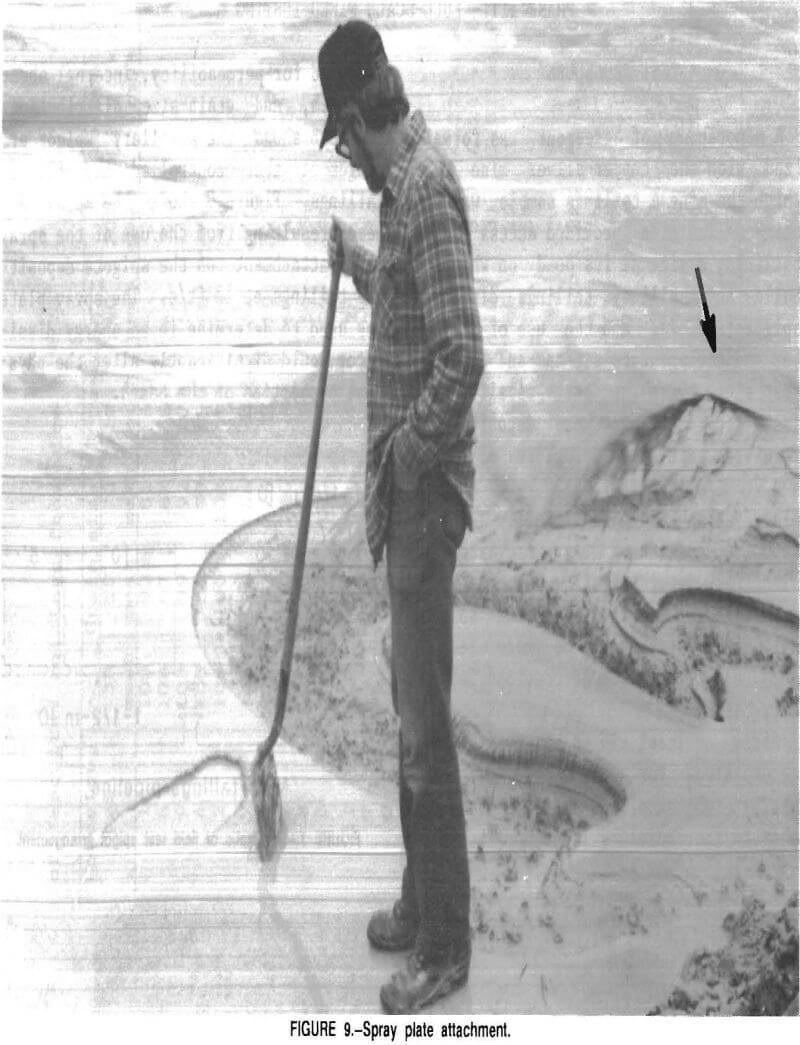
After at least 18 in of tailings had accumulated for each flow velocity, Shelby tube samples were retrieved and sent to the Bureau’s laboratories to be analyzed for permeability, internal shear strength, and grain-size distribution. Figure 8 shows the auxiliary spigot arrangement that controlled the flow of tailings. Figure 9 shows the spray and beach resulting from the use of the spray plate attachment on the spigots depositing tailings at 13 ft/s. The spray plate was used to determine if an energy dissipator would significantly alter the physical properties of the beach.
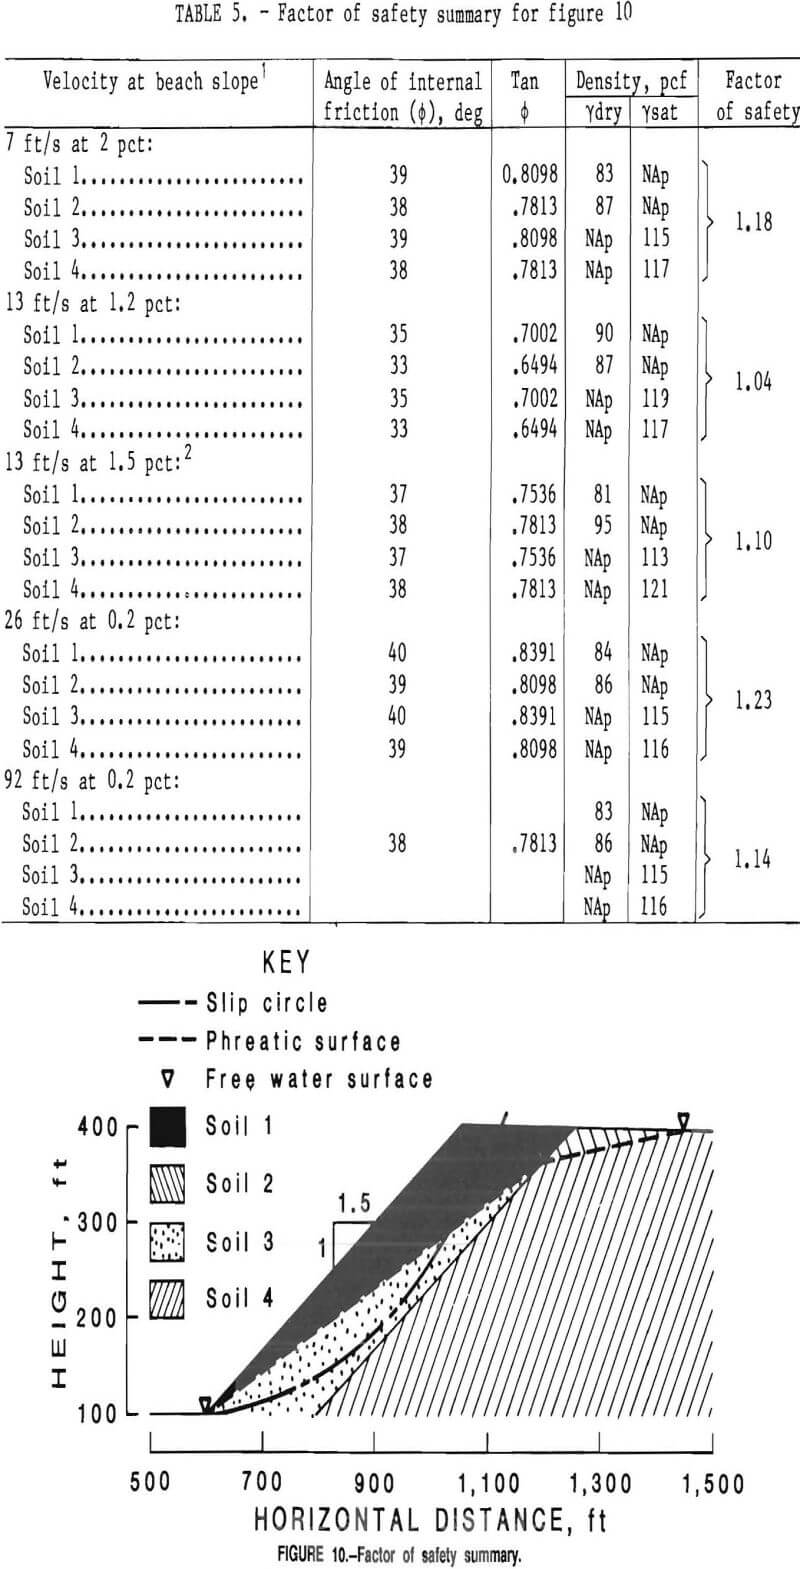
After the data were compiled, an idealized embankment was modeled using the physical properties of the beaches generated at each depositional velocity. The factor of safety analysis used Bishop’s method of slices to determine circular failures in an embankment. The computer model simulated a 1.5:1 face slope, a 300-ft height, an impermeable foundation, constant phreatic and soils interface locations, and a pond elevation 400 horizontal ft from the crest. The beach slopes and physical properties were changed for each computer run of slope stability to reflect each beach condition found after full-scale deposition. The slip circle was held constant to maintain a through-the-embankment-face arc (figure 10, table 5).
Test Results
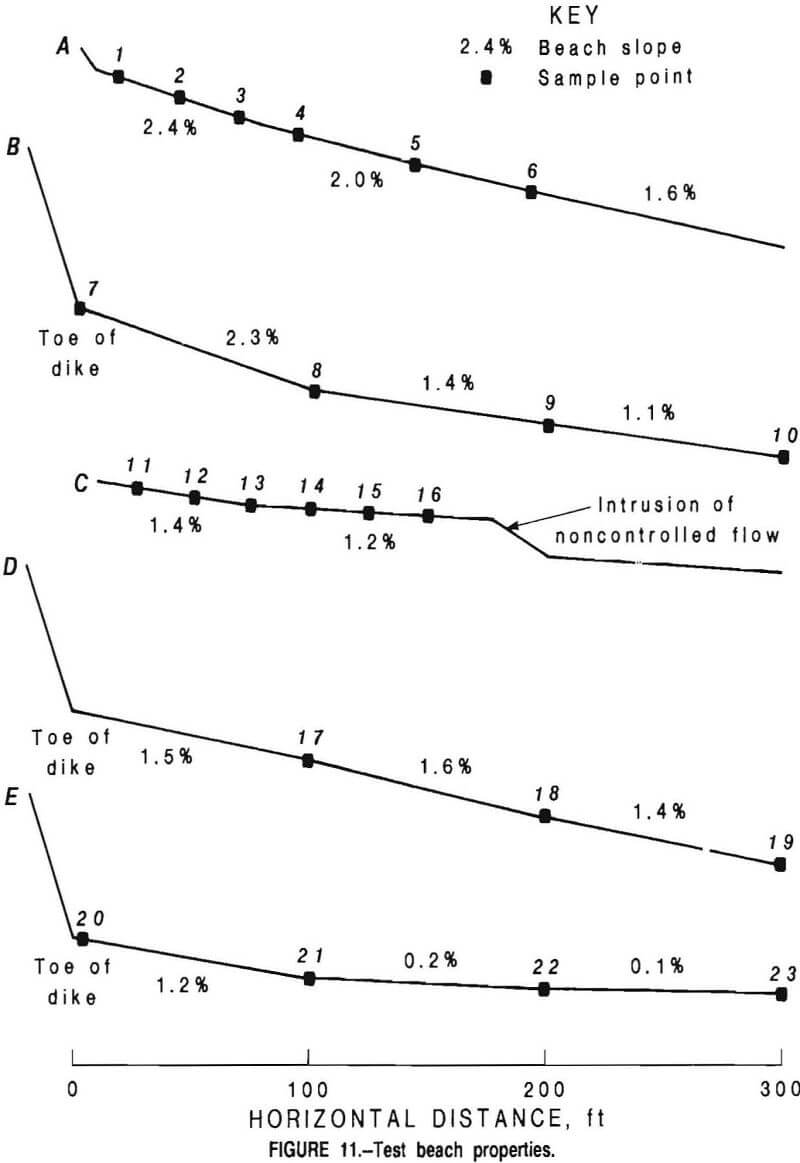
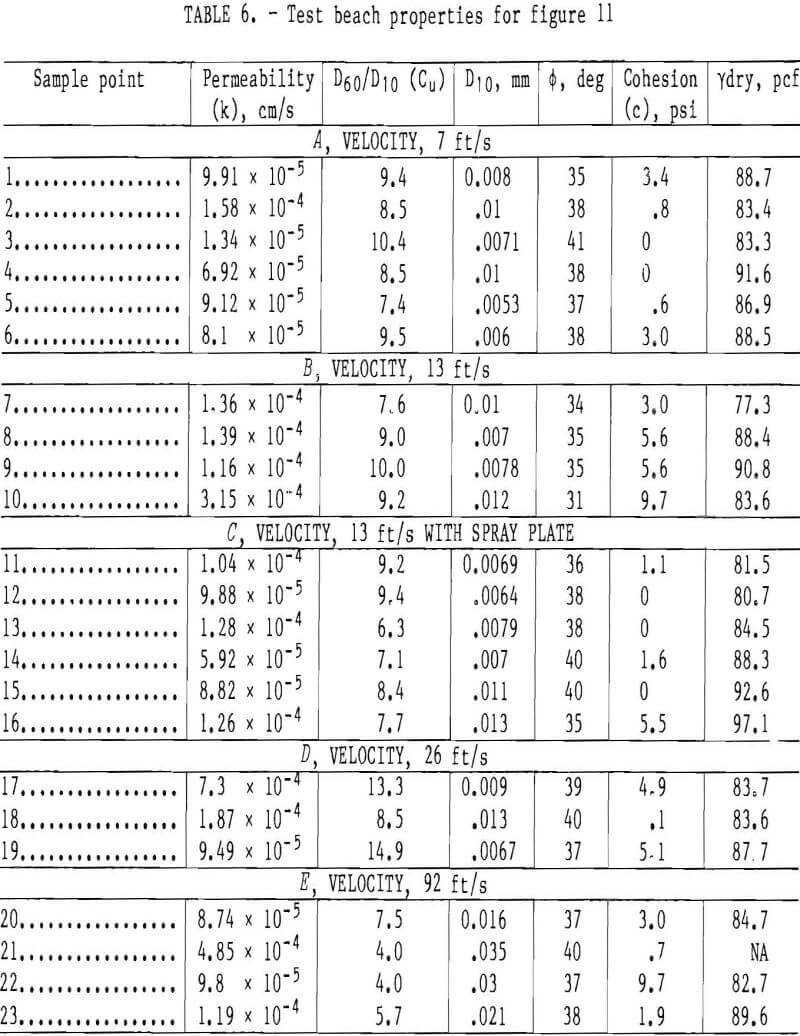
The results of the full-scale field tests are summarized in figure 11 and table 6. The beach slopes, sample locations, and physical properties were listed for each depositional velocity designated by A, B, C, D, and E. From these sample cross sections, the data were plotted to determine relationships among the variables. The data indicate the following:
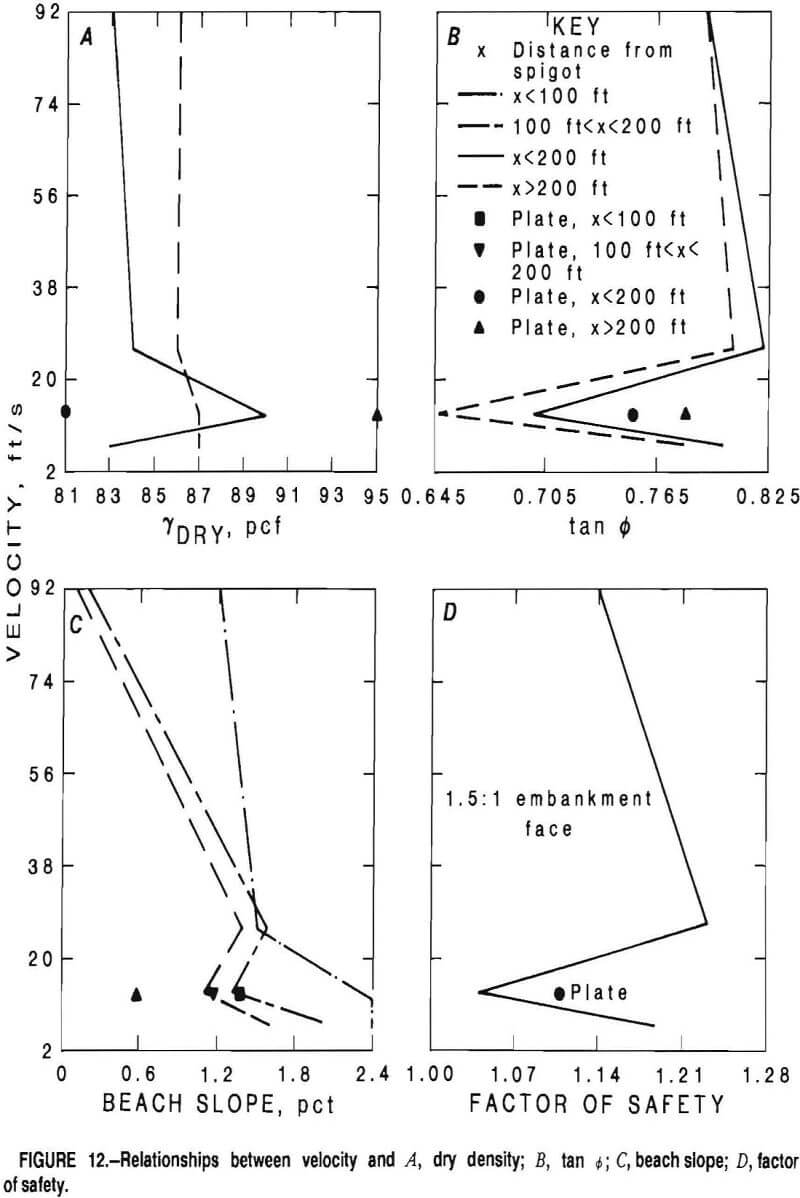
- Dry density did not significantly change for distances greater than 200 ft from the point of deposition regardless of tailings exit velocity (fig. 12A).
- When the spray plate dissipator was used, the dry density increased after 200 ft, but decreased when the distance was less than 200 ft from the point of deposition (fig. 12A).
- The velocity versus the coefficient of friction (tan ∅) trends were also seen in the velocity versus beach slope relationship (figs. 12B and 12C).
- The tan ∅ values were greater for distances less than 200 ft from the point of deposition than they were for distances more than 200 ft (fig. 12B).
- Tan ∅ was the same for distances either less than or greater than 200 ft for the maximum exit velocity studied (fig. 12B).
- Tan ∅ of the beach formed with the spray plate dissipator was greater than that formed by the spigots without the spray plate attachment (fig. 12B).
- The beach that formed when the spray pldte dissipator was used was flatter than the spigot-formed beach at all distances from the point of discharge (fig. 12C).
- At all the velocities studied, the beach slopes were progressively flatter with increased distance from the point of discharge (fig. 12C).
Discussion of Results
This Bureau study analyzed surface tailings deposition characteristics using three types of data gathering techniques. Phase I consisted of random sampling at 18 different surface waste disposal sites. Phase II used a 40-ft-long trough into which two tailings types were deposited at controlled velocities and slurry densities. Phase III required building an auxiliary pipeline on an active tailings pond and controlling the exit velocities of the mill tailings. For all three types of deposition tests, engineering properties were determined for the resulting beaches. These properties were then analyzed to determine if relationships existed between the depositional variables (flow rate, slurry density, etc.) and the resultant beaches (beach slope, grain-size gradation, etc.).
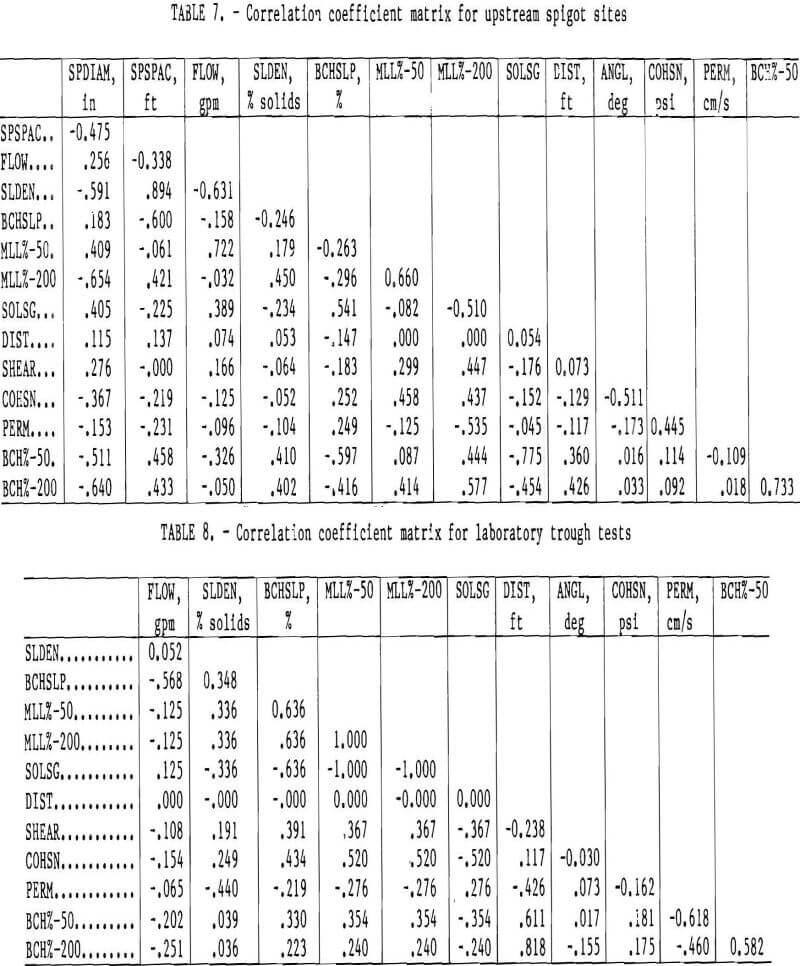
The statistical analysis of the data collected from the phase I field survey of 18 mine sites was inconclusive. Too many different types of depositional techniques were analyzed together to determine individual nuances. For instance, the largest family of depositional type—upstream spigoting—contained six mine sites for consideration. Of these six sites, each exhibited individual differences that may have affected the survey differently, i.e., specific gravity, exit velocity, slurry density. Two-dimensional correlation coefficients (r) were computed for two reasons: (1) to establish whether there were strong correlations between any pairs of variables and (2) to determine if it were feasible to use stepwise regression techniques on the data. Table 7 summarizes the correlation coefficient matrix for the up-stream spigot sites only. The strongly paired correlations between spigot spacing and slurry density (r = +0.89) most likely occurred as a result of common depositional practices in the industry.
Phase II laboratory trough tests indicated that there were even fewer linear relationships between the variables (table 8). One relationship worth noting was the correlation between distances from the point of discharge and the percent passing 200 mesh grain size (correlation coefficient = +0.818). However, the angle of internal friction ∅ and the cohesion did not correspondingly change. Boundary condition constraints seem to have influenced the tailings depositions. For example, the wooden settling trough was apparently too short and narrow, creating back eddies and premature settling of fines. The correlation coefficients of 1.0 should be ignored for relationships between percent passing 50 mesh, mill grind, and percent passing 200 mesh, mill grind; percent passing 50 mesh, mill grind, and specific gravity of solids; and percent passing 200 mesh, mill grind, and specific gravity of solids. The relationships were paired because the material properties were compared to themselves since the same mill source was reflected.
The results of the phase III full-scale field trials are promising, but not complete. The tailings used in the study had a very fine grain size, which did not readily yield definitive differences in material properties. However, because of the fine grain size, the tailings can be taken as the lower limit of a range of tailings sample sizes where the measurements of physical properties also provide limiting values. The correlation coefficient matrix for the tests is summarized in table 9. The strongly paired correlations were as follows:
- r = -0.98 for deposition flow rate and average beach slope. As the exit velocity decreases, the ensuing beach velocity also decreases, causing particles to settle at a faster rate, thus creating a steeper beach.
- r + 0.84 between average beach slope and percent passing 200 mesh, beach sample. An increase in the beach slope angle is related to slowed beach velocity, which in turn causes faster settling of tailings particles. The fines fraction of the tailings are influenced more by the decrease in beach velocity than the coarser (percent passing 50 mesh, beach sample) sands, r = 0.507.
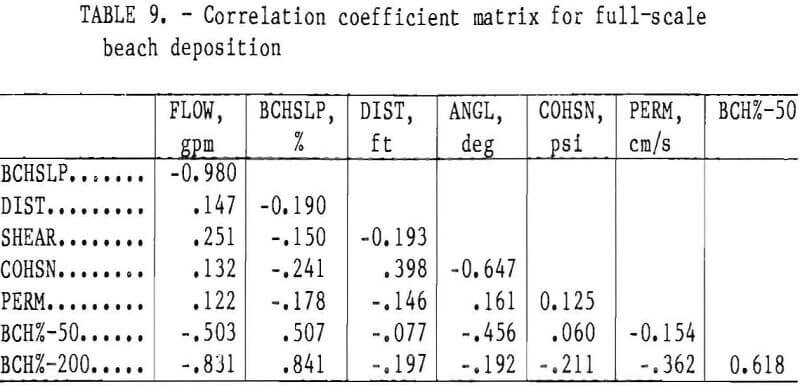
- r = -0.83 between deposition flow rate and percent passing 200 mesh, beach sample. This again points to the interdependency of initial velocity, beach velocity, and the settling rate of the tailings particles.
The test results showed that the dry densities did not change significantly for distances greater than 200 ft. Therefore, tailings particles segregated, and most of the coarse particles settled out within the first 200 ft of deposition. This observation confirms Bentel’s findings that beach slopes conform to a parabolic shape.
The spray plate dissipator affected beach properties by decreasing the dry density and increasing the angle of internal friction. This would indicate greater segregation, causing the coarse particles to settle out earlier. However, as shown in table 6, this beach had the smallest diameter particle size when compared with the other spigot-deposited beaches. Also, the beach slope was consistently less than that of the spigoted beach slopes at any given distance from the point of deposition. These observations support the assumption that energy dissipators allow the particles to flow and settle out in a more heterogeneous manner. This would be advantageous if the tailings were to be used as a source for total tailings backfill.
The angles of internal friction appeared to be related to the beach slopes, as expected. However, there did not appear to be a direct relationship between velocity and factor of safety for this particular tailings (fig. 12D). In fact, there appeared to be a deposition rate that was actually detrimental to the model embankments. At an exit velocity of 12 ft/s, the factor of safety decreased to 1.04. The addition of the spray plate increased the factor of safety to 1.10, but this is still lower than the 1.14 factor of safety of the beach deposited at 92 ft/s. This means that for this particular tailings type, some rates of deposition can have detrimental effects. More field tests are required to confirm whether this phenomenon exists for any other tailings. Figure 10 shows the embankment schematic and resultant factors of safety for the various exit velocities studied.
Conclusions
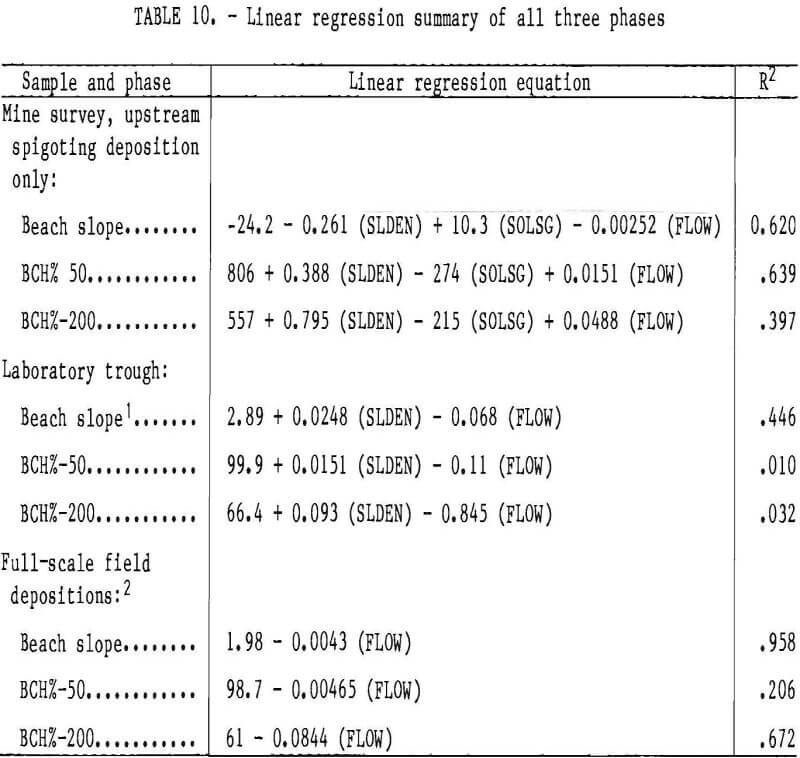
To determine any relationships that may have affected the results in all of the three different test phases, linear regressions were calculated and compared. Table 10 summarizes the R² values of each regression in each test phase. Through this analysis, it was possible to predict the beach slope by knowing the flow rate of deposition, the R² value being 0.958 using the full-scale field data. This relationship dropped to 0.620 when a group of similarly deposited tailings sites were analyzed using the mine survey data, even when parameters of slurry density, specific gravity of the solids, and the mill grind were included. The same relationship between the dependent variable (beach slope) and the independent variables (flow and slurry density) was only 0.446 for the laboratory trough tests. It may very well be that any relationships that do exist between deposition techniques and beach characteristics are nonlinear, in which case higher order analysis techniques and more sample data are needed. One important general observation of the full-scale field test results should be stated. Changes in deposition parameters changed the embankment factor of safety. Considering the high cost of cleanup for a failed tailings pond, any changes in tailings deposition parameters should be evaluated prior to implementation.