The calculation of the performance of coal washing units that are in common use is not difficult and the principles of making such calculations have been known for many years.
The flowsheets to be simulated consist primarily of coal washing units each with a target specific gravity of separation specified for each washing unit. The feed is allocated to each washing unit on the basis of separation by size in the screening operations. This is a fairly common arrangement for modern coal washing plant flowsheets. The target specific gravity of separation is the separation point to be expected when the partition curve of the composite feed to clean coal is plotted without considering each narrow size fraction separately. All gravity separation units are known to show significant variation of separation performance as a function of particle size. In general the cut point increases with decreasing particle size and the efficiency of separation decreases with decreasing particle size. This is particularly noticeable at particle sizes smaller than a few millimeters so-called fine coal separations. The spiral separator deviates from this rule and shows a distinct minimum in the graph of cut point against particle size.
In general the cut point can be controlled by variation of an operational control in the plant or by means of a physical adjustment to the equipment. Dense-medium separators are set by controlling the medium density and the separation density in autogenous separators such as water-only cyclones, concentrating tables and jigs is controlled by physical adjustments. At the highest level, simulation models should accept as input data a specification of the equipment type and the settings of all controllable physical variables and be capable of predicting the cut points and separation efficiencies that will be achieved in practice. Models at this level are not always available and usually require very careful calibration against pilot or full-scale plant data.
Optimising the Plant with Alternative Washing Units
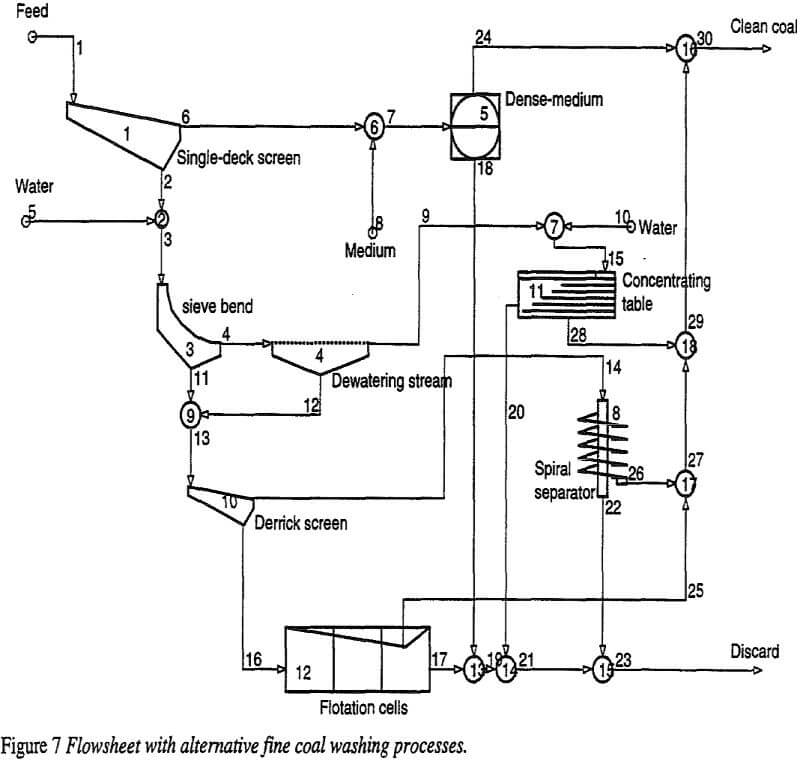
In addition to the selection of optimal set up points for the washing units, simulation is an ideal tool for the investigation of alternative washing unit operations without the need for expensive and time-consuming plant or field experimentation. A number of alternative techniques can be considered for each of the three process streams in the plant. An alternative choice of units for the plant is shown in the flowsheet in Figure 7. A shaking table is proposed to treat the intermediate size and the fines are classified further using a Derrick Screen to produce an ultra fine stream for final cleaning by froth flotation and a fine stream for cleaning in a spiral. Obviously it makes sense to compare overall plant performance at optimal settings when a choice is to be made regarding flowsheet alternatives. Because the simulator is so easy to use any combination of alternative units can be quickly and cost-effectively investigated with the consequent reduction in cost and significant improvement in plant productivity which results when the plant is set up correctly with the units chosen. The concentrating table was modeled using a Gottfried-Jacobsen model and the spiral was modeled using an updated version of the model developed. This model is based on data obtained in a laboratory study of a typical coal washing spiral. The model allows for the joint effect of both size and density on behavior of particles in the spiral. The flotation stage was modeled using discrete distribution of flotation rate constants with allowance for bubble loading limitations which is particularly important for coal flotation. Typical values for the flotation specific rate constants and their distribution for each washability fraction were chosen for purposes of this exercise. These parameters are normally estimated from well-defined laboratory batch or/continuous pilot or full scale plant tests.
The performance of each of the three washing units with respect to their own feeds is shown in Figure 8.
The concentrating table was controlled by variation of the target cutpoint. The performance of the spiral was controlled by variation of the relative cutter position at the discharge end. The effective cut point increasing the closer the cutter is set to the center column of the spiral. Control can be exercised over the flotation operation by variation of the aeration rate although the scope of this variation is not great.
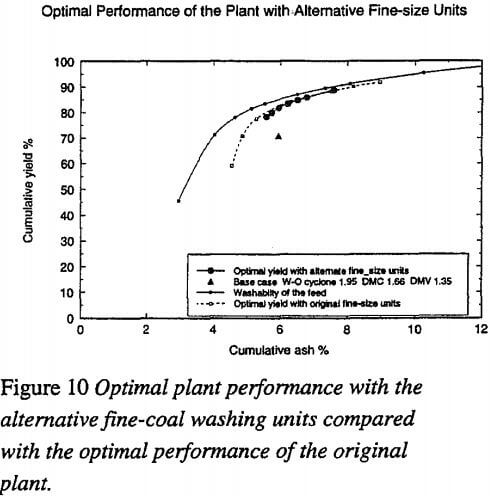
The optimal combination of table, spiral, and flotation control setting were obtained using the optimization procedure that was used for the original flowsheet. The construction is shown in Figure 9. The optimal setting for the dense-medium drum was obtained by transferring the slope of the tangent lines to Figure 3 and finding the point on the dense-medium drum line that was tangential to the line. The optimal plant performance is shown in Figure 10 and a summary of the simulated performance is given in Table 4.
Figure 10 shows again that very significant gains in plant productivity can be made by setting up the alternative units optimally with respect to each other. However, the optimal yield – ash curve for the alternative flowsheet falls slightly below that for the original flowsheet. Consequently the more complex alternative flowsheet is unlikely to be attractive for this coal washing operation and need not be considered further.