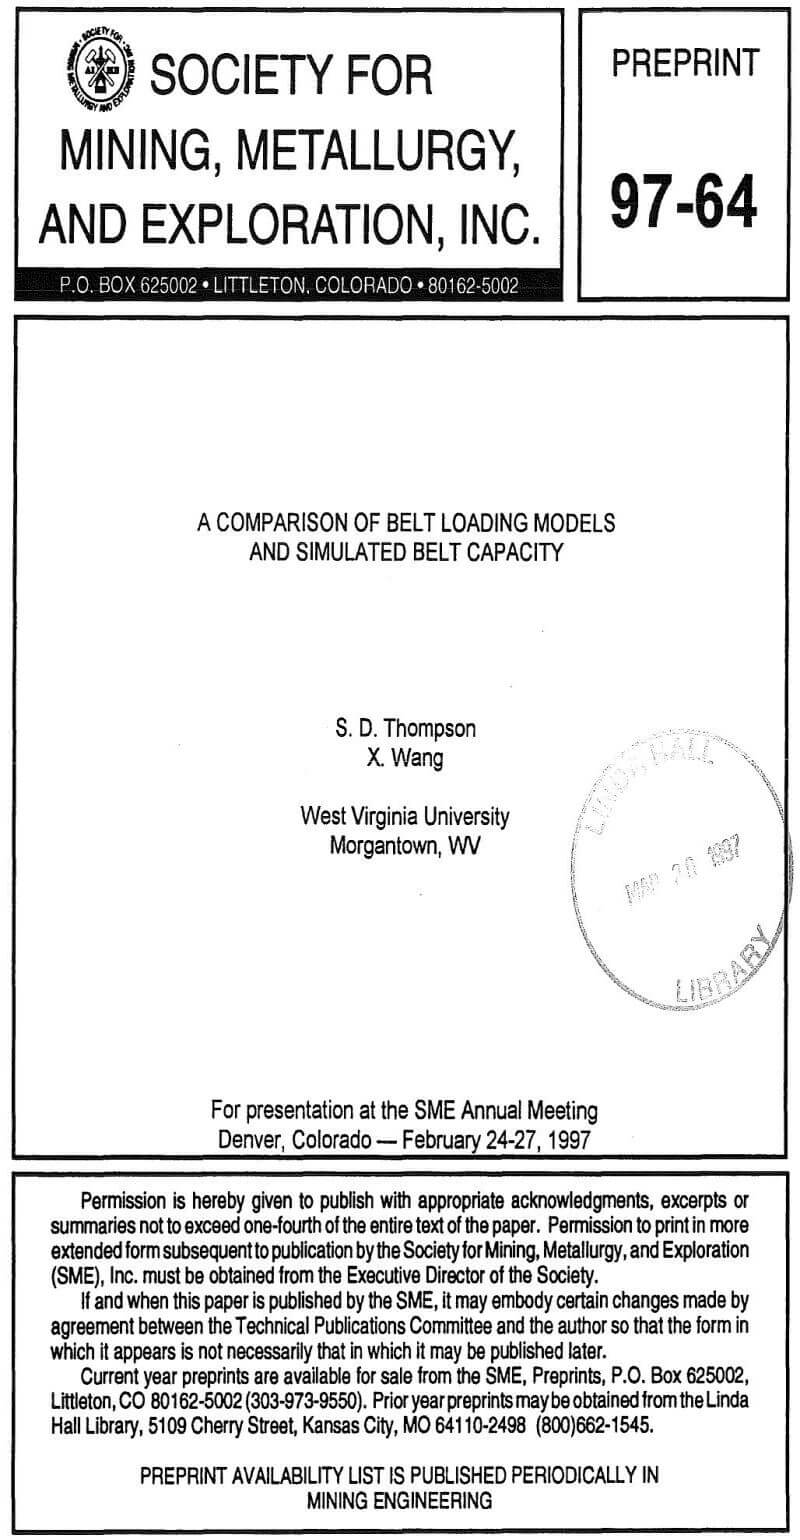
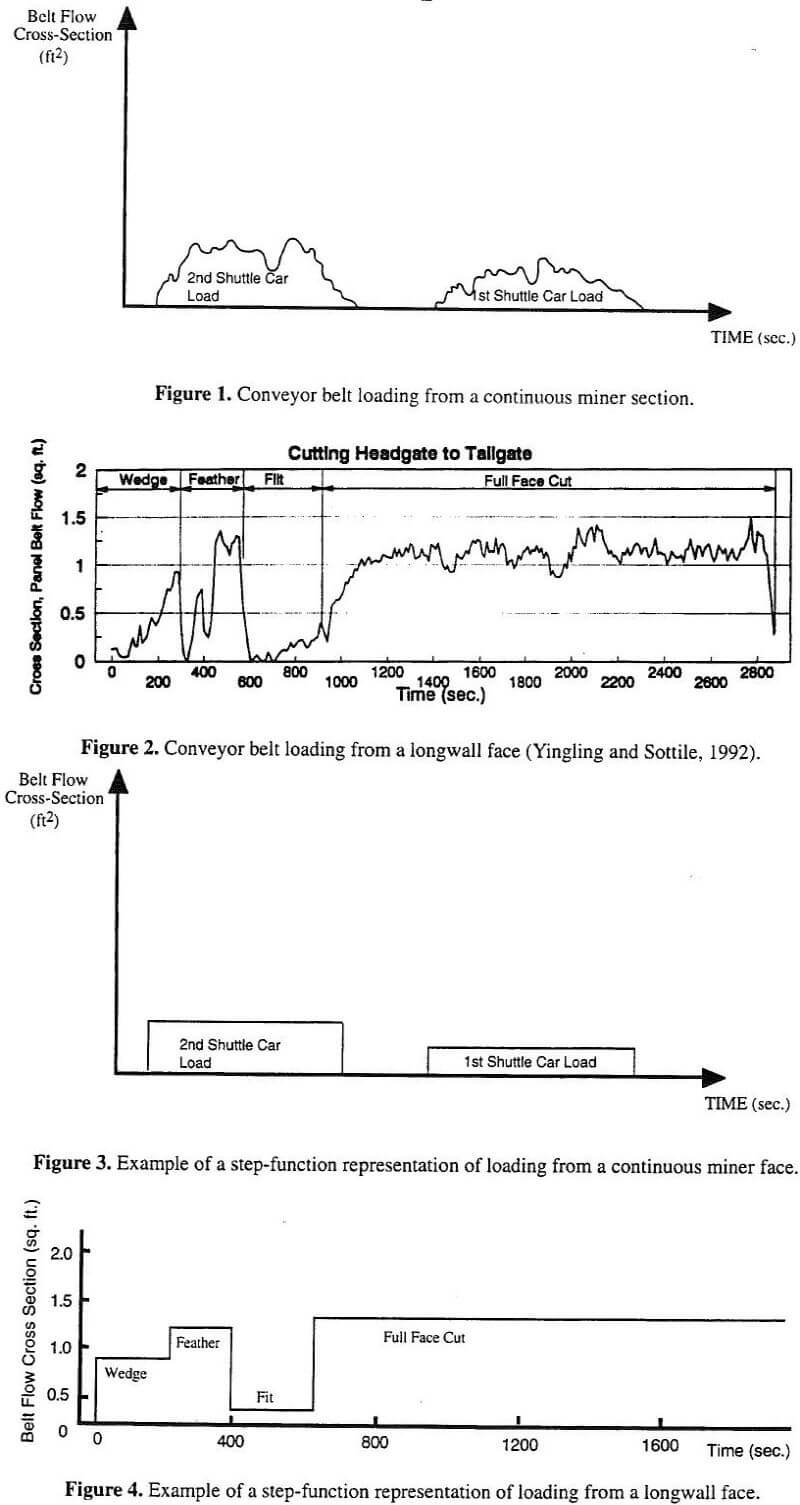
Since changing the capacity of operating systems can be very expensive, it is important that mining engineers have accurate capacity design tools. Although many modeling approaches have been proposed in the literature, simulation models are widely regarded as providing the most detailed and flexible design approach. Over the last three decades, a number of discrete-event simulation models have been developed for designing conveyor belt capacities for underground coal mines. Generally, these simulation models have used step-functions to mimic the loading process at each conveyor loading point. In applying these models, users often resorted to one of three step-function approaches. An important issue is whether each approach provides approximately the same simulated capacity. Another issue is how each approach compares to peak capacity design. To investigate these issues, a large number of experiments were conducted to compare the approaches. The associated experimental results provide a basis for:
(1) selecting a step-function approach, and (2) making better capacity design decisions.
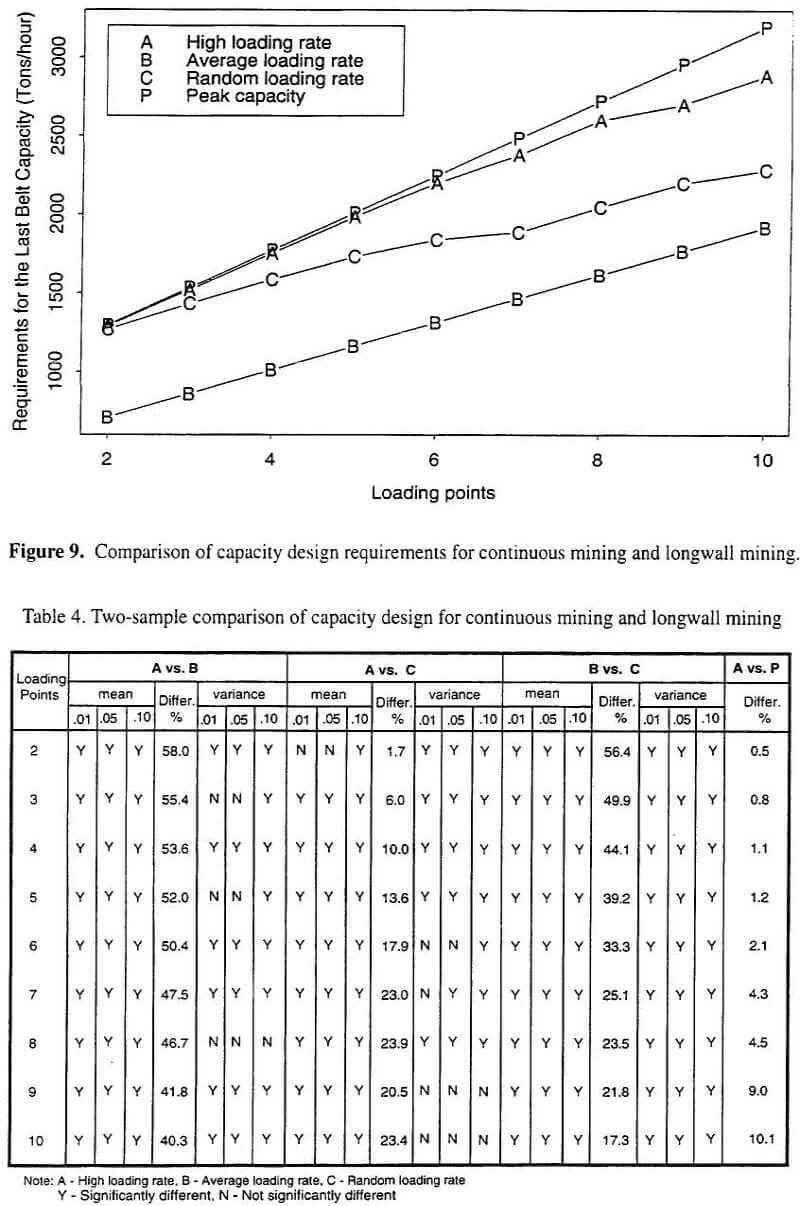
In using simulation models to design belt capacity, the above experimental results indicate that the three step- function approaches provide significantly different belt capacity design. For a number of cases, the difference in the simulated capacity requirements was substantial (up to 58%). Certainly, a difference of more than 38-40% could result in the selection of different width conveyor belts. Depending on the specific capacity requirements, it is also possible that differences as small as 10-20% could provide diffferent conveyor widths. If the wrong conveyor width is selected and installed, the consequences would be spillage (under-design) or an efficient conveyor (over-design). If there is under-design, the problem will likely have to be corrected by either replacing the conveyor or installing a bunker. Both of these options can be very costly. If there is over-design, the cost of inefficiency would have to be weighed against replacing the conveyor. In most cases, the inefficiency would likely prevail.
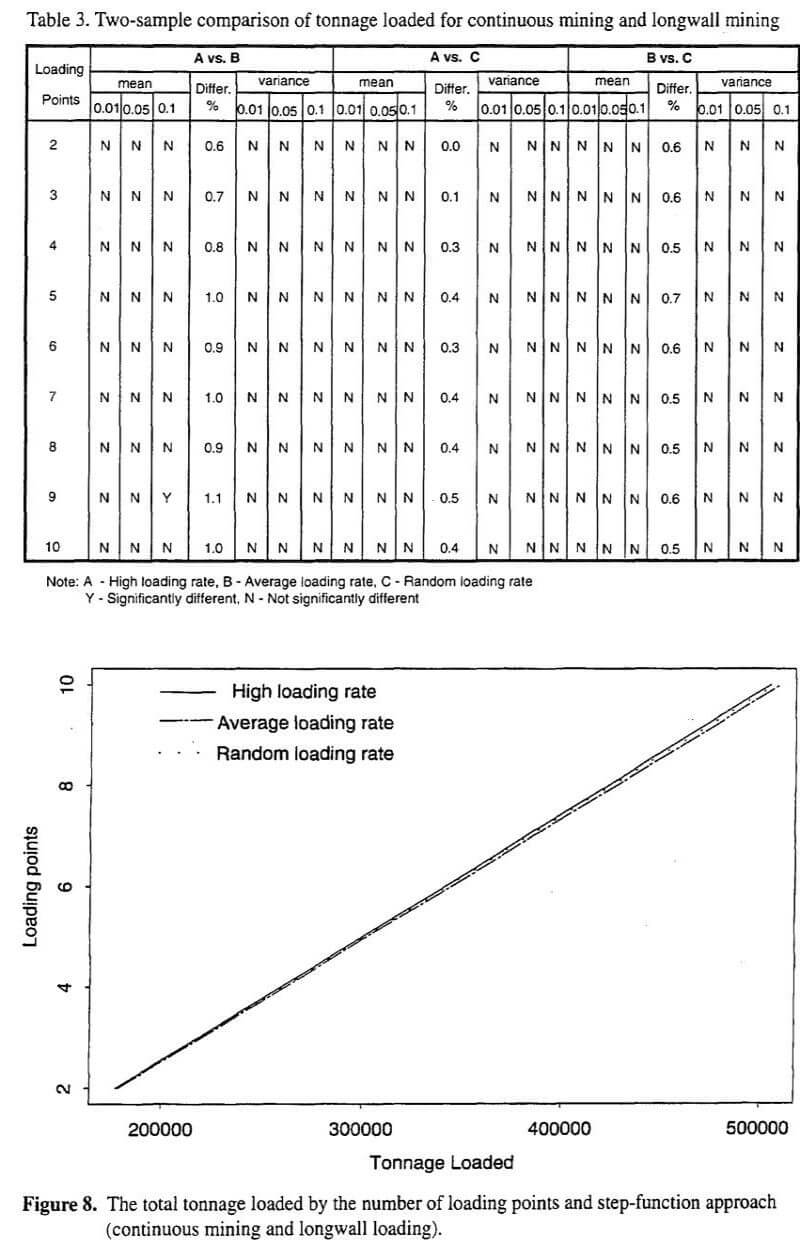
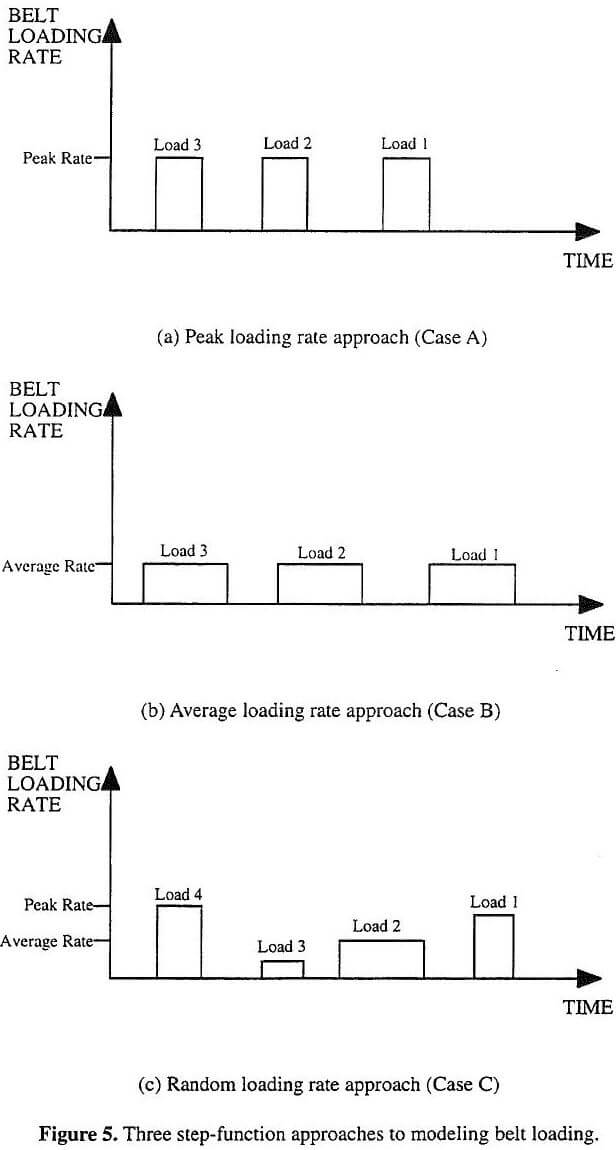
One should also note how the three step-functions compared. Clearly, the most conservative step-function approach is high loading rate (Case A). Within the experiments, it often provided nearly the same design as peak capacity (Case P). As a result, an important question is whether it is worthwhile to apply the high loading rate approach within a simulation model. Essentially, peak capacity appears to provide the same design as Case A, but it is much easier and faster to apply. The most risky approach appears to be average loading rate (Case B). It consistently provided the smallest capacity design. Since the overlap of peak rates is very probable for a small number of loading points (2 or 3), at least in some circumstances, Case B would appear likely to provide under-design. The random approach (Case C) consistently provided capacity design less than Case A and greater than Case B. The only exception was for a small number of loading points (2-3), where Case A and C provided nearly identical capacity design (relative difference ≤ 10%). Overall, relative to Case A and Case B, Case C appeared to be a middle-of-the-road approach.
Three different step-function approaches, which have been applied to mimic belt loading within simulation models, were experimentally compared. These comparisons considered the number of conveyor system loading points, loading from continuous mining loading, and loading from longwall mining. The results of these experiments suggest that the high loading rate approach (Case A) has little or no merit; that is, it suggests belt conveyor capacities nearly identical to peak capacity design. In addition, when the number of loading points are small (2 or 3), the average rate approach (Case B) appears to be risky. However, for larger numbers of loading points, the choice between average rate (Case B) and random rate (Case C) is not as obvious. In the absence of additional information, intuition would suggest the selection of random loading rate approach (Case C) as it is more conservative.
The amount of relative difference (often ≥ 10%) in the step-function approaches suggests that additional research is needed to determine how the belt loading process should be handled within simulations models. As a minimum, additional research is needed to assist in selecting between the random (Case C) and average (Case B) loading rate approaches. An important part of this research will be to accurately characterize the belt loading from longwall and continuous mining faces. Performing this characterization will not be a trivial task as off-the-shelf equipment, such as belt scales or previous used technology, does not appear to have the capability to accurately make the desired measurements.