Flotation Performance in Function of Collector Type & Dosage at Fixed Grind Size: The drop-off in measured plant recovery due to excessive collector dosage has been described. In the above publications, a rate model was used for describing experimental cumulative recovery versus time data of the form:
r = R { 1 – [1/(Kt)][1- exp(-Kt)]}
where r is the cumulative recovery at time t, K is a first order rate constant (units of time -¹), and R is the equilibrium (long flotation time) recovery. The above model or any other appropriate two parameter flotation model containing R and K, e. g. the simple first order model, r = R[1-exp(-Kt)], can be used to curve fit either batch laboratory data or continuous plant data.
It is also very important to point out that the method of analysis is very important when analyzing particle size effects in flotation. It has been this author’s experience that using a model curve-fitted to a complete time-recovery data set to estimate R and K gives more consistent and comparable measures of appropriate K values from data than simply using the recoveries of the first several time cuts to estimate K. The conclusions drawn from these approaches can actually be quite different. The K used in this author’s work is always a model fitted K which can be thought of as a K that has been normalized for a particular R.
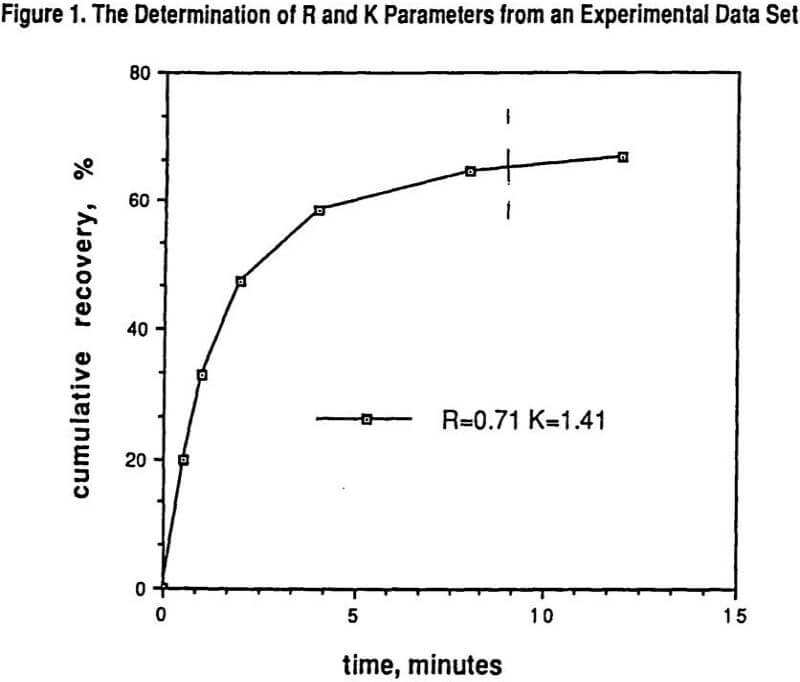
Figure 1 shows the results of determining R and K from a set of batch laboratory experimental data. 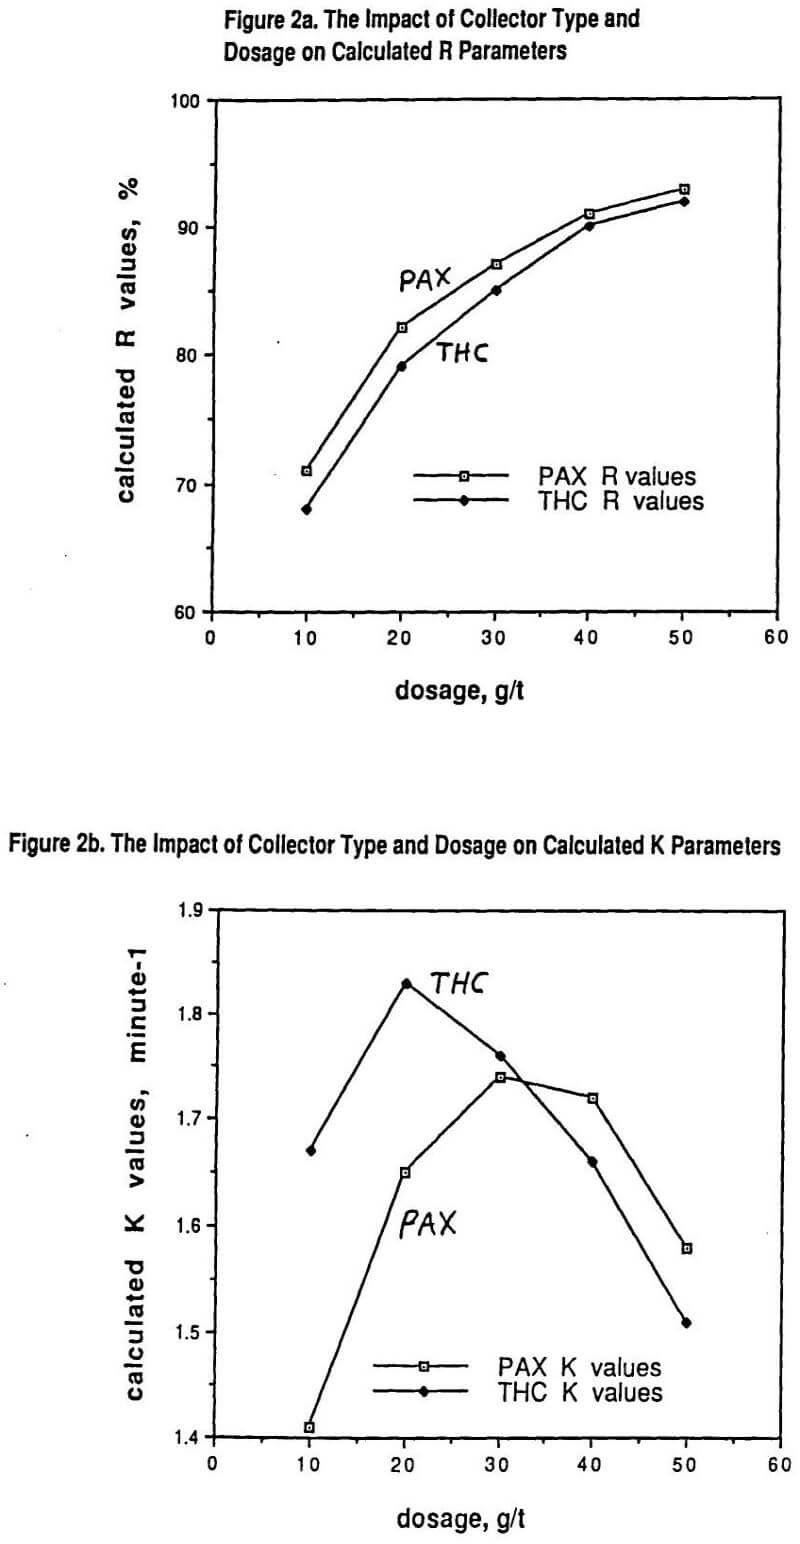
Also indicated in Figure 1 by the dashed line is the time equivalency for using laboratory batch flotation tests to predict a specific portion of the corresponding plant performance. This time value on the laboratory scale needs to be experimentally determined by appropriate laboratory to plant correspondence tests. The many advantages and methods of using parameters from models for comparing experimental data sets has been well documented elsewhere, and include the ease of comparing trends in R and K with varying conditions rather than trying to visualize flotation trends by looking at all of the raw recovery data.
In particular, for a fixed ore type ground to a specified particle size distribution, increasing the dosage of any given collector from clearly being underdosed to clearly being overdosed gives an increasing value of R with dosage but also a curve of K demonstrating a maximum as a function of collector dosage. This phenomenon is shown in Figure 2 for a copper sulfide ore containing primarily chalcopyrite (70%) with some chalcocite and other copper sulfides present (30%) using either potassium amyl xanthate (PAX) collector or a dialkyl thionocarbamate (THC) collector. In both cases, a polypropylene glycol methyl ether frother was used at 20g/t dosage.
Figure 2 makes a simple but very important point that is often overlooked. Even for the same ore at the same grind size (with all of the same simple grinding efficiency indices), the observed flotation recovery (and grade) in the plant can be strongly influenced by both the choice of the collector type as well as by that collector’s dosage. The assumption that a grinding liberation study will characterize the overall efficiency of the combined comminution – flotation plant independent of any reagent chemistry testing is only true if there is lots of excess flotation plant capacity available (i. e. the value of R in the laboratory correlates to the observed plant recovery and the value of K is immaterial). For the obvious economic reason of plants wanting to optimize throughput, this is generally not the case and the higher the value of K, the better the plant results in practice.
Grind Size & Collector Dosage
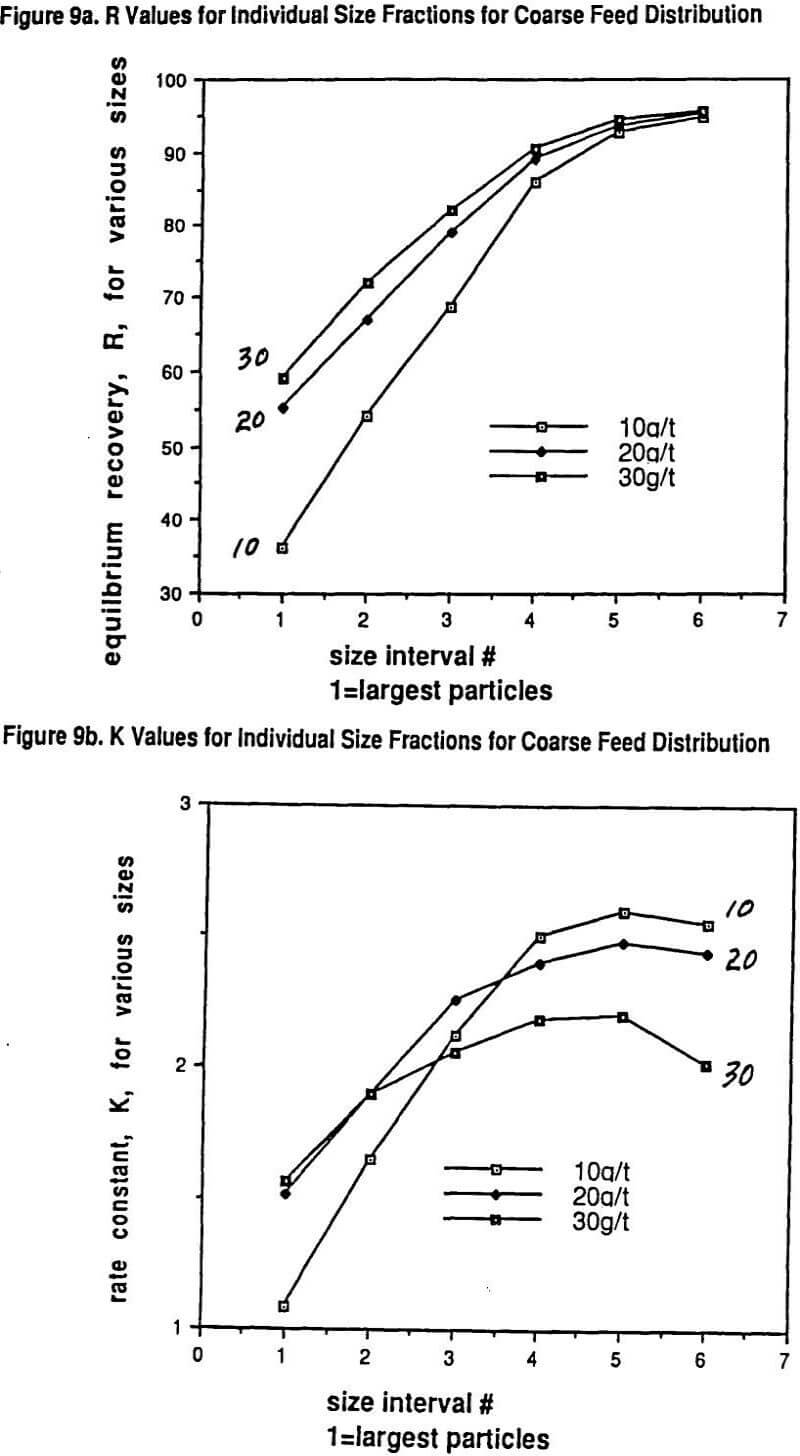
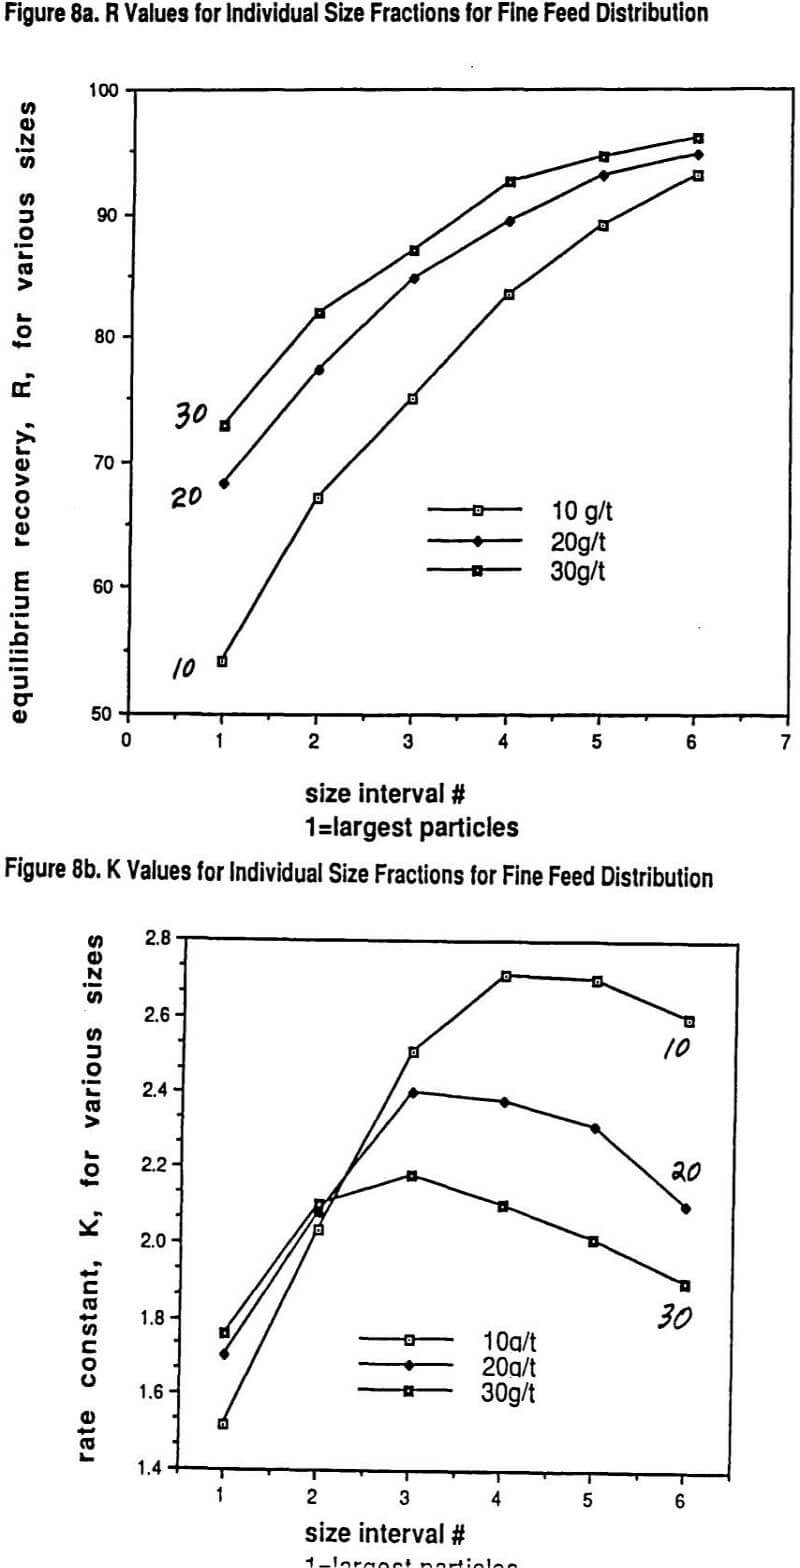
We published several data sets of flotation data showing why the overall rate of flotation, K, for a given grind size goes through a maximum with increasing collector dosage. What has been shown experimentally is that each particle size has its own rate of flotation response with a maximum in the response curve as a function of increasing collector dosage and that the location of the maximum for each size with regard to dosage can be quite different for different collectors.
Larger particles can tolerate much higher collector dosages with both increasing R and K resulting over quite a range of increasing collector dosage before a drop-off in rate is observed. On the other hand, the rate maximum of the finest particles occurs at much lower collector dosages. Thus over much of the practical collector dosage range in plants that do not have excessive flotation cell capacity, there is a region where adding more collector increases the recovery of coarser particles but, at the same time, the recovery of finer particles drops off because the rate of flotation of these fines gets slower and slower. This important self-compensation is denoted as the R/K trade-off.
A very unique data set will be shown that also illustrates in detail the nature of the R/K trade-off with changes in grind size. Thus, possibly for the first time, a carefully measured internally consistent laboratory study has been conducted on how the R and K parameters for a range of sizes vary with controlled changes in collector dosage (potassium amyl xanthate) and grind size. In essence, the study really helps to show just how complicated (and yet consistent) the interactions of size reduction and froth flotation really are. The experimental approach was essentially one of running a factorial experiment including replicates. The ore used in the study was primarily a chalcopyrite ore but with significant copper values (25%) present in the form of bornite and other mixed copper sulfide mineralogies.
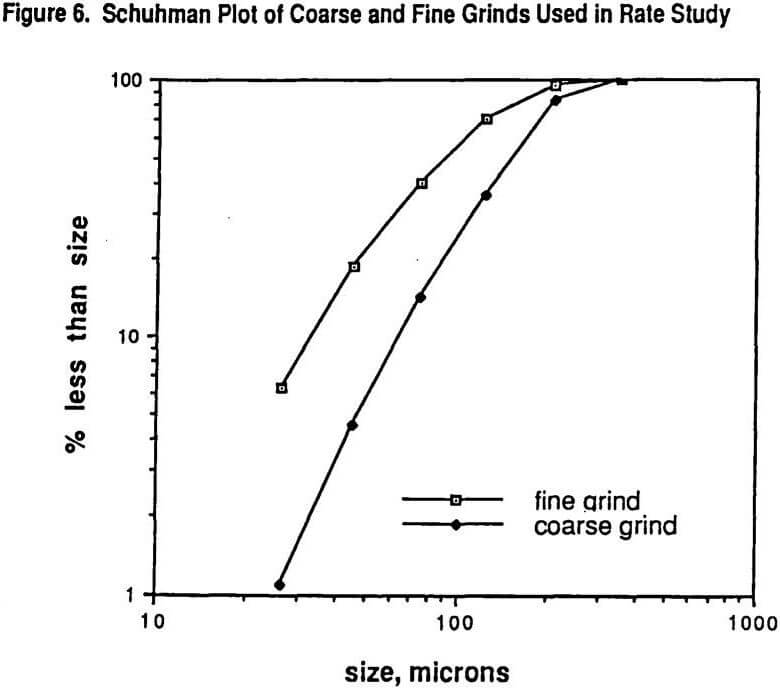
Figure 6 shows the Schuhman plots of coarse and fine grinds used in the study. The fine grind has 5.2% +210 microns while the coarse grind is 16.8% +210 microns. Six size intervals were tested: #1 being >210 microns, #2 being 210 x 125 microns, #3 being 125 x 75 microns, #4 being 75 x 45 microns, # 5 being 45 x 26 microns, and #6 being -26 microns. Figure 7 shows the SEM (scanning electron microscope) determined liberation characteristics of this ore for each of the two grind distributions on the 26 x 45 micron fraction and on the 124 x 210 micron fraction. It can be seen that the liberation of the 26 x 45 fraction is rather complete in both grinds but that the 125 x 210 fraction has a wide range of locked particles as well as fully liberated particles. As might be expected, the coarse grind for the 125 x 210 micron size interval shows less liberation than for the finer grind with the same size interval.
The collector used was PAX at dosages of 10, 20, and 30 grams/ton with frother always being a polypropylene glycol methyl ether of molecular weight 250 at 15 grams/ton. The pH of the flotation was held constant at 9.5 using lime. Time cuts of concentrate were taken using a batch Wemco flotation cell with an automated paddle removal device at 30 seconds, 1, 2, 4, 8, and 16 minutes.
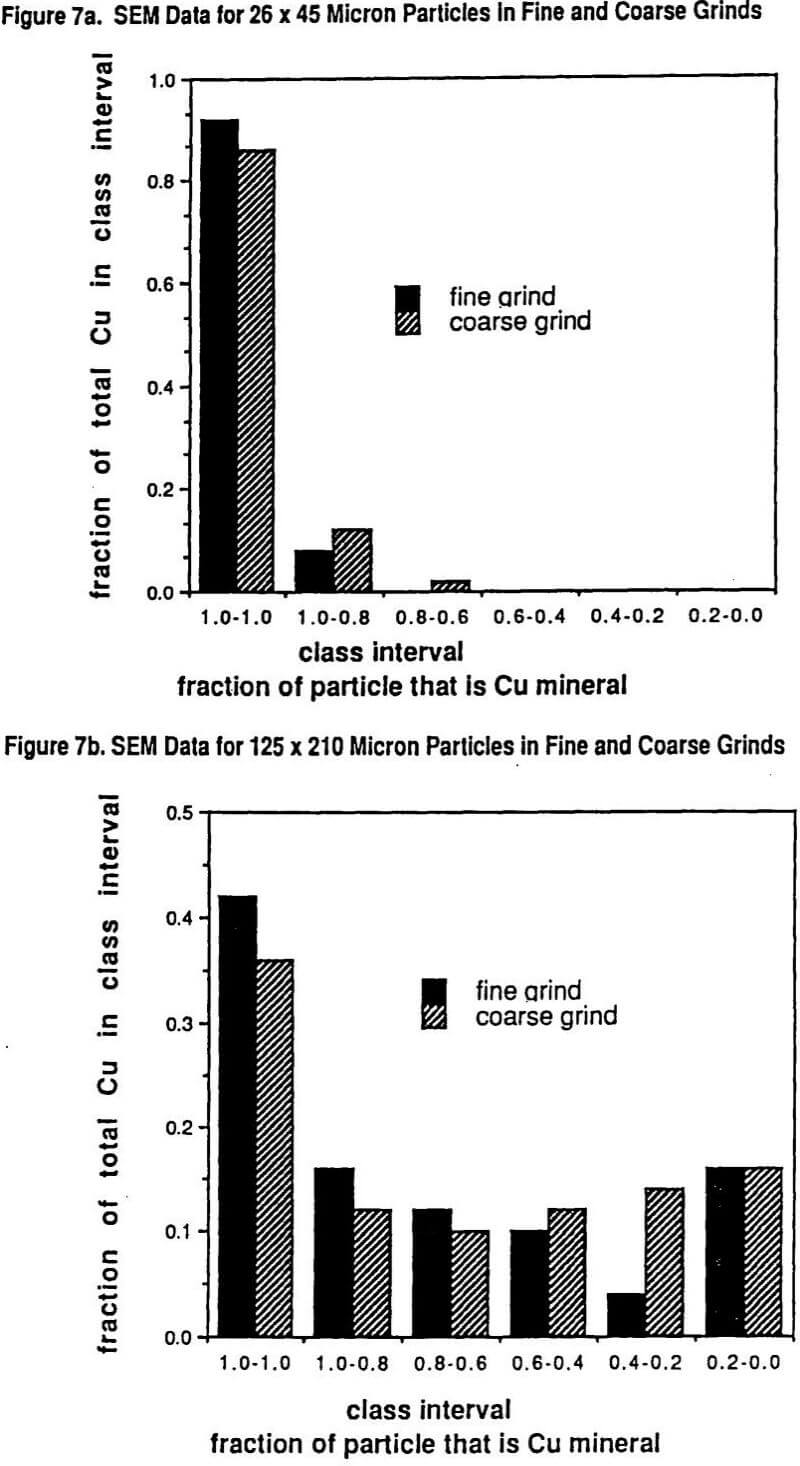
Table 3 lists the overall R and K values measured for the total flotation feed run under each condition. This data, when graphed, is similar to that shown in Figure 2 given earlier.
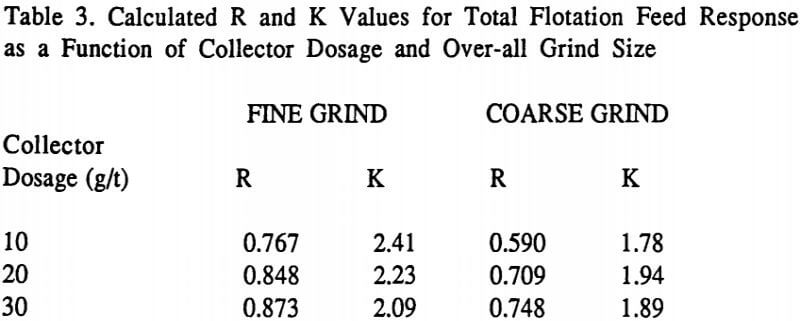
It can be seen in Table 3 with both grinds that increasing the collector dosage increases the associated equilibrium recovery R in all cases. Thus, if one had very ample flotation cell capacity and flotation time was not a factor, then increasing collector dosage would always increase observed plant recovery. As has been discussed elsewhere, this is not what happens in most optimized plants. This is true because it only makes economic sense to push throughput upward (and/or to reduce flotation time) to a point where differences in flotation kinetics under various operating conditions start to affect the observed plant results. In other words, the goal of a plant operator maximizing throughput is essentially to identify what operating conditions causes the loss of overall flotation kinetics so as to finally limit the circuit throughput.
 |
|