Sale!
wilfley table zoom

Hover

wilfley table zoom

Hover

wilfley table zoom

Hover

wilfley table zoom

Hover

wilfley table zoom

Hover

wilfley table product zoom

Hover

wilfley table zoom

Hover

wilfley table zoom

Hover

wilfley table zoom

Hover

wilfley table zoom

Hover

wilfley table zoom

Hover

wilfley table zoom

Hover

wilfley table drawing zoom

Hover

wilfley table drawing zoom

Hover

wilfley table drawing zoom

Hover

wilfley table zoom

Hover

wilfley table
wilfley table
wilfley table
wilfley table
wilfley table
wilfley table product
wilfley table
wilfley table
wilfley table
wilfley table
wilfley table
wilfley table
wilfley table drawing
wilfley table
Full Screen

< 1/2 TPH Wilfley Table

US $30,000

The Wilfley table is a genuinely unique gold concentrating table first developed over 120 years ago.

  • This Wilfley Table unit is driven by head motion with a stroke adjustment of between 8mm and 16mm (nominal).
  • Head motion is self-lubricating. Simple, robust design requires minimal maintenance.
  • The deck is supported on sixteen carriers and is vibrated diagonally along the entire length.
  • The deck is manufactured from high-quality timber, marine-grade plywood and covered with 5mm
  • smooth rubber for maximum durability. (Black/white option).
  • Specific riffle patterns can be fitted to maximize metallurgical performance (by particle size/application data).
  • Table tilt can be easily adjusted using a hand wheel, even while the machine is in operation.
  • Supplied on its own galvanized steel base.
  • The unit fitted with a 1.5kW (2HP) motor.
  • Wear-resistant polyurethane “fingers” along the concentrate edge provide accurate cutting of concentrates.
  • A wash-down hose and spray gun option.
  • New design feed box facilitates even solids distribution onto the deck (urethane).
  • Product launders included.
  • Stainless steel water pipe and fittings are optional.
  • Table deck measures 887mm (35 inch) X 2445mm (96 inch)

This Wilfley Table works best for these applications:

  • Recovery of Gold and other precious metals from low tonnage streams.
  • Recovery of cassiterite and tantalite/columbite from ores.
  • Recovery of other heavy minerals and materials.
  • Gravity cleaning / final concentration in fine particle gravity circuits.
  • It will do wonders on -2mm scrap electronics.
  • It will also do wonders on gold that has any other metals in it such as pyrite/lead/magnetite.
  • It will outperform all other shaker tables if there is any other dense contamination.
test

Description

wilfley tablewilfley table

Shaker Table’ Technical Specifications

  • SHIPPING INFORMATION:
    Equipment Dimensions 3386mm Long x 1771mm Wide x 1455mm High & 1020kgs
  • DECK DIMENSIONS:
    Nominal 2.1m square (23 square feet)
    Deck area, Conc Edge 887mm (35 inch), Tail Edge 2445mm (96 inch), 95 Kgs (210 lbs)
  • ELECTRICAL SUPPLY:
    3 phase, 380/415V 60/50Hz, 1.5kW
  • WATER SUPPLY:
    Wash Water requirement of 5 to 20l/min Feed dilution to ~25-30% w/w solids
  • SOLIDS THROUGHPUT RATE:
    Up to 450Kgs/hour (particle size dependent) (1000 lbs/hr)
wilfley tablewilfley table product
wilfley table drawing

wilfley table

wilfley table

gold on wilfley table

wilfley table drawing

The Wilfley table is a truly remarkable gold concentrating table first built on a preliminary scale in May 1895. The first full-sized table was built by Mr. A. R. Wilfley and was used in his own mill in Kokomo Colo., in May 1896. The first table sold for installation was placed in the Puzzle mill, Breckenridge, Summit County, Colo., in August 1896.

Holman Table – Operating & Maintenance Manual

The mill enthusiasts at first hailed it as the cure for all the ills that flesh is heir to in the milling line. A little later it was found to make losses which were serious, and on this account, the table succeeded only to a limited extent in displacing the vanners of the gold-mills. Still later, mill-men in a number of districts throughout the country made special studies of the faults of the machine and devised a number of ways of grouping supplementary machines to overcome as far as possible the losses, and at the same time retain the benefit of the extraordinarily large capacity accompanied by the production of clean concentrates for which the machine has become so justly famous.

used-wilfley-concentrating-table-for-sale

I hope to make an exhibit of some of these methods in an appendix to my book on ore-dressing which is now in preparation. These experimenters have not written up the subject, and if they possess all the facts they have not given them out for the benefit of the mining profession at large.

The object of this paper is to obtain the facts and to present them so clearly that their bearing can be seen by all. To this end, two complete series of tests have been planned. One (the present paper), to study the concentration of galena in presence of quartz; the other (to follow shortly), to study the concentration of chalcopyrite in presence of quartz.

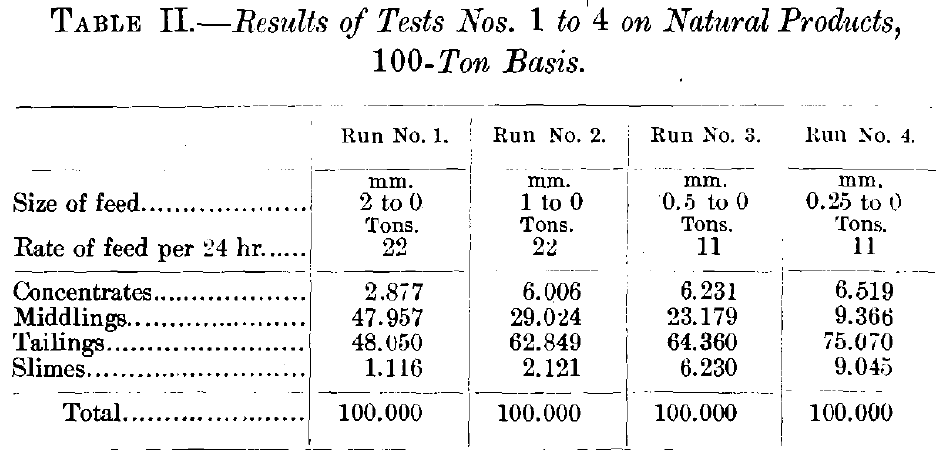
Some authorities claim that the table does its best work when treating natural products; by this phrase, I mean products which have been crushed to pass through a limiting sieve, but have had no other preparation whatever; in consequence, they have all sizes of grains of both the heavy valuable mineral and the light waste gangue, ranging from the largest grains that can pass through the sieve down to the finest dust.

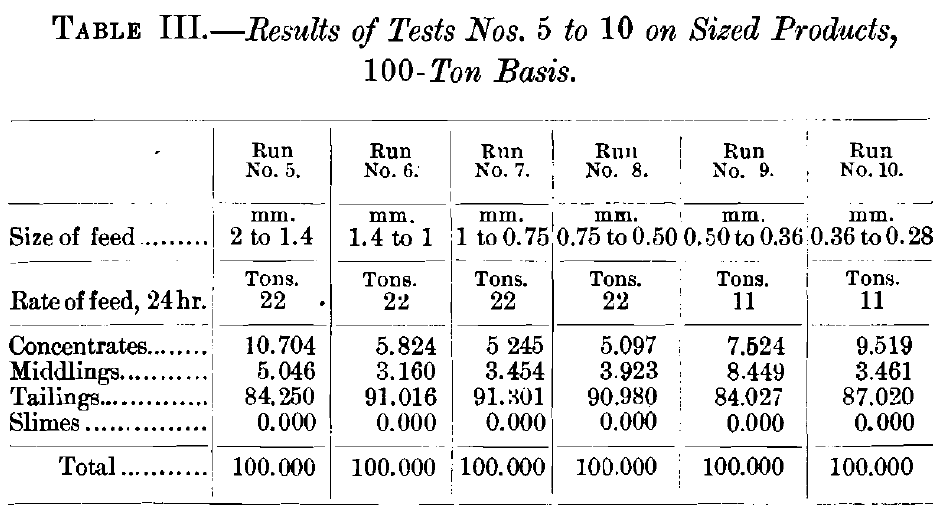
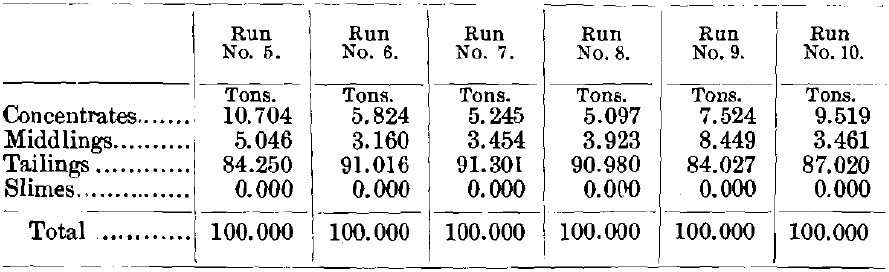
Others claim that the ore fed to a Wilfley table should be closely sized before it is fed. That is to say, it should be divided by a series of sieves ranging from coarse to fine into a series of products with sizes of grain ranging from coarse grains to fine grains; and that each of these products, in which the grains of the heavy mineral are of approximately the same diameter as the grains of the light mineral, should be fed to the Wilfley table.
used-wilfley-concentrating-table-world-wide

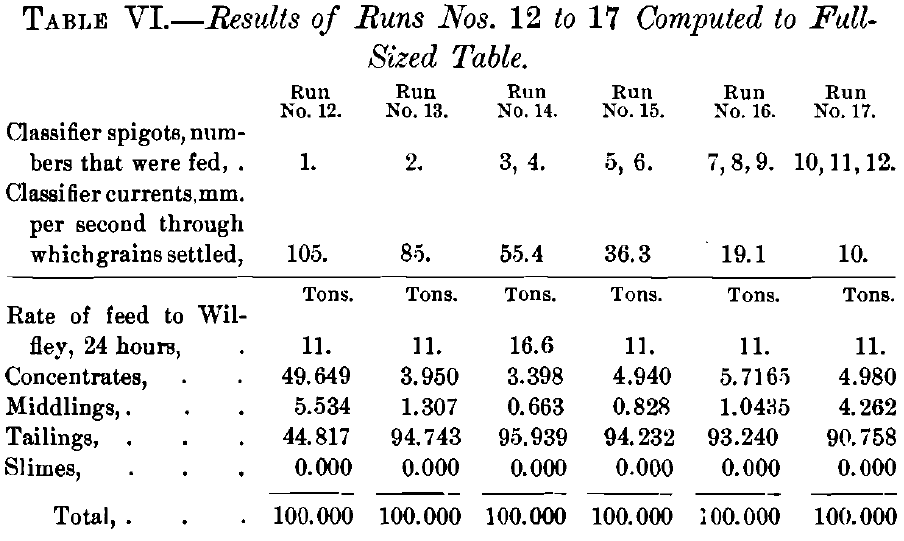
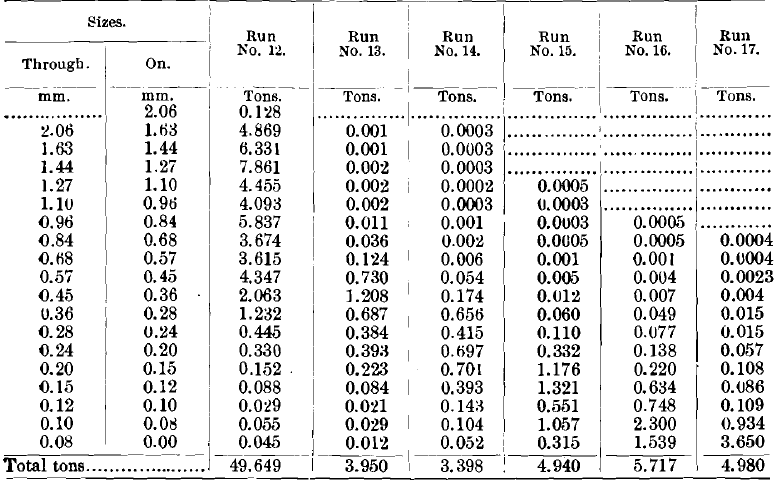
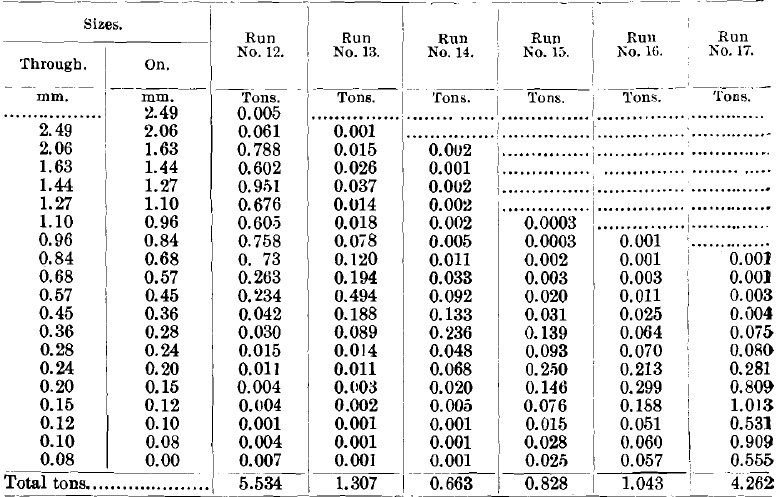
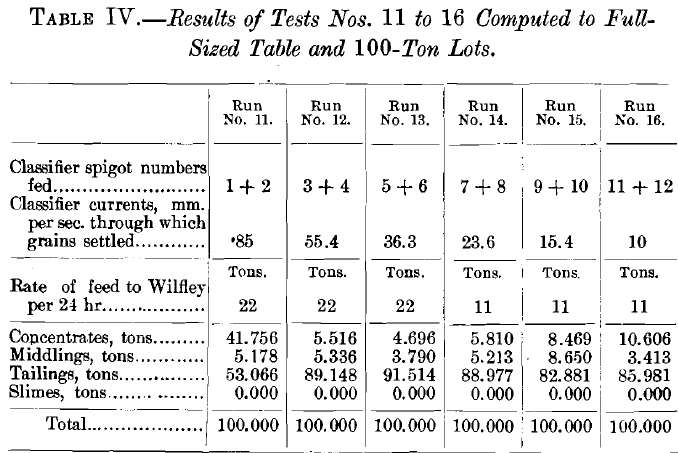
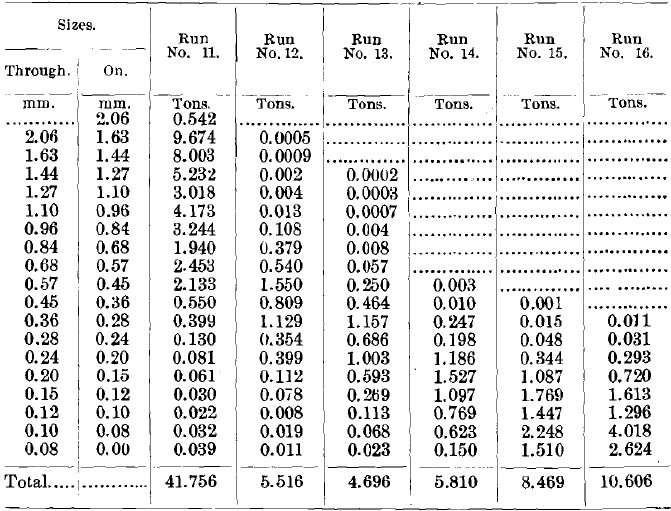
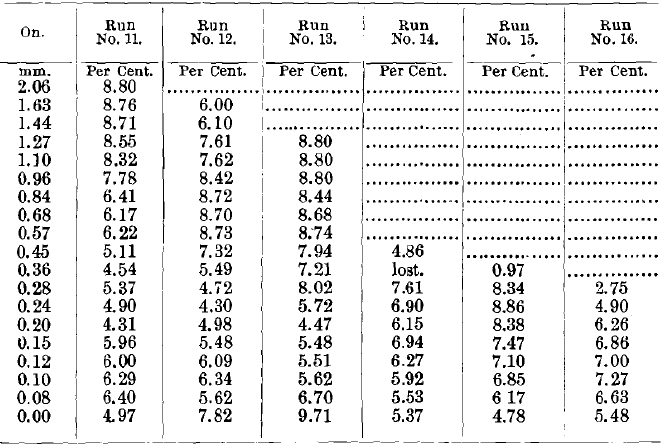
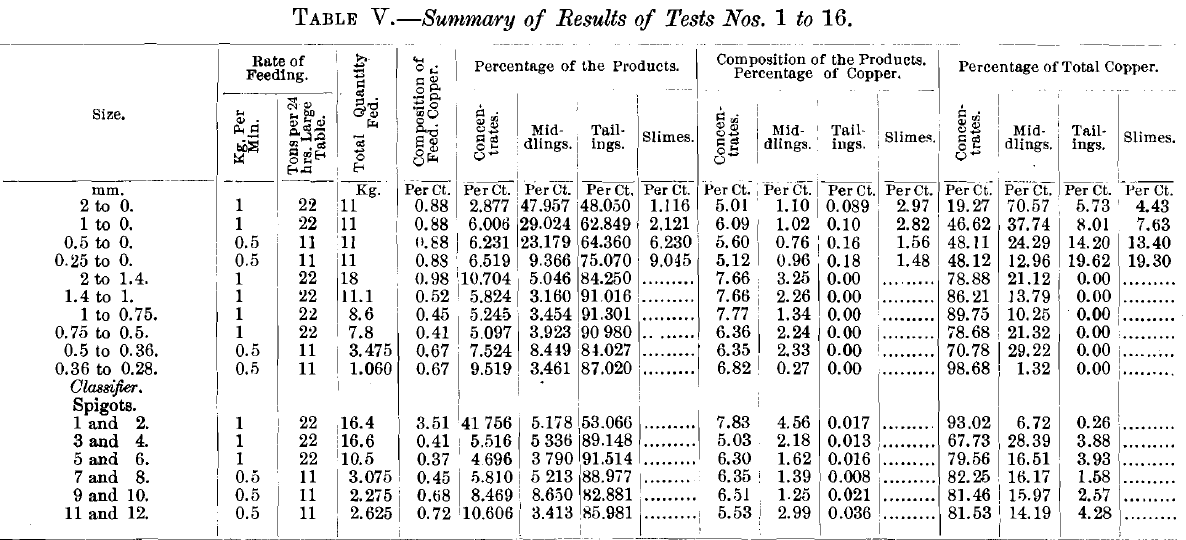
Still, the third group of authorities claims that the ore before being fed to a Wilfley table should be classified by a hydraulic classifier, which divides the crushed ore into a series of products ranging, like the sized products, from coarse grains to fine grains, by carrying it in a water-current over a series of apertures or vertical pipes, called sorting-columns, up through which water-currents are passing. These currents are graded from faster to slower, and therefore allow only the heaviest grains to settle down through the first sorting column and out through the spigot, while lighter smaller grains settle in the second, and still lighter in the third, and so on, diminishing until the last sorting-column and spigot give very small grains, and the overflow has the finest grains of all. The classified products differ greatly from the sized products in that the grains of the heavy mineral is much smaller in diameter than the light grains with which they settle, and therefore behave in a somewhat different way upon the Wilfley table from the sized products. It should be said that the first spigot-product of a classifier differs from the others in having coarse grains of the heavy mineral present also.

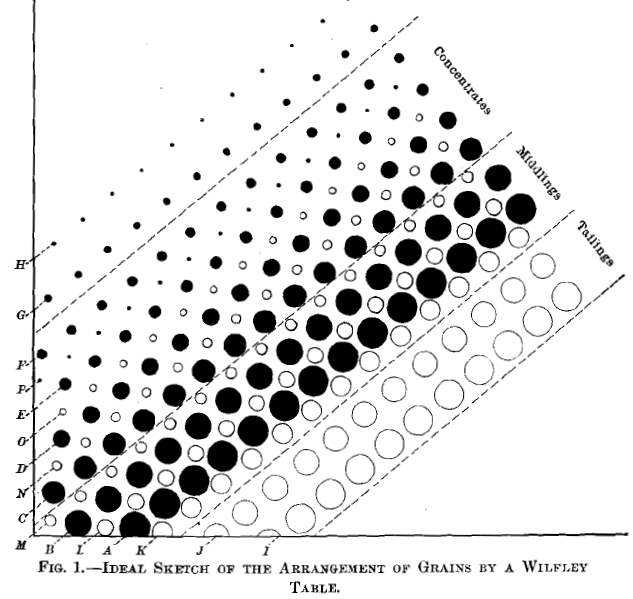
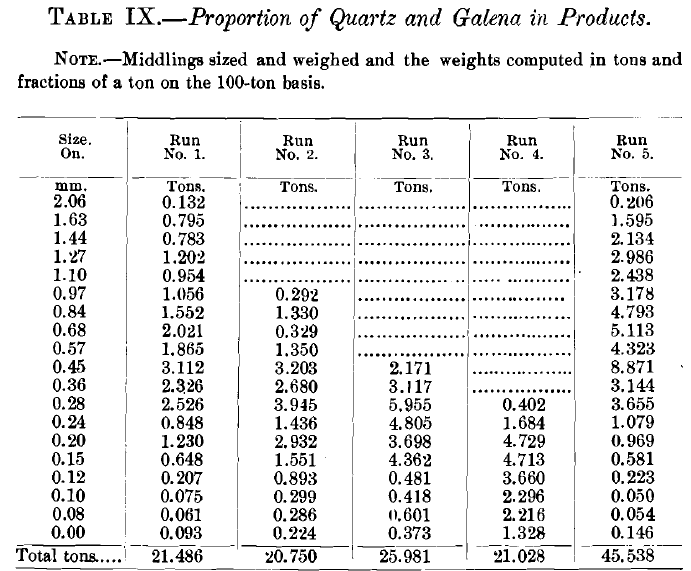
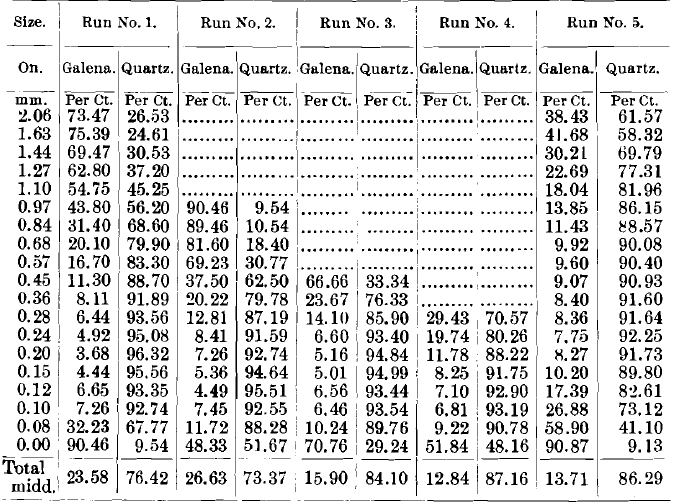
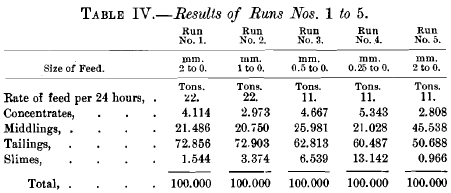
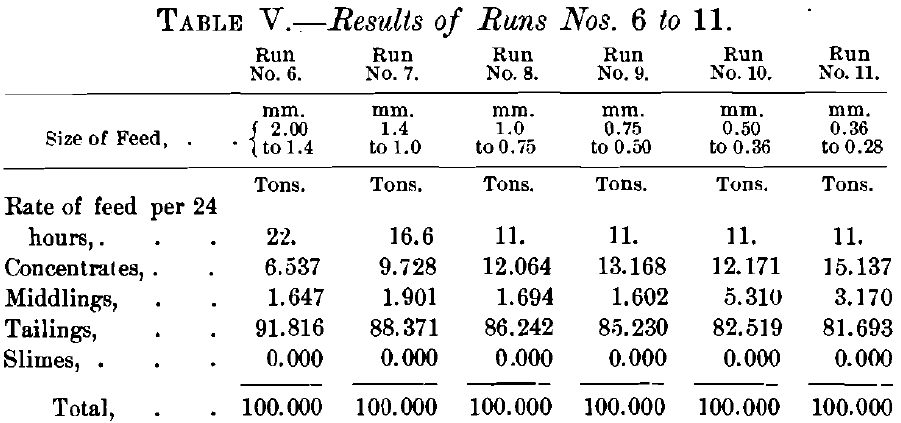
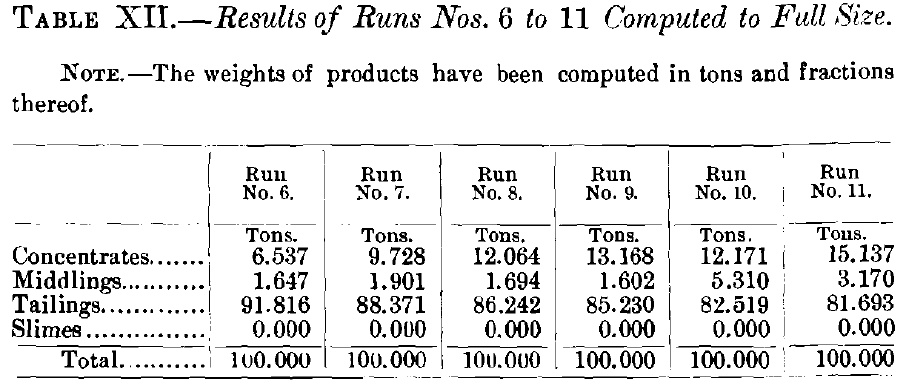
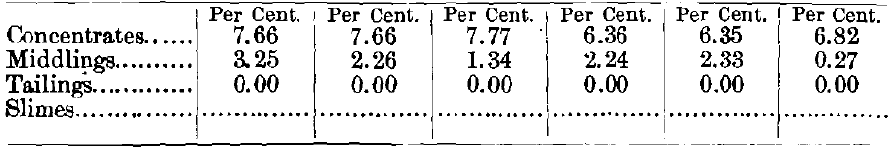
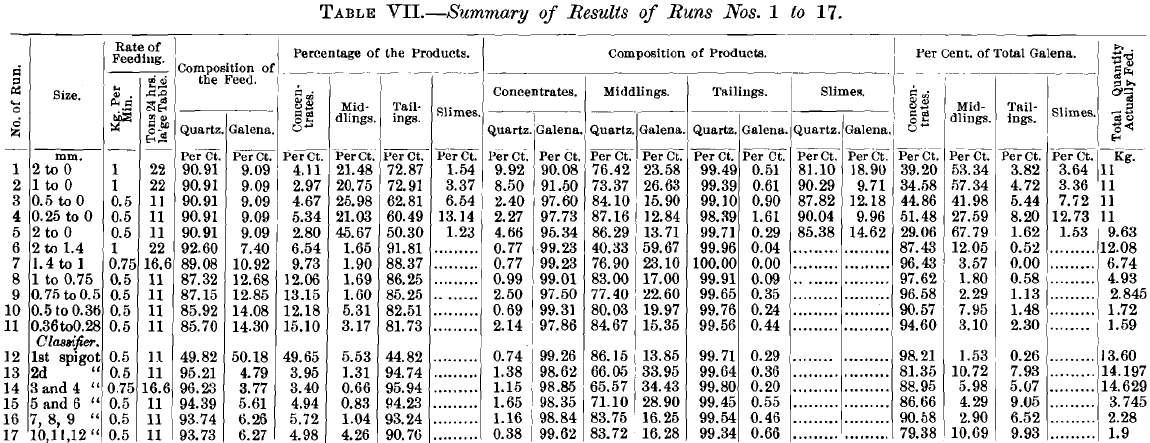
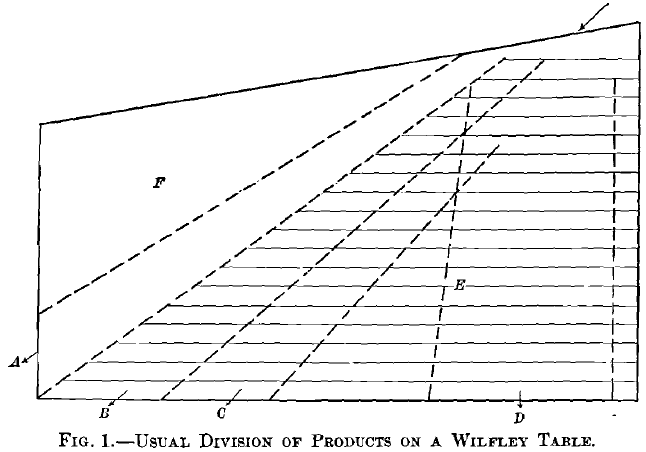
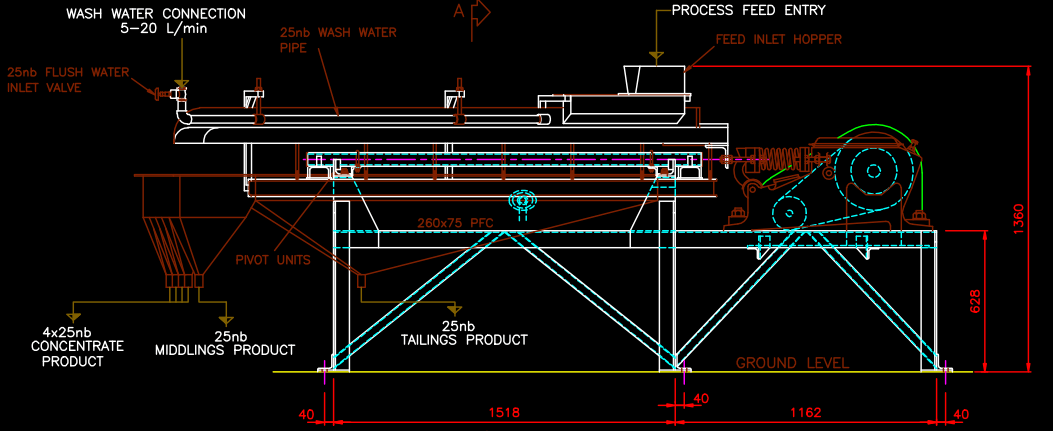
The usual division of products upon a Wilfley table is easily and naturally made, as shown in Fig. 1, A being concen­trates; B, middlings; C, tailings, and D, slimes. Of these, when natural products are fed, the concentrates, A, are nearly clean heavy mineral, slight contamination of small grains of quartz being present. The middlings, B, carry some large grains and also some small grains of heavy mineral. The tail­ings, C, carry some very small grains of heavy mineral, and the slimes, D, carry very minute grains of heavy mineral.

I believe that the small grains of heavy mineral in middlings, B, and tailings, C, is of less diameter than the smallest in the concentrates, A, and of greater diameter than the majority in the slimes, D and that they belong in middlings and tailings from the law of their existence. The re-running of such middlings upon the same table is therefore not a wise proceeding, and only admissible as an expedient in small establishments when the quantity of middlings is not sufficient to warrant other provision. So much for the speculation before the investigation was made.

A lower-cost table than an original Wilfley is the RP 4 Shaker Table.

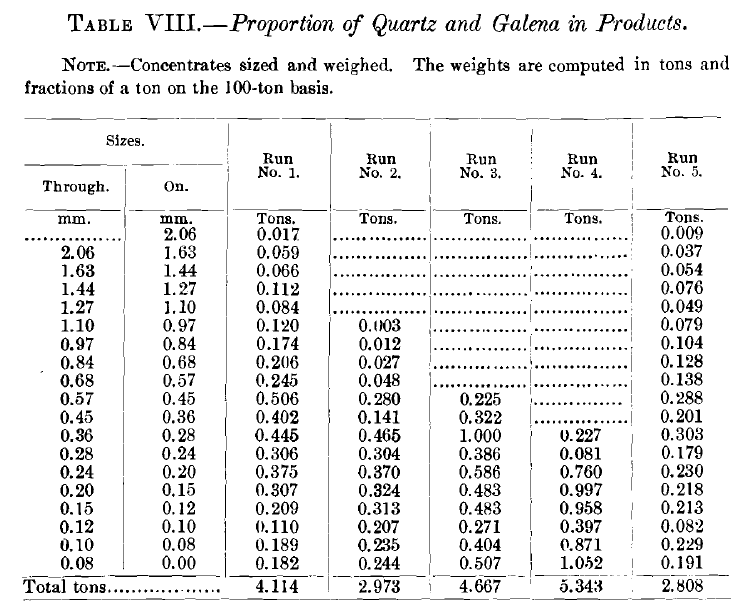
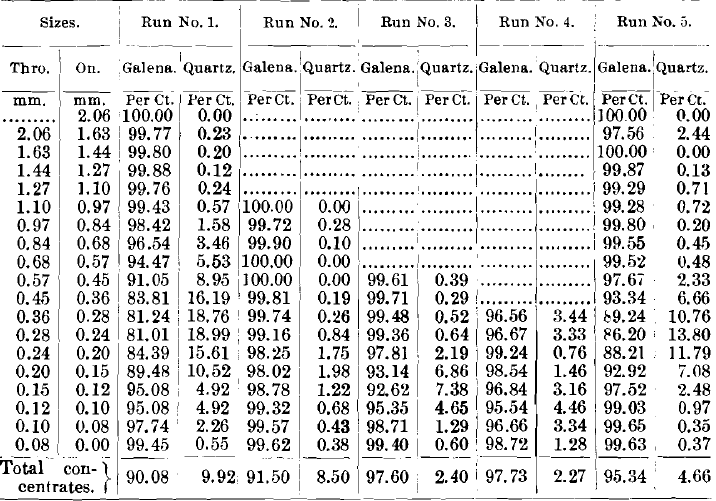
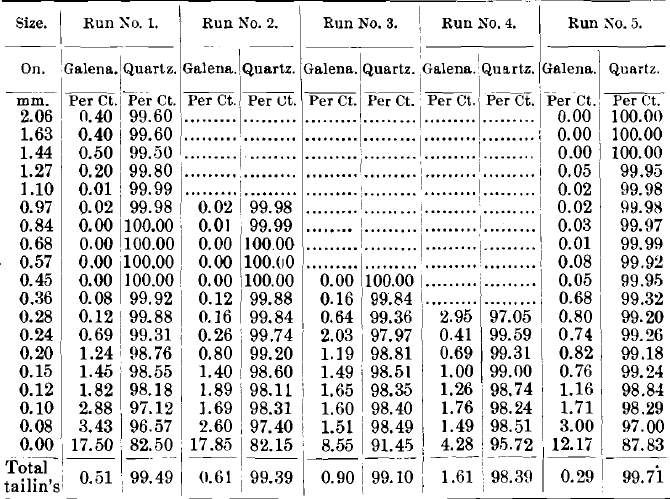
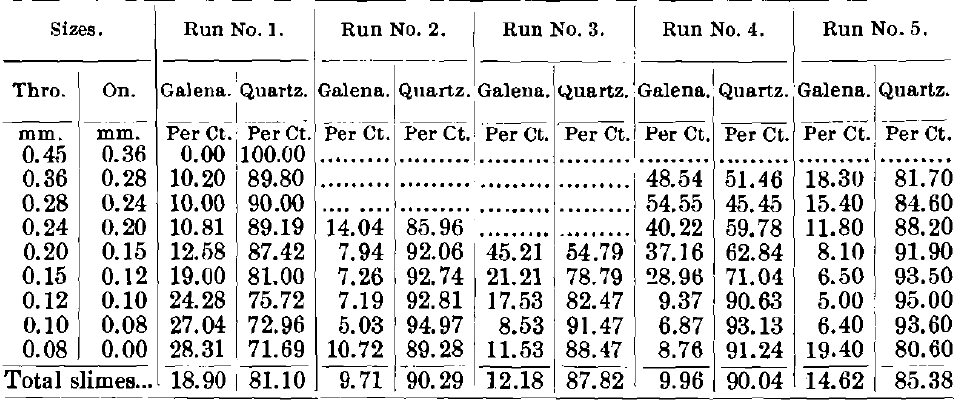
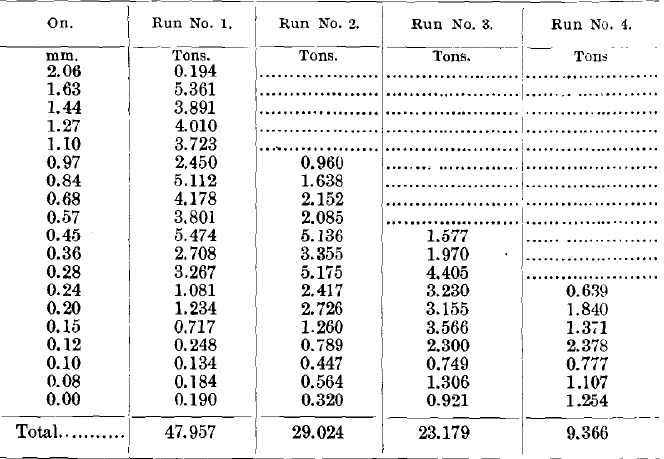
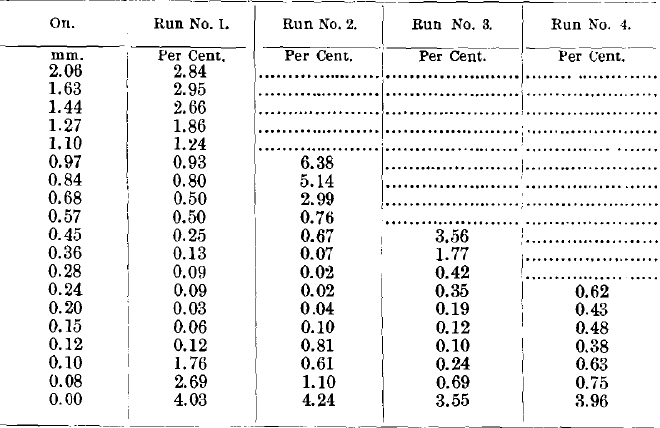
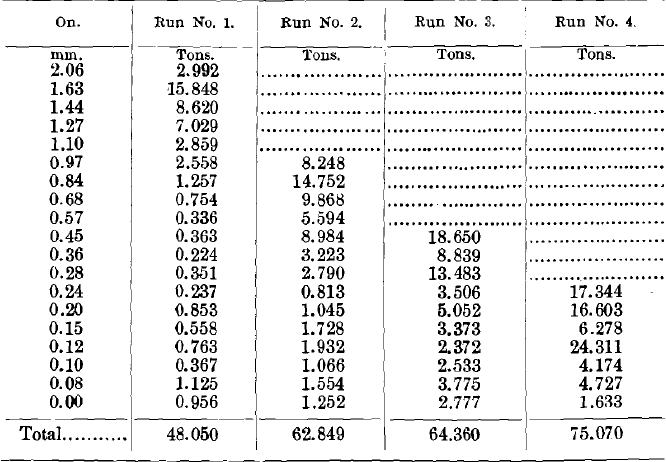
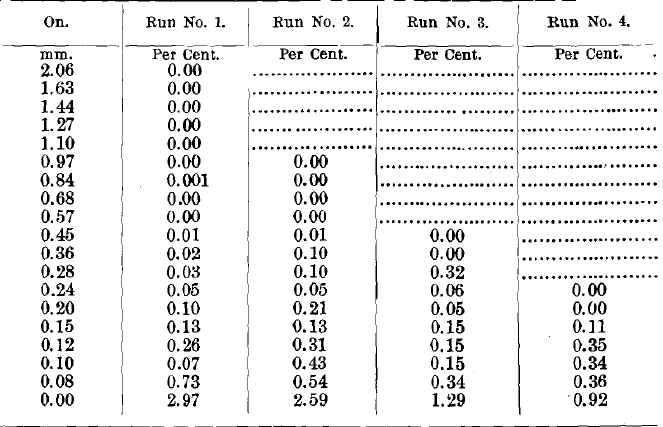
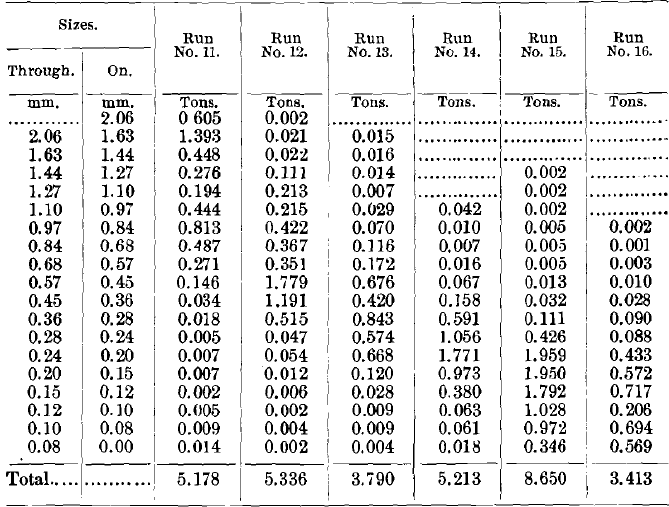
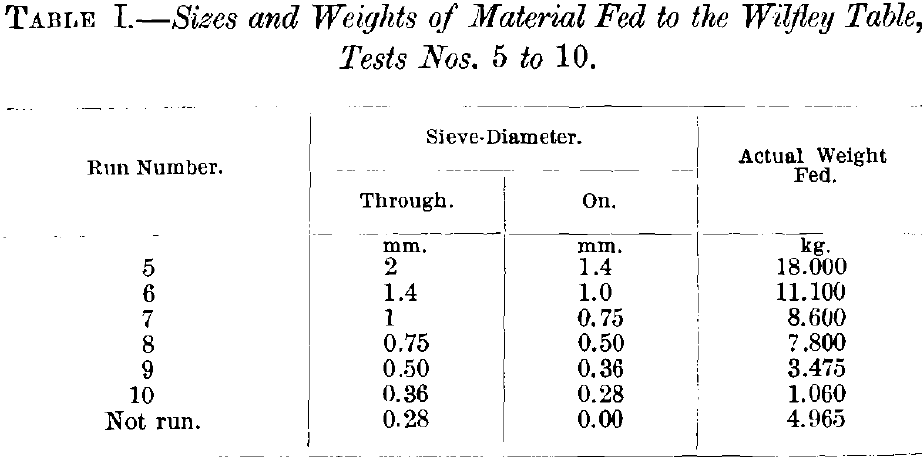
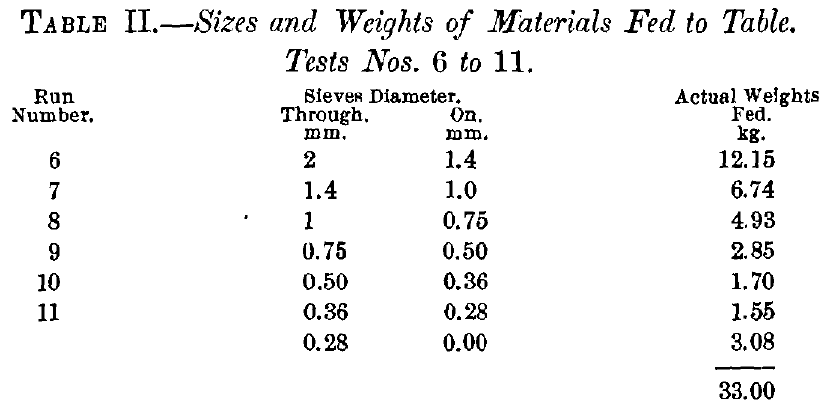
The materials for this test were pure white massive quartz for the light mineral, and crystalline galena, nearly free from blende and other impurities, from Joplin, Mo., for the heavy mineral. The quantities of these impurities were so small as to have little effect on the results. Both minerals were broken down to 2-mm. size, and mixed so as to have approximately 10 percent, of galena and 90 percent, of quartz.

Usual Division of Products on a Wilfley Table

The Wilfley table used for the tests had a net working surface of 2 ft. by 4 ft. This is the table that has been found very satisfactory for students’ work at the Massachusetts Institute of Technology. An error is present to a slight extent in the full-sized table, 16 ft. long by 7 ft. wide, and to a serious extent in the small Wilfley testing table, 7 ft. long, found in some of the schools. It is due to tacking tapered riffle-cleats onto a linoleum plane surface, thereby making two planes: first, the roughing- plane over the riffle-cleats, E, Fig. 1; second, the cleaning-plane or part where there are no riffles, F, Fig. 1. These two planes make an angle with each other, or a slight trough, which heaps up the sands deeper than is wise along the line of the tips of the riffle-cleats. This error is completely overcome on the little table here used by cutting the riffles down into the wooden surface of the table. The roughing- and cleaning-planes are therefore one and the same plane. By observing this precaution I believe that this little table is able to do as good work as the full-sized table.

Comparing the little table with the full-sized table as to areas and capacity, assuming that their capacities are proportional to their areas, we have Table I.

Table 1

These figures represent the usual range used in practice. Seventeen runs in all were made; Nos. 1 to 5, inclusive, were made upon natural products, the several feed-products being 2 mm. to 0; 1 mm. to 0; 0.5 mm. to 0; 0.25 mm. to 0; and 2 mm. to 0. Run No. 5, although fed with the same size as No. 1, was fed at a different rate. In making these runs no effort was made to re-run the middlings; first, because the concentrates and tailings would both have been contaminated and would not have shown as well; second, because the middlings themselves would have undergone a change in composition. As a consequence of this ruling, the quantities of middlings appear abnormally large.

In these runs, the dividing line between concentrates and middlings was chosen so as to make concentrates nearly clean to the eye. The dividing line between middlings and tailings was chosen so as to keep all the large grains of heavy mineral in the middlings. The four products—concentrates, middlings, tailings, and slimes—were sized on a series of sieves, and the quartz in them determined by dissolving out the galena in hy­drochloric acid. The galena was determined by difference.
Runs Nos. 6 to 11, inclusive, were all upon sized products, and the results obtained are given in Table II.

Sizes and Weights of Materials fed

The total quantity weighed 33 kg., of which 30 kg. was quartz and 3 kg. was galena. The guiding was done simply to make clean concentrates and tailings. The middlings was in every case re-run until they could not be further reduced without contaminating the concentrates or the tailings. Where a sized ore is free from included grains and from any middle­weight mineral, the feeding-back of the middlings on the same table is logically good practice, because the middlings product is simply a mixture of concentrates and tailings; therefore, they could be fed back on the same table and disappear entirely without harm to concentrates or tailings.

Runs Nos. 12 to 17, inclusive, were made upon sorted or classified products. The classifier, Fig. 2, had 12 closed spigots or blind spigots; that is to say, spigots that discharged sand into 2-gallon bottles as fast as it came but discharged no water. The sorting columns were of 0.5-in. pipe, squared at the top and 3 in. long. Expressed in mm. per second, the rising-currents in the successive sorting-columns were: 105, 85, 69, 55, 45, 36, 29, 23, 19, 15, 12, 10, respectively. The 13th spigot had no rising current, and it was simply a safety spigot to prevent any accumulation of sand that was too light to go down in the 12th and too heavy to go over into the overflow. This apparatus gives a set of products beautifully classified.

To define the classified products more completely, a small aliquot part of each was sized, photographed, and analyzed. The photograph, Fig. 3, shows to the eye the distribution of sizes in each spigot. Table III. shows the distribution of quartz and galena in the different sizes of each spigot. Expressed in mm., the sieve-sizes used were: 2.83, 2.49, 2.06,1.63, 1.44,1.27,1.10, 0.97, 0.84, 0.68, 0.57, 0.45, 0.36, 0.28, 0.24, 0.20,0.15,0.12,0.10,0.08. The middlings picked out and weighed for the first four spigots consisted of blende-galena included

Classifiers Used for Nos. 12-17

grains, with some free blende-grains. Their use here is simply to show how nearly pure the galena was. The settling-ratios are of special interest; for example, at the foot of spigot No. 4 we have the settling-ratio, 3.26, which signifies that in spigot No. 4 the average diameter of the quartz-grains is 3.26 times the average diameter of the galena-grains. The method of computing these ratios is given in my paper, Close Sizing Be­fore Jigging. It was thought wiser to combine the spigots

Distribution of Quartz and Galena

Distribution of Quartz and Galena

somewhat instead of making 12 separate runs; accordingly, the 6 runs were fed with products as follows; 1st spigot; 2nd spigot; 3rd and 4th together; 5th and 6th together; 7th, 8th, and 9th together; 10th, 11th, and 12th together.

Distribution of Sizes

The first 5 runs on natural products computed on the basis of a 100-ton lot, and to the rate of feeding of a full-sized table, gave products shown in Table IV.

Results of Runs Nos. 1 to 5

The next 6 runs on sized products, computed on the basis of a 100-ton lot, and to the rate of feeding of a full-sized table, gave products shown in Table V.

Results of Runs Nos. 6 to 11

The last 6 runs, computed on the basis of 100-ton lots, and to the rate of feeding of a full-sized table, gave products shown in Table VI.

Results of Runs Nos. 12 to 17

Comparing the 17 runs as to the quantity of the products with­out looking at the quality, it will be noticed at once that the concentrates and tailings in runs Nos. 6 to 11 and Nos. 12 to 17 are very much larger in quantity than these products in runs Nos. 1 to 5; while the middlings is very much smaller in quantity.

A comprehensive table of all 17 runs is given in Table VII., which shows the proportions of concentrates, middlings, tail­ings and slimes in each, and also the percentage of galena and quartz in the various products.

Tables VIII., IX., X. and XI. give the weights in tons of the different sizes, and also the proportion of quartz and galena in each product by sizes.

In comparing the analyses of the concentrates of these five runs (Table VIII.), we see a very remarkable similarity in the behavior of the quartz and galena through all five runs. The coarser sizes and the finer sizes are almost clean galena, being nearly free from quartz. At a point somewhere a little below the middle, the quartz rises to a maximum, which in the first run reaches 18.99 percent, of quartz, in the third run reaches 7.38 percent, of quartz, and in the fifth run reaches 13.80 percent, of quartz.

Comparing the different analyses of the middlings (Table IX.), we find the galena among the very largest and smallest grains gives a very high percentage, and down to a little below the middle, the galena runs down to a very low percentage, while the quartz behaves just in the opposite way. This is analogous to the composition of the concentrates.

Comparing the tailings of the five runs (Table X.), we note that the galena appears only to a very slight degree in any of the tailings until we get down to the smaller sizes, and there we have figures that rise to an almost alarming size, the first run giving 17.5 percent, of galena in the finest size; the 2d, 17.8 percent.; the 5th run giving 12.17 percent, in the finest size.

The slimes (Table XI.), which have a serious quantity of material only in the finest size, have also a serious percentage of lead in that finest size. The other percentages of lead are gener­ally much smaller. There are three exceptions, in the 2d, 3d, and 4th runs, where the percentages run high in the larger

Summary

Proportion of Quartz and Galena

Analyses the above products giving the percentage of galena (PbS) and quartz (SiO2)

Proportion of Quartz and Galena

Proportion of Quartz and Galena

Analyses the above products giving the percentage of galena (PbS) and quartz (SiO2).

Proportion of Quartz and Galena

Proportion of Quartz and Galena

Analyses the above products giving a percentage of galena (PbS) and quartz (SiO2).

Proportion of Quartz and Galena (Analysis)

Proportion of Quartz and Galena

Analyses the above products giving a percentage of galena (PbS) and quartz (SiO2).

Proportion of Quartz and Galena (Analysis)

sizes, but the quantity is so small that these losses are insignificant.

Proportion of Quartz and Galena

Analyses the above products giving a percentage of galena (PbS) and quartz (SiO2).

Proportion of Quartz and Galena (Analysis)

Commenting upon runs Nos. 6 to 11 (Table XII.), as com­pared with runs Nos. 1 to 5, we note immediately that the concentrates all the way through are almost pure galena with scarcely any quartz, and the tailings are almost pure quartz and scarcely any galena. The middlings, as remarked before, are so small in quantity that they affect the runs but little, and when we consider that they can go directly back onto the table in the continuous run, they do not affect the result at all. This set of runs, Nos. 6 to 11, therefore appears to distance runs Nos. 1 to 5 in the competition. There is really no comparison since runs Nos. 1 to 5 are not in the same class with them.

Results of Runs Nos. 6 to 11

Analyses the above products giving a percentage of galena (PbS) and quartz (SiO2).

Analyse

Comparing the concentrates of runs Nos. 12 to 17 (Table XIII), we see in the first place an enormous heaping-up of concentrates in run No. 12. The weight, 49 tons, is more than double the weight of all the other live runs in this set put together. This heaping-up of the great number of concentrates on the table which treats the first spigot of a classifier is one of the prominent features of the use of a classifier in prep­aration for feeding Wilfley tables. If we look at the total percentage of galena and quartz in the concentrates of run No. 12 we see that they contain 99.26 percent, of galena and 0.74 percent, of quartz. This makes an extremely good showing and one that bids for favorable consideration of the classifier set.

Looking at the water spigots, that is to say, runs Nos. 13 to 17, inclusive, in the analyses, we see that the percentage of quartz looks high in the coarser sizes. This would seem a serious disadvantage if it were not for the fact that these products which have high percentages of quartz are so small in quantity that the quartz cuts scarcely any figure in the final percentage of quartz in the concentrates. Altogether this set

Table XIII.- Results of Runs Nos. 12 to 17 Computed to Full Size.

Note.- The concentrates have been sized and weighed and the weights computed in tons and fractions thereof on a 100-ton basis.

Results of Runs Nos. 12 to 17

Analyses the above products giving a percentage of galena (PbS) and quartz (SiO2).

Analyse

Table XIV.- Results of Runs Nos. 12 to 17 Computed to Full Size.

Note.- The middlings have been sized and weighed and the weights computed in tons and fractions thereof on the 100-ton basis.

Results of Runs Nos. 12 to 17

Analyses the above products giving a percentage of galena (PbS) and quartz (SiO2).

Analyse

of concentrates is so good that it would be accepted by any mill, even the Missouri mills, where such clean concentration is required.

Looking at the middlings (Table XIV.), we see that the quantity is extremely small, and can be made to disappear in a continuous run by feeding them back onto the table without harming either the concentrates or the tailings. They have, however, some very interesting features that are worthy of note. The galena in the 12th run runs high in the coarse and in the fine and very low in the middle sizes, there being a great heaping-up of quartz in this part. This same point is true in the 16th and 17th runs to a very marked degree. It is again true to a less marked degree in the 14th and 15th runs, and it appears not to be true at all in the 13th run.

Looking at the tailings (Table XV.), we see that run No. 12 stands out pre-eminent, having only 0.29 percent, of galena in the whole tailings, and the tailings of runs Nos. 13 to 17 are very low in galena, and would probably pass in any concentrating establishment.

We have one feature here which does not and cannot happen in sized runs, Nos. 6 to 11—viz., the tailings get richer in galena down to the finer sizes; but when we look at the ton­nage we find that there is scarcely any weight of material down in those sizes, and therefore this loss is not serious and does not bring up the percentage of galena in the final tailings to a serious extent.

Fig. 4 is an ideal sketch of what happens at the discharging corner of a Wilfley table. Running from coarse on the lower edge to fine on the upper, A, B, C, D, F, F, G, and H repre­sent the different sizes of galena. It appears that they arrange themselves approximately according to this order on the Wil­fley table. In like manner, the quartz-grains arrange themselves approximately in order of size, beginning at the lower edge with the largest grade and running smaller and smaller upwards, as indicated by the letters I, J, K, L, M, N, O, and P. The slimes at once take off the galena (H), and the quartz (P). These finest of all grains have not sufficient weight to hold them up to the upper edge, where mathematical logic would place them. They, therefore, go into the slimes. The. next grade, G (galena), and O (quartz), are not fine enough to

Table XV.- Results of Runs Nos. 12 to 17 Computed to Full Size.

Note.- The tailings have been sized and weighed and the weights computed in tons and fractions thereof on the 100-ton basis.

Results of Runs Nos. 12 to 17

Analyses the above products giving a percentage of galena (PbS) and quartz (SiO2).

Analyse

go into the slimes nor coarse enough to stand up against the water-current in the position shown in the sketch. These grains are found, therefore, sprinkled through the concentrates, middling, and tailings. See the heaping-up of galena in the small sizes in Tables VIII., IX., and X.

Having laid out our argument in this way, it now remains for us to compare by means of this diagram runs Nos. 1 to 5,

Arrangement of Grains

6 to 11, and 12 to 17, and to see why it is that runs Nos. 6 to 11 and Nos. 12 to 17 are so much better than runs Nos. 1 to 5. Runs Nos. 1 to 5 take the products just as they are shown in Rig. 4 and give galena, C, D, E, F, in the concentrates contaminated by quartz, (N). See the heaping-up of the quartz a little below the middle size in Table VIII., and the middlings that gives quartz, K, L, and M, contaminated by galena, A, B, C, and G. See the heaping-up of galena among the large grains and among the small grains in Table IX., and the tailings have in them the quartz, I, J, and 0, contaminated by galena, G. See the heaping-up of galena in the fine sizes in Table X. Runs Nos. 6 to 11, on the other hand, have put together on the coarse table, quartz, I, and galena, A, which have nothing whatever to do with one another (see Table XII.), and therefore make almost 100 percent, of galena in the concentrates, and almost 100 percent, of quartz in the tailings. The little accidental middling-product, simply being the dividing line between the two products, goes back on the table and disappears. On the second table, we treat quartz, J, and galena, B, with the same result. On the third table, we treat quartz, K, and galena, C, with the same result. On the fourth table quartz, L, and galena, D; on the fifth table quartz, M, and galena, E; on the sixth table quartz, N, and galena, F. There seems no reason logically why these should not turn out 100 percent, of galena in the concentrates and 100 percent, of quartz in the tailings. The probable reason why we did not obtain those figures was that the accidental flat scales and the fine abrasions of galena went where they should not.

Going to the third set of runs, Nos. 12 to 17, we need to bring in an ideal picture of the products of a classifier by means of Fig. 5. Suppose, for example, that we drop into a tall tube of water grains of quartz ranging from our maximum size down to zero, and grains of galena in the same way, and that these grains are of approximately the same shape, then the rate of settling of these grains may be stated in the following terms: the larger grains of a single mineral will settle faster than the smaller grains; and when we compare the two gravities of quartz and galena, the higher gravity will settle faster than the lower gravity for the same size. So definite is this law that if we look for equal-settling particles, we shall find that the grain of quartz which is equal-settling with the grain of galena is about 8 or 4 times the diameter of the grain of galena. See settling ratios in Table III. “We may, therefore, construct the ideal diagram, Fig. 5, and we can draw a set of horizontal lines across it, putting the equal-settling grains together, ranging from the heavier grains of the first spigot in the lower part of the diagram up to the lighter grains of the finer spigot at the upper part of the diagram. We see then that spigot 1 contains a large amount of galena ranging from the coarsest size down to one-quarter the diameter of the coarsest quartz, and that the quartz is almost all in the coarse sizes. See spigot 1, Table III. This is exactly what we found in our run Xo. 12. See the heaping-up of galena in the large sizes in Table XIII.

Classifiers Products

Spigot 2 has small galena and large quartz, but both are a little smaller than those in spigot 1. Spigot 3, again, has small galena and larger quartz, but a little smaller than spigot 2, and so on up the scale with spigot 4, spigot 5, and spigot 6. See the heaping-up of galena in smaller sizes, Table XIII., and of quartz in larger sizes in Table XV.

Looking at our diagram, Fig. 5, to see what will happen when these several spigots are put upon the table, we shall find that run No. 12 receives galena, A, B, C, D, E, F, and F and quartz, I. Logically these have nothing to do with one another, and therefore should make for perfect separation. Spigot 2 fed in run No. 18 would have quartz, J, and galena, F2. Spigot 3 would have quartz, K, and galena, F3, and so on. Spigots 4, 5, and 6 could work their way up, having quartz always larger, and therefore belonging at a lower place on the table, and galena of smaller diameter belonging at a higher place on the table, making for clean separation of concentrates and tailings, with a middling product that can go directly back on the table and disappear. In proof of this, see points of heaping-up of galena and quartz in Tables XIII. and XV.

In the light of Fig. 4, comparing runs 12 to 17 with runs 6 to 11 we see that the natural lines for quartz and galena are farther apart for the classified products than for the sized pro­ducts. For example, in run 12 the galena lines A to F average farther from the quartz I than does the galena A of run 6. Again, in run 13 the galena F is farther from quartz J than is the galena B from quartz, J in run 7. In like manner we may compare classified runs 14, 15, 16, and 17 with sized runs 8, 9, 10, and 11.

This demonstrates that with perfect classification the work will be better done on the Wilfley table than with sizing, and it also shows that with much middleweight mineral or in­cluded grains a good classifier will probably be more efficient than screens.

Conclusions:

The natural product as feed for a Wilfley table is com­pletely outclassed and surpassed by sized-product feed and by classifier-product feed.

While the sized-product feed, as shown in Table VII., ap­pears to have done better work than the classifier-product feed, if we give full weight to the great performance of run No. 12, we can agree that this has fully offset the slight falling- off of runs Nos. 13 to 17, and that the classifier-feed work is fully up to the sized-feed work on the Wilfley table, and with a perfect classifier the work will be better done than with screens.

The above paper, dealt with the behavior of a small “Wilfley table when concentrating galena from quartz, the table being fed with natural products, with sized products, and with classified products. Since galena, having a specific gravity of 7.5, is among the heaviest minerals ordinarily concentrated by Wilfley table, it was desirable that a similar set of tests upon a mineral of lighter weight should be made. Chalcopyrite, of specific gravity of 4, would have been the best mineral for this purpose, on account of its great importance as an economic mineral, but in carrying out the test I was obliged to content myself with cupriferous pyrite, the specific gravity of which was 4.68 and the content in copper 8.80 percent. Through the kindness of H. o. Cummins, this material was obtained from Shasta, Cal. in a very pure, clean, homogeneous condition. It was broken by rolls to 2 mm. in size, taking care to make a minimum of slimes. The quartz used to mix with it was pure, white, New England quartz, broken in the same way to the same size.

In studying the accompanying tables, it should be borne in mind that the material concentrated was of low copper content, and in many cases, the quantity fed to the machine was 1 kg. or less. As a consequence of the smallness of the quantity treated it was very difficult to adjust the table and get it in condition to do its best work before the feed became exhausted, and for this reason, many results were obtained which appear irregular.

The material concentrated on the Wilfley table was a mix­ture of quartz and cupriferous pyrite; 16 test-runs were made. Runs Nos. 1 to 4 were on natural products of the following sizes: 2 mm. to 0,1 mm. to 0, 0.5 mm. to 0, and 0.25 mm. to 0, respectively. Runs Nos. 5 to 10 were on sized products.

Table I. gives the sizes and actual weights of material fed to the Wilfley table.

Sizes and Weights of material fed to the Wilfley Table

The total weight of 55 kg. given in Table I. was made up of 50 kg. of quartz and 5 kg. of pyrite.

Tests 11 to 16 were on classified products. For rising currents, see my first paper on the Wilfley Table. The classifier there described was used.

Results of Tests No. 1 to 4

Results of Tests No. 5 to 10

Results of Tests No. 11 to 16

A comparison of the results of a sized and classified feed with those of an unsized product (natural feed) is of interest. Table V. shows that both sized feed and classified feed give better results than natural feed in the percentage of copper which is easily and quickly saved in the concentrates. Furthermore, the tailings from the sized product are decidedly better than those from the classified product, although the latter does not carry a large percentage of the copper, and the tailings from both of these classes are better than those from the natural feed.

Summary Results of Tests No. 1 to 16

Table VI – Results of Tests Nos. 1 to 4 (Concentrates)

Concentrates sized and weighed. The weights are computed in tons and fractions of a ton on a 100-ton basis.

Results of Tests No. 1 to 4 (Concentrates)

Analyses of the above products giving a percentage of copper.

Results of Tests No. 1 to 4 (Concentrates)

Table VII. – Results of Tests Nos. 1 to 4 (Middlings)

Middlings sized and weighed. The weights computed in tons and fractions of a ton on a 100-ton basis.

Results of Tests No. 1 to 4 (Middlings)

Analyses of the above products giving percentages of copper.

Results of Tests No. 1 to 4 (Middlings)

Table VIII. – Results of Tests Nos. 1 to 4 (Tailings).

Tailings sized and weighed. The weights computed in tons and fractions of a ton on a 100-ton basis.

Results of Tests No. 1 to 4 (Tailings)

Analyses of the above products giving percentages of copper.

Results of Tests No. 1 to 4 (Tailings)

Table IX. – Results of Tests Nos. 1 to 4 (Slimes).

Slimes sized and weighed. The weights computed in tons and fractions of a ton on a 100-ton basis.

Results of Tests No. 1 to 4 (slimes)

Analyses of the above products giving percentages of copper.

Results of Tests No. 1 to 4 (slimes)

Table X. – Results of Tests Nos. 5 to 10 (Products).

Weights computed in tons and parts of a ton on a 100-ton basis.Results of Tests No. 5 to 10 (Products)

Analyses of the above products giving percentages of copper.Results of Tests No. 5 to 10 (Products)

Table XI. – Results of Tests Nos. 11 to 16 (Concentrates).

Concentrates sized and weighed. The weights computed in tons and fractions of a ton on a 100-ton basis.

Results of Tests Nos. 11 to 16 (Concentrates)

Analyses of the above products giving percentages of copper.

Results of Tests Nos. 11 to 16 (Concentrates)

Table XII. – Results of Tests Nos. 11 to 16 (Middlings).

Middlings sized and weighed. The weights computed in tons and fractions of a ton on a 100-ton basis.

Results of Tests Nos. 11 to 16 (Middlings).

Analyses of the above products giving percentages of copper.Results of Tests Nos. 11 to 16 (Middlings).

Table XII. – Results of Tests Nos. 11 to 16 (Tailings).

Tailings sized and weighed. The weights computed in tons and fractions of a ton on a 100-ton basis.

Results of Tests Nos. 11 to 16 (Tailings).

Analyses of the above products giving percentages of copper.

Results of Tests Nos. 11 to 16 (Tailings).

A comparison of Tables VIII. and XIII. shows that the percentage of values increases in the fine sizes of the natural-feed tailings and in the classifier-feed tailings just as it did in the tests with galena, but since the natural-feed tailings have tons of products, while the classifier tailings have only a few pounds, the classifier again is more satisfactory than the natural feed.

From these two tests on typical minerals, galena, and cupriferous pyrite, we may generalize as follows:

An ideal sketch of the arrangement of the grains by a Wilfley table is given in Fig. 1, which is a reproduction of

Ideal Sketch

Fig. 4 of my first paper. This sketch shows that sizing by sieves would send together to the first table, grains, J, quartz, and heavy mineral, A ; to the second table, grains, J, quartz, and heavy mineral, B, and so on. On the other hand, the perfect classifier would put together for the first table perhaps grains, I, quartz, and heavy mineral, A, B, C; for the second table, grains, J, quartz, and heavy mineral, D, and so on. The first table of the classifier set will then have no more difficult separation to make than the first table of the sized set, because the grains, I, and A, have their natural tendency to be the same distance apart in both cases. On the other hand, on the finer tables we see that the sized feed puts together grains, J, quartz, and heavy mineral, B, while the classified feed puts together grains, J, quartz, and heavy mineral, D. The natural distance apart of the two minerals, then, is much greater in the case of the classified feed than in the case of the sized feed. There remains only to design classifiers sufficiently perfect to realize this natural advantage of classified feed oversized feed as applied to the “Wilfley table.

The Wilfley Table I and II, by ROBERT H. RICHARDS, BOSTON, MASS.

You may also like…

I Need Assistance