
Table of Contents
Conventional underground mining involves the excavation and transportation of ore to the surface for processing. Tonnes of solid material is extracted from underground mining systems to produce kilograms, and sometimes only grams, of final product. Surficial processing of ore results in the disposal of most of the excavated material on the surface, with the material being exposed to long-term degradation from wind and water.
The U.S. Bureau of Mines currently has a research initiative for in situ recovery of minerals. As a part of this initiative, research in “Stope Leaching” is being conducted to modify conventional mining practices by significantly reducing the amount of material brought to the surface.
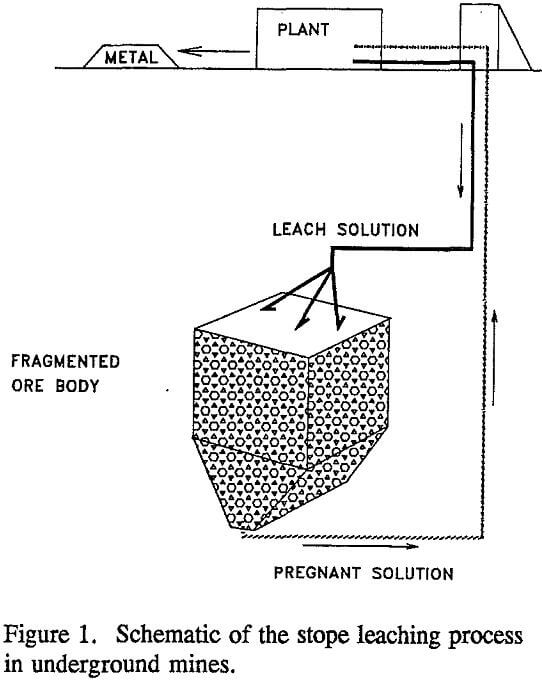
The underground stope leaching mining system involves recovering low-grade reserves by applying environmentally acceptable leach solutions to fragmented mineralized rock that has been blasted in place, or backfilled into empty stopes. If blasted, only enough material is removed from the underground mining area (stope) to allow for adequate expansion during the blasting, reducing the amount of material brought to the surface by at least two-thirds. After blasting, leach solutions containing chemical solvents and/or bacteria are circulated through the fragmented ore to dissolve the target mineral (fig. 1). The resulting mineral-rich solution (pregnant leach solution) is pumped to the surface where the product is removed, and the leach solution is regenerated for recycling underground.
Successful implementation of stope leaching in an underground mine requires effective solution management. Successful solution management requires the containment of leach solutions within the leaching stope and the limitation of external solution flow into the stope. Loss of leach solutions to the surrounding rock mass has environmental and economic implications. Loss of pregnant leach solution results in lost revenue from costs incurred with no product gained. Leaching solution lost to the rock mass may also degrade adjacent ground water quality. Also, water flowing into a
leaching stope can sufficiently dilute the leaching solution to reduce mineral dissolution in the stope and make recovery of the dissolved mineral unattainable at the processing facility.
Characterization of the rock mass prior to leaching is critical to successful solution management. Detailed rock mass characterization, conducted prior to leaching, locates zones of high permeability that could require sealing before leach solutions are introduced to the stope. USBM researchers have tested and compared rock mass characterization methods utilizing geologic mapping, geophysical techniques, and hydrologic procedures at an underground test facility in the Edgar Mine (an experimental mine in Idaho Springs, CO), which is owned and operated by the Colorado School of Mines (CSM). Hydrologic procedures, including packer tests, were conducted before and after stope excavation. Several tracer tests, using NaCl, were conducted in the underground test stope to simulate solution movement during leaching. Tracer test procedures and preliminary results are presented in this paper.
Test Site Description
The project site is located at the Edgar Mine (in Sec. 26 and 35, T. 35 N., R. 73 W.), approximately 0.4 kilometer north of Idaho Springs, Colorado. Hydrologic testing was conducted at an underground stope site located approximately 300 m from the Miami Tunnel portal of the mine at an approximate elevation of 2,400 m above sea level. Vertical cover from the test facility to the land surface is approximately 180 m.
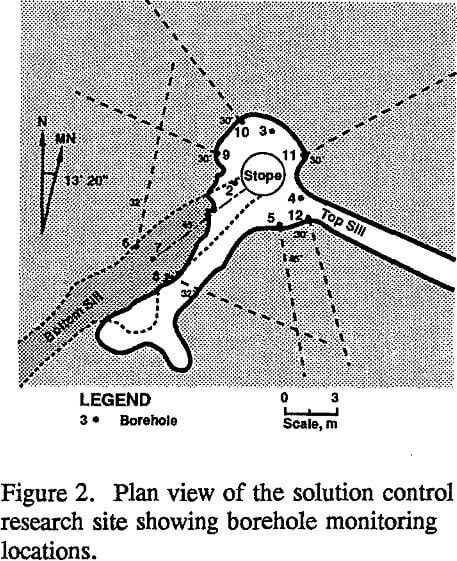
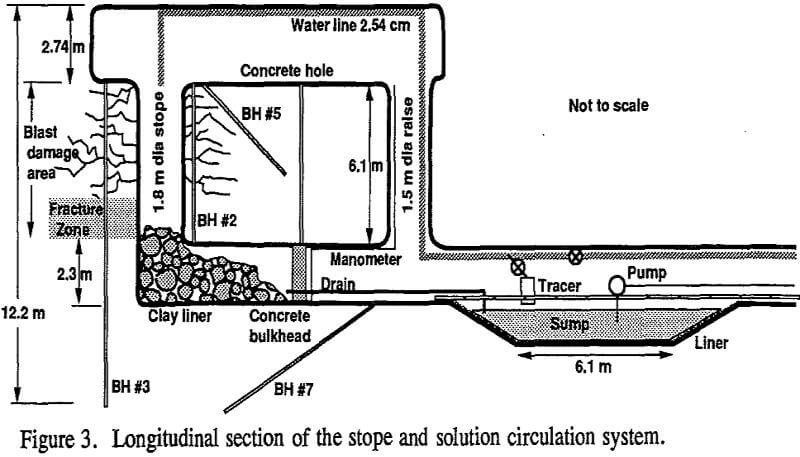
The test facility was constructed by extracting rock from a stope using a blasting technique designed to maximize ore fragmentation while minimizing damage to the wall rock. The stope was excavated between the extension of an existing lower drift and an upper chamber. Total height of the stope is 8.2 m, including the drift. The rock excavated between the lower drift and the upper chamber (5.8 m) was blasted in a circular configuration with a nominal diameter of 1.8 m (fig 2.). Boreholes (7.62 cm and 10.16 cm diam) were drilled at intervals beneath and around the outside perimeter of the stope for core sampling and characterization of the rock mass. These boreholes then became monitoring locations during the tracer tests (figs. 2 and 3).
A reinforced concrete bulkhead was constructed in the bottom access drift to contain water in the stope (fig. 3). The concrete (35.6 cm thick) was reinforced with two mats of no. 6 reinforcing steel on 30.5-cm vertical and 50.8-cm horizontal centers.
Test Site Geology
The Edgar Mine is located within the Colorado Front Range, a geological region that has been affected by seven structural events dating back 1.75 billion years (Hutchinson, 1983). The predominate rock types in the area are Precambrian metamorphosed sedimentary rocks of the Idaho Springs Formation, metamorphosed igneous rocks, and igneous rocks. Predominate rock types at the test site include banded quartz biotite gneiss, granitic pegmatite, and biotite hornblende schist. Gangue minerals include biotite, quartz, feldspars, hornblende, chlorite, and pyrite. Clay occurs in fault gouge zones or zones of high alteration. The presence of iron oxidation in some fracture surfaces indicates the occurrence of past movement of fluids (Speirer and Miller, 1992).
Rock Mass Characterization
Rock surrounding the leaching stope will be used for the walls of the leaching vessel which will contain both the fragmented ore and the leach solutions. Characterizing the rock prior to leaching is essential for locating fractures, faults, and other potential zones of solution migration. Rock characterization research at the Edgar Mine was focused on the block of rock between the upper and lower levels of the underground test stope (fig. 3).
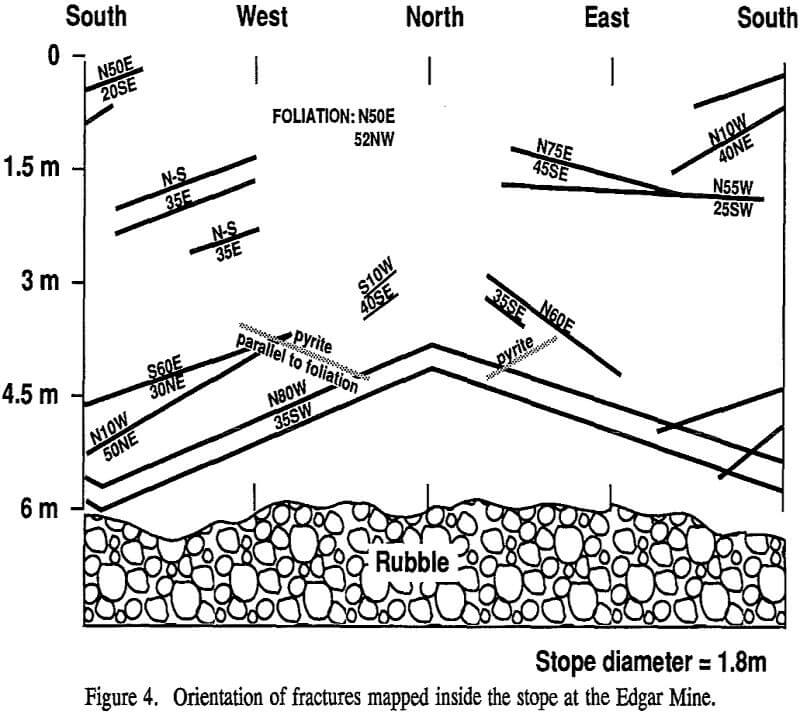
Research at the Edgar Mine test site investigated the hydrogeologic processes involved in solution loss and the effectiveness of different techniques for characterizing these processes. Rock mass characterization was conducted in three phases: pre-blast rock characterization, post-blast rock characterization, and hydrologic prediction. Rock mass characterization of the stope was facilitated by logging core for fractures from the holes drilled for stope blasting and from eight borehole monitoring wells drilled beyond the outside perimeter of the stope (fig. 2). Figure 4 shows the orientation of fractures mapped inside the stope after blasting occurred.
Hydrology
Groundwater present in the Idaho Springs area is primarily found in fractures of igneous and metamorphic rock. Effective porosities of the regional rock has been measured to range from 1×10-² to 1×10-³ percent (INTERA, 1983). Effective porosities in similar crystalline rocks in the region range from 1×10-¹ to 4 x 10 -5 percent for depths of 20 m and 2×10-¹ to 4 x 10 -8 percent for depths of 50 to 200 m (Snow, 1968b and 1969). The hydraulic conductivity of the rocks found in the Edgar Mine has ranged from 9.9 x 10 -10 cm/s to 9.9 x 10-² cm/s (Montazer, 1982). Snow (1968b) found regional hydraulic conductivities of the rocks in similar rocks to range between 3.53 x 10 -6 cm/s to just over 3.53 x 10 -4 cm/s. The water slug tests performed for this study found that the average hydraulic conductivity for wall rock to range between 1 x 10 -5 cm/s to 4.1 x 10-³ cm/s (Miller, 1993).
Fractured aquifers in the area have been estimated to be between 61 and 107 m in depth (Snow, 1968a; Florquist, 1973). Because the permeability of these water bearing fracture zones decreases with depth, it is believed that greater than 90 percent of the Idaho Springs aquifer permeability is within 24 m of the surface (Camp Dresser and McKee, Inc., 1988). The water table of this aquifer rises and falls considerably with climatic variations. The regional water table in this aquifer is located between 46 and 61 m below the ground surface (Moench and Drake, 1966) and between 15 and 53 m where the topography is gently sloping (Camp Dresser and McKee, Inc., 1989). However, the regional water table has been artificially lowered within the past 100 years due to mine workings that provide deep drainage.
Due to the excavation of the Big Five Tunnel in the early 1900’s for drainage and ore haulage purposes at a lower elevation, the Edgar Mine was dewatered. As a result, most of the rock mass in the mine is unsaturated; however, there are fractures that transport water through the mine.
Locally, the hydraulic gradient seems to be controlled by the regional structural geology and vein structure, rather than the topography. Wells on the Edgar property, which were installed by the U.S. Army Corps of Engineers, show that the piezometric surface in the wells parallels the majority of the attitudes of joints, measured adjacent to the wells (Cameron, 1987). From the structural data collected at the mine, the direction of the hydraulic gradient was estimated to be N6°W. This direction not detectable at the experiment site because of the relatively small scale of the site. Water levels have been monitored in the boreholes surrounding the stope for 4 years. Water levels vary in these boreholes from 0 to several tens of centimeters. There is no pattern that shows a definite hydraulic gradient. There also is no water level trend associated with precipitation events. This may be due to the fact that flow in the rock mass is primarily controlled by a few fractures, and that these fractures do not have a high connectivity.
Geologic and hydrologic data were coupled with modeling to evaluate the migration of a leaching solution plume. PLUME (In Situ, Inc., 1986), an analytical computer model based on a continuum fracture flow approach (de Josselin de Jong and Way, 1972) was thought to best support the geologic characteristics associated with the project, eventhough saturated conditions were assumed when using the model. The model predicted that an escaping lixiviant plume would travel in a westerly direction. The model results are acceptable up until the plume intercepted a fault or mineralized vein. These features would probably direct the plume in a northwesterly direction toward the Big Five Tunnel, since the tunnel was constructed to drain mines such as the Edgar.
Description of Tracer Tests
A Class 5, Safe Drinking Water Act, Underground Injection Control Program rule authorization was obtained from the Environmental Protection Agency, to inject NaCl and water into the prototype stope. Under the rule authorization, injected concentrations were not to exceed 7,000 ppm NaCl (equivalent to 12,600 microSiemens/cm (μS/cm)) solution.
To detect escaping tracer solutions from the stope, the stope and boreholes surrounding the stope were equipped with conductivity/temperature probes. Some of the boreholes and the stope were equipped with pressure transducers to obtain water level data. A programmable data logger recorded the changes in conductivity and water levels at the site.
A series of tracer tests were conducted under a natural, but varying, gradient to simulate and evaluate groundwater flow directions that might be present during actual leaching conditions. The stope was filled with tracer and allowed to drain, similar to flood leaching. Data was difficult to interpret because of a variable gradient caused by the falling head in the stope during the tests. Conductivity data obtained from the tests were used to determine tracer transport velocities through the rock mass, relative dispersion of the tracer, and location of fractures and fractured areas that conducted the tracer away from the stope keeping the variable gradient in mind. A center of mass of the tracer path could not be determined prior to monitoring borehole installation; therefore, it was not known if the center of mass would pass near the monitoring locations.
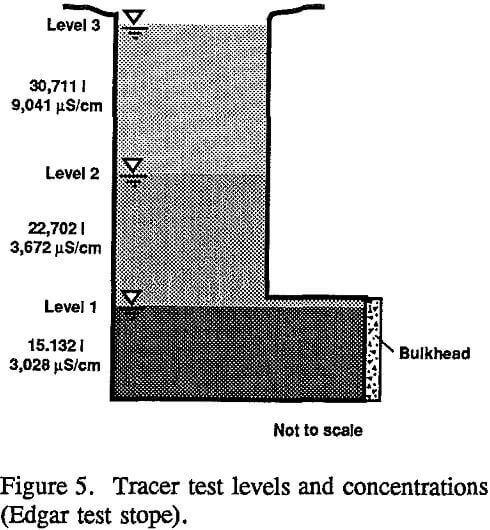
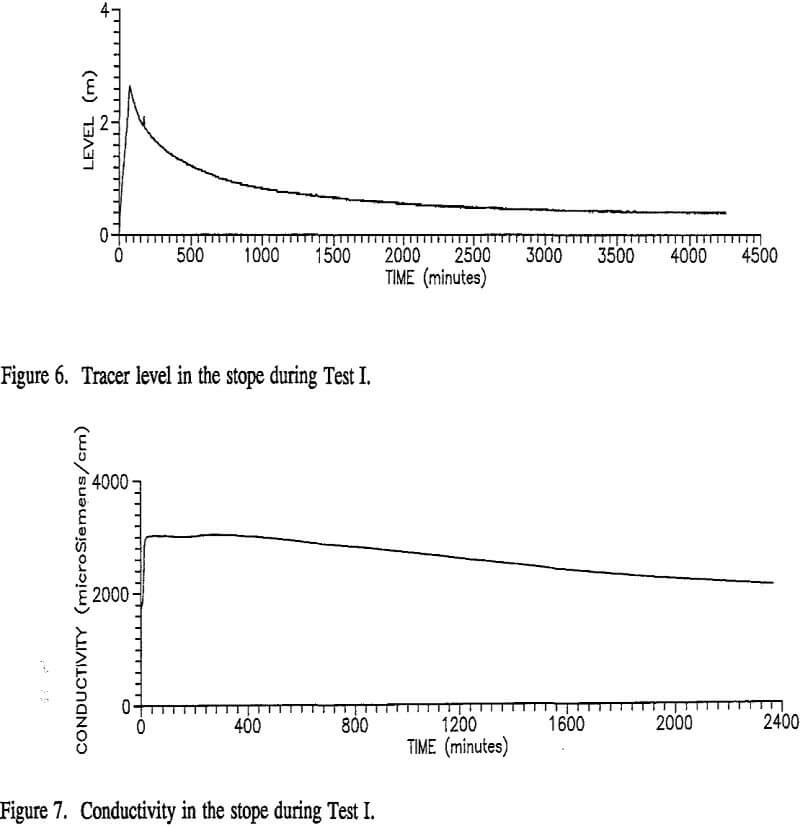
Three tracer tests were conducted over a period of 15 months in three steps/levels (fig.5). Each level exposed new fractures to the tracer solutions, and each test exposed fractures to a higher concentration of NaCl (fig. 5). In the first tracer test (Test I) a total of 15,132 L of 3,028 µS/cm solution of NaCl mixed with water was injected over a period of about an hour into the stope to a depth of 2.65 m (figs. 6 and 7). During the test, the concentration of the salt in the stope declined as the water level declined. This conductivity decline could have been due to some dilution either from natural groundwater water existing in adjacent fractures of the stope or water flow into the stope.
Several days after the stope was filled, a drip developed in fractures directly above the stope in the roof of the upper chamber during Test I. This drip could have developed due to capillary flow through very small, continuous fractures (maximum aperture of 7.35 x 10-³ mm) from the bottom of the stope to above the stope (Hillel, 1980). The dripping fluid was found to
have high concentrations of the chloride ion; therefore, this fluid was the injected tracer because the chloride ion was not found in the background water. After 2 to 3 days the dripping ceased, but a damp fracture surface above the stope has remained to date. The dripping resumed during the second test (Test II), but was not observed during the third test (Test III).
A new set of fractures located higher in the stope was introduced to 22,702 liters of the tracer solution in Test II. The concentration of the injected tracer in this test was measured to be 3,672 µS/cm. Because 7,570 additional liters of tracer were added to the stope in Test II, a greater pressure head was applied to the fractures exposed to the tracer in Test I. Therefore, fluid became exposed to smaller, tighter fractures.
The top third of the fractures in the stope were exposed to the tracer solutions in Test III. A total of 30,711 liters of tracer with a concentration of 9,041 µS/cm was injected into the stope.
After each test, the fractures were flushed at least once with fresh drinking water. The purpose of flushing the fractures was to dilute the salt solution within the fractures and to lower the background salt concentrations for the next test(s). These flushes were conducted in the same manner as the tracer tests by injecting water into the stope. Data were collected for each flush, but are not reported in this paper.
Tracer Observations
Tracer was observed in four boreholes, numbers 3, 4, 6, and 7, during the course of the three tests. The tracer was never detected in boreholes 5, 8, 9, 10, 11, and 12. Some explanations as to why the tracer never appeared in the boreholes include: these boreholes may have not been hydraulically connected by fractures or because of a falling head in the stope, the fluids were not given a chance to be driven toward the boreholes.
The first arrival times and peak conductivities near these first arrival times were used to estimate flow velocities rather than the longer times-to-peak in each of the detection boreholes (Kunkel, 1994). This is because the tracer conductivities did not readily decrease with time within the boreholes. This is likely due to mostly stagnant tracer in the borehole after tracer ceased flowing in because of the falling head in the stope.
Borehole 6
Borehole 6 was one of the two locations in the path of the tracer during the first tracer test. Tracer monitoring data also showed this borehole was in close proximity to the center of mass of the travel path of the tracer. This was the only outlying location where the tracer was detected in the first test (fig. 2). The direction of flow towards this borehole (west to northwest) coincides with predictions made by modeling flow at the site using fracture data (Miller, 1993). However, a constant gradient was assumed in running the models.
The first arrival of the tracer in borehole 6 was at 1,186 minutes, and the peak conductivity of 2,887 µS/cm was detected at 3,758 minutes (fig. 8 and Table 1). The concentration after the first arrival of tracer gradually rose in steps, but after a while the concentration dramatically increased to higher levels. This first arrival is probably due to partially saturated to saturated fractures carrying the tracer relatively quickly toward the borehole. The tracer concentration was also diluted be existing water in these fractures. The higher concentration jumps following the first arrival of the tracer can be explained by slower movement and/or a longer path to the borehole along unsaturated to partially saturated fractures. Hardly any dispersion or matrix diffusion of the tracer occurred since the injected concentration was 3,026 µS/cm. During Test II, tracer was still being detected in borehole 6.
Borehole 6 is inclined, drilled at 32 degrees from horizontal (fig. 2). Because of this, it is not known at which location along the borehole the tracer was intercepted. The borehole is located between 4.4 m and 10 m from the stope. The peak tracer travel velocity during the first test was calculated to be at least between 1 x 10-² cm/s and 2 x 10-² cm/s, assuming the tracer path was not tortuous.
During the next two tests, the travel time of the first arrival tracer decreased to 240 minutes for Test II and 194 minutes for Test III (figs. 9 and 10). However, the travel time for the peak concentration increased in each test, 44,958 minutes and 49,260 minutes, respectively (Table 1). It would seem that the travel times for peak arrivals should have decreased also in the consecutive tests; however, Tests II and III exposed new sets of fractures for the tracer to leave the stope. The first arrival time was shorter in the next two tests because the fractures had been wetted by Test I. The peak arrival time was longer in the next two tests because the tracer had traveled through other fractures in the fracture system to reach the detection point and/or the pathway was initially unsaturated. Because more liters of tracer solution was added to the stope, this greater pressure
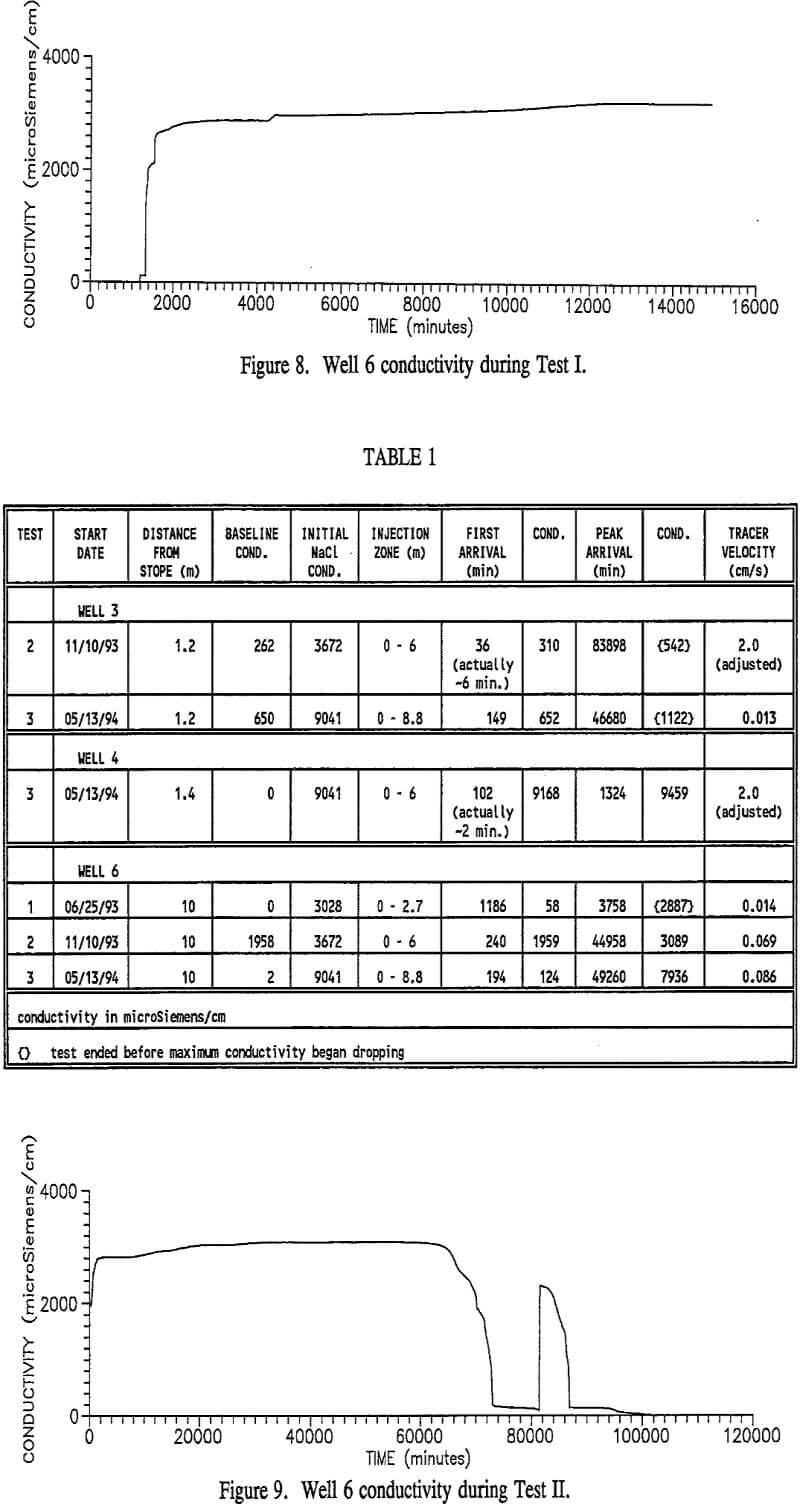
head could have forced the water through new pathways not used during Test I. Also the falling head in the stope could have had an affect on the tracer movement though the new fractures. The combination of these factors is probably the reason for the slower peak travel times in both cases.
Figure 9 shows that flow was interrupted to borehole 6 during Test II. There are several explanations for this.
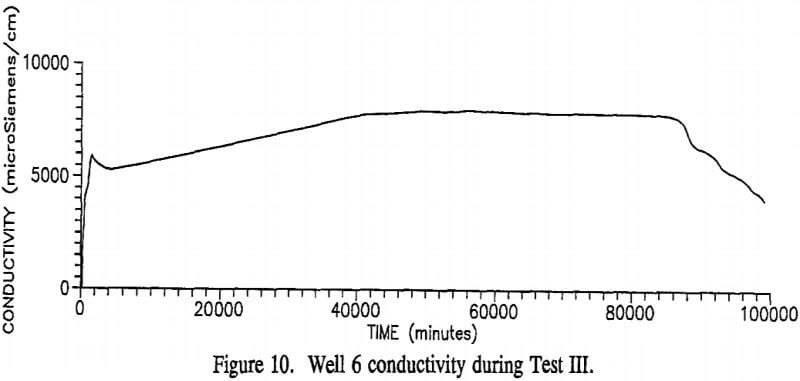
The fracture(s) transporting the tracer to the borehole could have been blocked by fine particles flowing with the tracer. Later, the water pressure on the blockage could have jarred the particles out of their position, resuming flow to borehole 6. Another explanation is that each peak had a different set of fractures transporting tracer to borehole 6. A double peak was also present during Test III (figure 10). This peak is probably due to separate fractures transporting tracer in different concentrations and rates or to an non-uniform gradient affecting the fractures.
The fractures located on the sides of the stope, instead of those underneath the stope, are the ones responsible for transmitting the water away from the stope toward borehole 6, because the borehole went dry only when there was 0.3 to 0.6 m of water remaining in the stope.
Borehole 7
Borehole 7 is located 3 to 5 m underneath the stope and parallel to the axis of the bottom drift (fig. 2). Detected tracer concentrations instantly matched the injected concentration of 3,028 µS/cm in this borehole during the first test. This instantaneous response in the borehole is probably due to a high degree of fracturing from blast damage. Also, during Test I, the bulkhead began to leak, and the overflow went down borehole 7 for a couple hours until a pump and sump were installed to catch this flow. Therefore, the data collected from this borehole after the overflow occurred were not accurate and were not used for analysis. Borehole 7 was abandoned for the next two tests, because it began to collapse.
Borehole 3
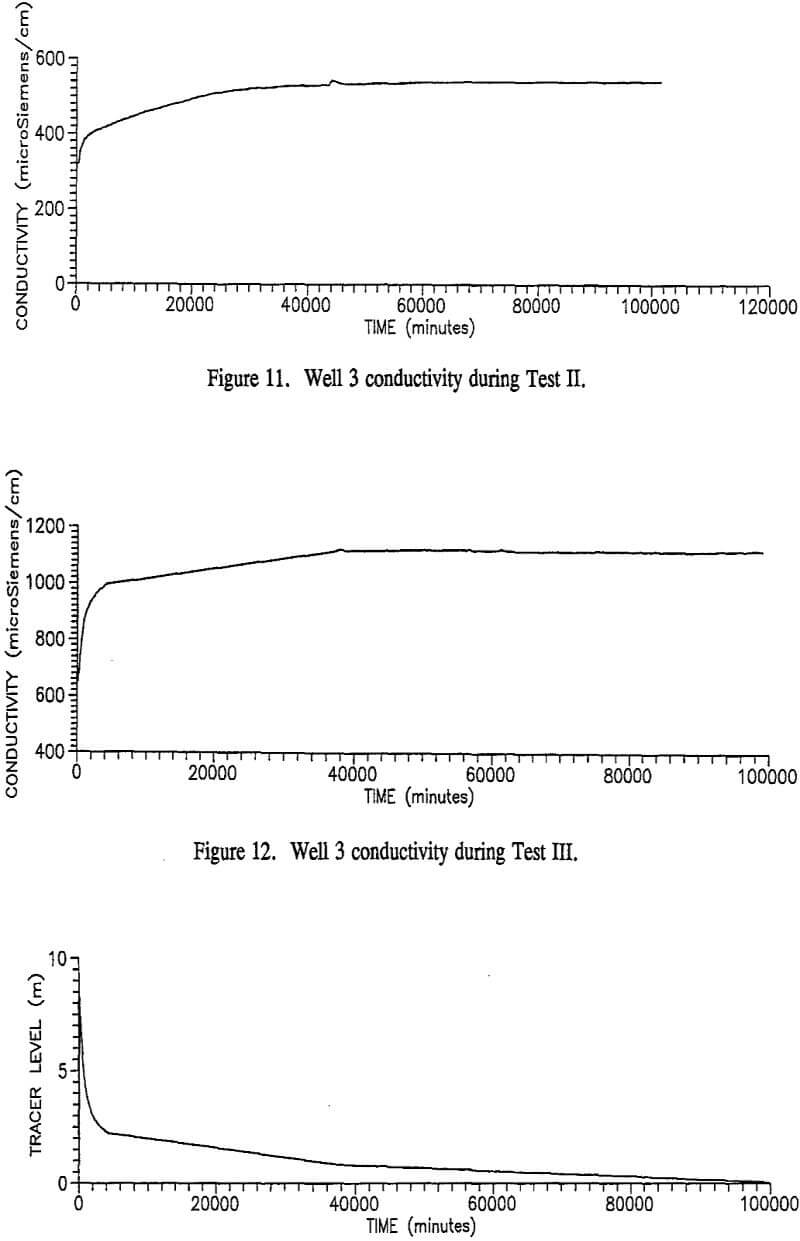
During Test I, no changes in conductivity were observed in borehole 3. During the second test, however, a change in conductivity was recorded 36 minutes into the test (figure 11). This conductivity gradually increased until the test was stopped. The maximum conductivity was approximately 1/6 of the injected tracer concentration and was lower than concentrations seen in borehole 6. This borehole is vertical and is located approximately 1.2 m away from the stope. The tracer probably flowed directly from the stope to the borehole, because a response was seen only 6 minutes after the solution reached the Test II concentration level in the stope where the new fractures are exposed. Test in suggests a new tracer path was taken because the first arrival time was longer (fig. 12). In this test it took 149 minutes for the first arrival of tracer to be detected. However, the maximum tracer concentration was reached in one-half the time from Test II. The tracer may have been cut off from finding other new paths in the rock mass, because the water level in the stope started dropping quickly. The maximum concentration in the last test was approximately 1/8 of the injected tracer concentration. Water levels were recorded in this borehole during the third test. The water level was fairly constant for the first week of the test, but began to steadily decline soon after due to the declining head in the stope.
Tracer transport velocities for the first arrival of tracer were calculated for each test. The velocity for the second test was found to be 2 cm/s and the velocity in the third test was found to be 1.3 x 10-² cm/s.
Borehole 4
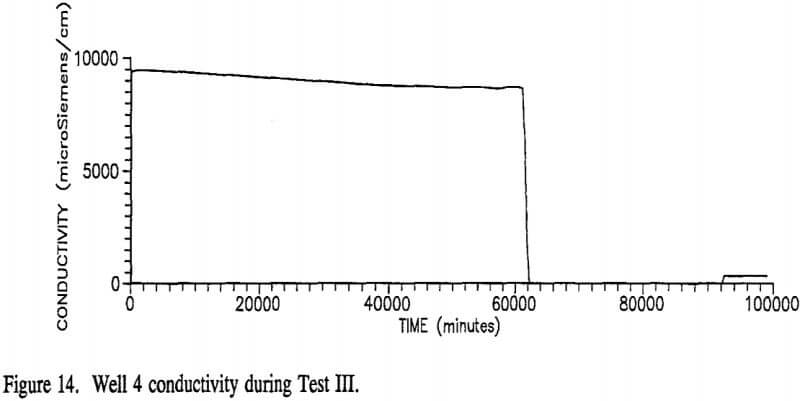
Tracer was detected in borehole 4 only during Test III. Flow still continued toward boreholes 6 and 3, but this new set of fractures seemed to conduct the tracer toward borehole 4 fairly quickly. The top third of the rock mass between borehole 4 and the stope was found to be very densely fractured when drilling borehole 4. This fracturing probably contributed to the quick response in tracer detection in this borehole. Water was lost during drilling, and hydraulic conductivities averaged to be about 3.9 x 10 -5 cm/s in this borehole during the water packer tests. The hydraulic conductivities were obtained between the depths of 2.4 and 4.2 m in this borehole. Because the head started dropping in the stope rapidly after injection (fig. 13), this connection between the stope and borehole 4 was soon discontinued. During the test, water could be observed running out of these fractures into the borehole. Tracer transport velocity was calculated to be 2 cm/s. The first arrival of the tracer was after 102 minutes, but this is about the same time that the water level was reached in the stope that hydraulically connected the fractures between the stope and borehole,
therefore the transport velocity was calculated from the time the water level in the stope reached the connecting fractures.
A second peak of tracer was observed at 92,469 minutes into the test (fig. 14). This peak could have been caused by the tracer taking several different paths to the detection point.
Summary Recommendations
After conducting the three tracer tests, several observations were made concerning solution control:
- Tracer was quickly observed in boreholes in very close proximity to the stope, specifically boreholes 3, 4, and 7. These quick responses are due to blast damage causing additional and continuous fracturing and/or from having a greater probability of fractures connecting in a relatively small volume.
- Geologic characterization of the site was critical to interpretation of the tracer test results. This characterization was also critical in running the analytical fracture flow model.
- Saturated and unsaturated fractures conducted the flow away from the stope in slightly different ways (refer to section on borehole 6).
- Conducting the test in steps/levels helped isolate certain fractures inside the stope. Packing off these
intervals would have been preferred, but impossible. This level technique turned out to be a good substitute. - The degree of fracture connectivity, rather than fracture density, is instrumental in conducting fluids.
- The increasing pressure head inside the stope may have contributed to helping the tracer find new pathways through tighter, smaller fractures.
These observations will be used in designing a plan for solution control in stope leaching research. Grouting is one technique that may be used to prevent solutions from taking certain pathways. The grouting would not only decrease the permeability of the rock mass, but may decrease fracture connectivity. However, the tracer tests showed that the tracer may find new pathways depending on in situ pressure conditions. A grout curtain would prevent solutions from escaping in one location, but those solutions may be forced to find a new path around the grout.
Pumping solution from a borehole, such as borehole 6 in the case of this site, may be another alternative to controlling the solutions. Although a large percentage of the tracer plume was already flowing toward borehole 6, pumping would have drawn more of the stray tracer toward the borehole on the larger scale. If this were an actual leaching situation, the leachant could be pumped out and processed or recycled, thus developing a remediation/leaching cycle. Pumping in combination with grouting is being considered for solution control for this research.
Other hydrologic tests are being conducted at the site. The tests described in this paper were virtually instantaneous injections. A constant head test without tracer is currently being conducted at the site. This test will address some of the questions that were brought up during the first three tests. One of the questions concerns the short time some of the fractures in the stope were exposed to the tracer and never had an opportunity to intercept the tracer plume.